Estimated zip code population in 2022: 18,268
Zip code population in 2010: 17,975
Zip code population in 2000: 16,814
Houses and condos: 7,100
Renter-occupied apartments: 967
% of renters here:
15%State:
33%
March 2022 cost of living index in zip code 33565: 96.5
(near average, U.S. average is 100)
Land area: 87.5
sq. mi.
Water area: 1.6
sq. mi.
Population density: 209 people per square mile (very low).
OSM Map
General Map
Google Map
MSN Map
OSM Map
General Map
Google Map
MSN Map
OSM Map
General Map
Google Map
MSN Map
OSM Map
General Map
Google Map
MSN Map
Please wait while loading the map...
Real estate property taxes paid for housing units in 2022:
This zip code:
0.7% ($1,905)Florida:
0.7% ($2,529)
Median real estate property taxes paid for housing units with mortgages in 2022: $2,388 (0.7%)
Median real estate property taxes paid for housing units with no mortgage in 2022: $1,364 (1.1%)
Profiles of local businesses
Business Search - 14 Million verified businesses
Males: 9,506 Females: 8,762
For population 25 years and over in 33565:
High school or higher: 83.1%Bachelor's degree or higher: 22.6%Graduate or professional degree: 8.1%Unemployed: 2.6%Mean travel time to work (commute): 29.3 minutes
For population 15 years and over in 33565:
Never married: 25.5%Now married: 53.9%Separated: 1.7%Widowed: 6.9%Divorced: 12.0%
Zip code 33565 compared to state average:
Black race population percentage significantly below state average. Foreign-born population percentage below state average. Renting percentage significantly below state average. Length of stay since moving in significantly above state average. Percentage of population with a bachelor's degree or higher below state average. 13,379 73.2% White 4,013 22.0% Hispanic or Latino 329 1.8% Two or more races 269 1.5% Black 181 1.0% Asian 71 0.4% Some other race 23 0.1% American Indian
Data:
Median household income ($)
Median household income (% change since 2000)
Household income diversity
Ratio of average income to average house value (%)
Ratio of average income to average rent
Median household income ($) - White
Median household income ($) - Black or African American
Median household income ($) - Asian
Median household income ($) - Hispanic or Latino
Median household income ($) - American Indian and Alaska Native
Median household income ($) - Multirace
Median household income ($) - Other Race
Median household income for houses/condos with a mortgage ($)
Median household income for apartments without a mortgage ($)
Races - White alone (%)
Races - White alone (% change since 2000)
Races - Black alone (%)
Races - Black alone (% change since 2000)
Races - American Indian alone (%)
Races - American Indian alone (% change since 2000)
Races - Asian alone (%)
Races - Asian alone (% change since 2000)
Races - Hispanic (%)
Races - Hispanic (% change since 2000)
Races - Native Hawaiian and Other Pacific Islander alone (%)
Races - Native Hawaiian and Other Pacific Islander alone (% change since 2000)
Races - Two or more races (%)
Races - Two or more races (% change since 2000)
Races - Other race alone (%)
Races - Other race alone (% change since 2000)
Racial diversity
Unemployment (%)
Unemployment (% change since 2000)
Unemployment (%) - White
Unemployment (%) - Black or African American
Unemployment (%) - Asian
Unemployment (%) - Hispanic or Latino
Unemployment (%) - American Indian and Alaska Native
Unemployment (%) - Multirace
Unemployment (%) - Other Race
Population density (people per square mile)
Population - Males (%)
Population - Females (%)
Population - Males (%) - White
Population - Males (%) - Black or African American
Population - Males (%) - Asian
Population - Males (%) - Hispanic or Latino
Population - Males (%) - American Indian and Alaska Native
Population - Males (%) - Multirace
Population - Males (%) - Other Race
Population - Females (%) - White
Population - Females (%) - Black or African American
Population - Females (%) - Asian
Population - Females (%) - Hispanic or Latino
Population - Females (%) - American Indian and Alaska Native
Population - Females (%) - Multirace
Population - Females (%) - Other Race
Coronavirus confirmed cases (Apr 27, 2024)
Deaths caused by coronavirus (Apr 27, 2024)
Coronavirus confirmed cases (per 100k population) (Apr 27, 2024)
Deaths caused by coronavirus (per 100k population) (Apr 27, 2024)
Daily increase in number of cases (Apr 27, 2024)
Weekly increase in number of cases (Apr 27, 2024)
Cases doubled (in days) (Apr 27, 2024)
Hospitalized patients (Apr 18, 2022)
Negative test results (Apr 18, 2022)
Total test results (Apr 18, 2022)
COVID Vaccine doses distributed (per 100k population) (Sep 19, 2023)
COVID Vaccine doses administered (per 100k population) (Sep 19, 2023)
COVID Vaccine doses distributed (Sep 19, 2023)
COVID Vaccine doses administered (Sep 19, 2023)
Likely homosexual households (%)
Likely homosexual households (% change since 2000)
Likely homosexual households - Lesbian couples (%)
Likely homosexual households - Lesbian couples (% change since 2000)
Likely homosexual households - Gay men (%)
Likely homosexual households - Gay men (% change since 2000)
Cost of living index
Median gross rent ($)
Median contract rent ($)
Median monthly housing costs ($)
Median house or condo value ($)
Median house or condo value ($ change since 2000)
Mean house or condo value by units in structure - 1, detached ($)
Mean house or condo value by units in structure - 1, attached ($)
Mean house or condo value by units in structure - 2 ($)
Mean house or condo value by units in structure by units in structure - 3 or 4 ($)
Mean house or condo value by units in structure - 5 or more ($)
Mean house or condo value by units in structure - Boat, RV, van, etc. ($)
Mean house or condo value by units in structure - Mobile home ($)
Median house or condo value ($) - White
Median house or condo value ($) - Black or African American
Median house or condo value ($) - Asian
Median house or condo value ($) - Hispanic or Latino
Median house or condo value ($) - American Indian and Alaska Native
Median house or condo value ($) - Multirace
Median house or condo value ($) - Other Race
Median resident age
Resident age diversity
Median resident age - Males
Median resident age - Females
Median resident age - White
Median resident age - Black or African American
Median resident age - Asian
Median resident age - Hispanic or Latino
Median resident age - American Indian and Alaska Native
Median resident age - Multirace
Median resident age - Other Race
Median resident age - Males - White
Median resident age - Males - Black or African American
Median resident age - Males - Asian
Median resident age - Males - Hispanic or Latino
Median resident age - Males - American Indian and Alaska Native
Median resident age - Males - Multirace
Median resident age - Males - Other Race
Median resident age - Females - White
Median resident age - Females - Black or African American
Median resident age - Females - Asian
Median resident age - Females - Hispanic or Latino
Median resident age - Females - American Indian and Alaska Native
Median resident age - Females - Multirace
Median resident age - Females - Other Race
Commute - mean travel time to work (minutes)
Travel time to work - Less than 5 minutes (%)
Travel time to work - Less than 5 minutes (% change since 2000)
Travel time to work - 5 to 9 minutes (%)
Travel time to work - 5 to 9 minutes (% change since 2000)
Travel time to work - 10 to 19 minutes (%)
Travel time to work - 10 to 19 minutes (% change since 2000)
Travel time to work - 20 to 29 minutes (%)
Travel time to work - 20 to 29 minutes (% change since 2000)
Travel time to work - 30 to 39 minutes (%)
Travel time to work - 30 to 39 minutes (% change since 2000)
Travel time to work - 40 to 59 minutes (%)
Travel time to work - 40 to 59 minutes (% change since 2000)
Travel time to work - 60 to 89 minutes (%)
Travel time to work - 60 to 89 minutes (% change since 2000)
Travel time to work - 90 or more minutes (%)
Travel time to work - 90 or more minutes (% change since 2000)
Marital status - Never married (%)
Marital status - Now married (%)
Marital status - Separated (%)
Marital status - Widowed (%)
Marital status - Divorced (%)
Median family income ($)
Median family income (% change since 2000)
Median non-family income ($)
Median non-family income (% change since 2000)
Median per capita income ($)
Median per capita income (% change since 2000)
Median family income ($) - White
Median family income ($) - Black or African American
Median family income ($) - Asian
Median family income ($) - Hispanic or Latino
Median family income ($) - American Indian and Alaska Native
Median family income ($) - Multirace
Median family income ($) - Other Race
Median year house/condo built
Median year apartment built
Year house built - Built 2005 or later (%)
Year house built - Built 2000 to 2004 (%)
Year house built - Built 1990 to 1999 (%)
Year house built - Built 1980 to 1989 (%)
Year house built - Built 1970 to 1979 (%)
Year house built - Built 1960 to 1969 (%)
Year house built - Built 1950 to 1959 (%)
Year house built - Built 1940 to 1949 (%)
Year house built - Built 1939 or earlier (%)
Average household size
Household density (households per square mile)
Average household size - White
Average household size - Black or African American
Average household size - Asian
Average household size - Hispanic or Latino
Average household size - American Indian and Alaska Native
Average household size - Multirace
Average household size - Other Race
Occupied housing units (%)
Vacant housing units (%)
Owner occupied housing units (%)
Renter occupied housing units (%)
Vacancy status - For rent (%)
Vacancy status - For sale only (%)
Vacancy status - Rented or sold, not occupied (%)
Vacancy status - For seasonal, recreational, or occasional use (%)
Vacancy status - For migrant workers (%)
Vacancy status - Other vacant (%)
Residents with income below the poverty level (%)
Residents with income below 50% of the poverty level (%)
Children below poverty level (%)
Poor families by family type - Married-couple family (%)
Poor families by family type - Male, no wife present (%)
Poor families by family type - Female, no husband present (%)
Poverty status for native-born residents (%)
Poverty status for foreign-born residents (%)
Poverty among high school graduates not in families (%)
Poverty among people who did not graduate high school not in families (%)
Residents with income below the poverty level (%) - White
Residents with income below the poverty level (%) - Black or African American
Residents with income below the poverty level (%) - Asian
Residents with income below the poverty level (%) - Hispanic or Latino
Residents with income below the poverty level (%) - American Indian and Alaska Native
Residents with income below the poverty level (%) - Multirace
Residents with income below the poverty level (%) - Other Race
Air pollution - Air Quality Index (AQI)
Air pollution - CO
Air pollution - NO2
Air pollution - SO2
Air pollution - Ozone
Air pollution - PM10
Air pollution - PM25
Air pollution - Pb
Crime - Murders per 100,000 population
Crime - Rapes per 100,000 population
Crime - Robberies per 100,000 population
Crime - Assaults per 100,000 population
Crime - Burglaries per 100,000 population
Crime - Thefts per 100,000 population
Crime - Auto thefts per 100,000 population
Crime - Arson per 100,000 population
Crime - City-data.com crime index
Crime - Violent crime index
Crime - Property crime index
Crime - Murders per 100,000 population (5 year average)
Crime - Rapes per 100,000 population (5 year average)
Crime - Robberies per 100,000 population (5 year average)
Crime - Assaults per 100,000 population (5 year average)
Crime - Burglaries per 100,000 population (5 year average)
Crime - Thefts per 100,000 population (5 year average)
Crime - Auto thefts per 100,000 population (5 year average)
Crime - Arson per 100,000 population (5 year average)
Crime - City-data.com crime index (5 year average)
Crime - Violent crime index (5 year average)
Crime - Property crime index (5 year average)
1996 Presidential Elections Results (%) - Democratic Party (Clinton)
1996 Presidential Elections Results (%) - Republican Party (Dole)
1996 Presidential Elections Results (%) - Other
2000 Presidential Elections Results (%) - Democratic Party (Gore)
2000 Presidential Elections Results (%) - Republican Party (Bush)
2000 Presidential Elections Results (%) - Other
2004 Presidential Elections Results (%) - Democratic Party (Kerry)
2004 Presidential Elections Results (%) - Republican Party (Bush)
2004 Presidential Elections Results (%) - Other
2008 Presidential Elections Results (%) - Democratic Party (Obama)
2008 Presidential Elections Results (%) - Republican Party (McCain)
2008 Presidential Elections Results (%) - Other
2012 Presidential Elections Results (%) - Democratic Party (Obama)
2012 Presidential Elections Results (%) - Republican Party (Romney)
2012 Presidential Elections Results (%) - Other
2016 Presidential Elections Results (%) - Democratic Party (Clinton)
2016 Presidential Elections Results (%) - Republican Party (Trump)
2016 Presidential Elections Results (%) - Other
2020 Presidential Elections Results (%) - Democratic Party (Biden)
2020 Presidential Elections Results (%) - Republican Party (Trump)
2020 Presidential Elections Results (%) - Other
Ancestries Reported - Arab (%)
Ancestries Reported - Czech (%)
Ancestries Reported - Danish (%)
Ancestries Reported - Dutch (%)
Ancestries Reported - English (%)
Ancestries Reported - French (%)
Ancestries Reported - French Canadian (%)
Ancestries Reported - German (%)
Ancestries Reported - Greek (%)
Ancestries Reported - Hungarian (%)
Ancestries Reported - Irish (%)
Ancestries Reported - Italian (%)
Ancestries Reported - Lithuanian (%)
Ancestries Reported - Norwegian (%)
Ancestries Reported - Polish (%)
Ancestries Reported - Portuguese (%)
Ancestries Reported - Russian (%)
Ancestries Reported - Scotch-Irish (%)
Ancestries Reported - Scottish (%)
Ancestries Reported - Slovak (%)
Ancestries Reported - Subsaharan African (%)
Ancestries Reported - Swedish (%)
Ancestries Reported - Swiss (%)
Ancestries Reported - Ukrainian (%)
Ancestries Reported - United States (%)
Ancestries Reported - Welsh (%)
Ancestries Reported - West Indian (%)
Ancestries Reported - Other (%)
Educational Attainment - No schooling completed (%)
Educational Attainment - Less than high school (%)
Educational Attainment - High school or equivalent (%)
Educational Attainment - Less than 1 year of college (%)
Educational Attainment - 1 or more years of college (%)
Educational Attainment - Associate degree (%)
Educational Attainment - Bachelor's degree (%)
Educational Attainment - Master's degree (%)
Educational Attainment - Professional school degree (%)
Educational Attainment - Doctorate degree (%)
School Enrollment - Nursery, preschool (%)
School Enrollment - Kindergarten (%)
School Enrollment - Grade 1 to 4 (%)
School Enrollment - Grade 5 to 8 (%)
School Enrollment - Grade 9 to 12 (%)
School Enrollment - College undergrad (%)
School Enrollment - Graduate or professional (%)
School Enrollment - Not enrolled in school (%)
School enrollment - Public schools (%)
School enrollment - Private schools (%)
School enrollment - Not enrolled (%)
Median number of rooms in houses and condos
Median number of rooms in apartments
Housing units lacking complete plumbing facilities (%)
Housing units lacking complete kitchen facilities (%)
Density of houses
Urban houses (%)
Rural houses (%)
Households with people 60 years and over (%)
Households with people 65 years and over (%)
Households with people 75 years and over (%)
Households with one or more nonrelatives (%)
Households with no nonrelatives (%)
Population in households (%)
Family households (%)
Nonfamily households (%)
Population in families (%)
Family households with own children (%)
Median number of bedrooms in owner occupied houses
Mean number of bedrooms in owner occupied houses
Median number of bedrooms in renter occupied houses
Mean number of bedrooms in renter occupied houses
Median number of vehichles in owner occupied houses
Mean number of vehichles in owner occupied houses
Median number of vehichles in renter occupied houses
Mean number of vehichles in renter occupied houses
Mortgage status - with mortgage (%)
Mortgage status - with second mortgage (%)
Mortgage status - with home equity loan (%)
Mortgage status - with both second mortgage and home equity loan (%)
Mortgage status - without a mortgage (%)
Average family size
Average family size - White
Average family size - Black or African American
Average family size - Asian
Average family size - Hispanic or Latino
Average family size - American Indian and Alaska Native
Average family size - Multirace
Average family size - Other Race
Geographical mobility - Same house 1 year ago (%)
Geographical mobility - Moved within same county (%)
Geographical mobility - Moved from different county within same state (%)
Geographical mobility - Moved from different state (%)
Geographical mobility - Moved from abroad (%)
Place of birth - Born in state of residence (%)
Place of birth - Born in other state (%)
Place of birth - Native, outside of US (%)
Place of birth - Foreign born (%)
Housing units in structures - 1, detached (%)
Housing units in structures - 1, attached (%)
Housing units in structures - 2 (%)
Housing units in structures - 3 or 4 (%)
Housing units in structures - 5 to 9 (%)
Housing units in structures - 10 to 19 (%)
Housing units in structures - 20 to 49 (%)
Housing units in structures - 50 or more (%)
Housing units in structures - Mobile home (%)
Housing units in structures - Boat, RV, van, etc. (%)
House/condo owner moved in on average (years ago)
Renter moved in on average (years ago)
Year householder moved into unit - Moved in 1999 to March 2000 (%)
Year householder moved into unit - Moved in 1995 to 1998 (%)
Year householder moved into unit - Moved in 1990 to 1994 (%)
Year householder moved into unit - Moved in 1980 to 1989 (%)
Year householder moved into unit - Moved in 1970 to 1979 (%)
Year householder moved into unit - Moved in 1969 or earlier (%)
Means of transportation to work - Drove car alone (%)
Means of transportation to work - Carpooled (%)
Means of transportation to work - Public transportation (%)
Means of transportation to work - Bus or trolley bus (%)
Means of transportation to work - Streetcar or trolley car (%)
Means of transportation to work - Subway or elevated (%)
Means of transportation to work - Railroad (%)
Means of transportation to work - Ferryboat (%)
Means of transportation to work - Taxicab (%)
Means of transportation to work - Motorcycle (%)
Means of transportation to work - Bicycle (%)
Means of transportation to work - Walked (%)
Means of transportation to work - Other means (%)
Working at home (%)
Industry diversity
Most Common Industries - Agriculture, forestry, fishing and hunting, and mining (%)
Most Common Industries - Agriculture, forestry, fishing and hunting (%)
Most Common Industries - Mining, quarrying, and oil and gas extraction (%)
Most Common Industries - Construction (%)
Most Common Industries - Manufacturing (%)
Most Common Industries - Wholesale trade (%)
Most Common Industries - Retail trade (%)
Most Common Industries - Transportation and warehousing, and utilities (%)
Most Common Industries - Transportation and warehousing (%)
Most Common Industries - Utilities (%)
Most Common Industries - Information (%)
Most Common Industries - Finance and insurance, and real estate and rental and leasing (%)
Most Common Industries - Finance and insurance (%)
Most Common Industries - Real estate and rental and leasing (%)
Most Common Industries - Professional, scientific, and management, and administrative and waste management services (%)
Most Common Industries - Professional, scientific, and technical services (%)
Most Common Industries - Management of companies and enterprises (%)
Most Common Industries - Administrative and support and waste management services (%)
Most Common Industries - Educational services, and health care and social assistance (%)
Most Common Industries - Educational services (%)
Most Common Industries - Health care and social assistance (%)
Most Common Industries - Arts, entertainment, and recreation, and accommodation and food services (%)
Most Common Industries - Arts, entertainment, and recreation (%)
Most Common Industries - Accommodation and food services (%)
Most Common Industries - Other services, except public administration (%)
Most Common Industries - Public administration (%)
Occupation diversity
Most Common Occupations - Management, business, science, and arts occupations (%)
Most Common Occupations - Management, business, and financial occupations (%)
Most Common Occupations - Management occupations (%)
Most Common Occupations - Business and financial operations occupations (%)
Most Common Occupations - Computer, engineering, and science occupations (%)
Most Common Occupations - Computer and mathematical occupations (%)
Most Common Occupations - Architecture and engineering occupations (%)
Most Common Occupations - Life, physical, and social science occupations (%)
Most Common Occupations - Education, legal, community service, arts, and media occupations (%)
Most Common Occupations - Community and social service occupations (%)
Most Common Occupations - Legal occupations (%)
Most Common Occupations - Education, training, and library occupations (%)
Most Common Occupations - Arts, design, entertainment, sports, and media occupations (%)
Most Common Occupations - Healthcare practitioners and technical occupations (%)
Most Common Occupations - Health diagnosing and treating practitioners and other technical occupations (%)
Most Common Occupations - Health technologists and technicians (%)
Most Common Occupations - Service occupations (%)
Most Common Occupations - Healthcare support occupations (%)
Most Common Occupations - Protective service occupations (%)
Most Common Occupations - Fire fighting and prevention, and other protective service workers including supervisors (%)
Most Common Occupations - Law enforcement workers including supervisors (%)
Most Common Occupations - Food preparation and serving related occupations (%)
Most Common Occupations - Building and grounds cleaning and maintenance occupations (%)
Most Common Occupations - Personal care and service occupations (%)
Most Common Occupations - Sales and office occupations (%)
Most Common Occupations - Sales and related occupations (%)
Most Common Occupations - Office and administrative support occupations (%)
Most Common Occupations - Natural resources, construction, and maintenance occupations (%)
Most Common Occupations - Farming, fishing, and forestry occupations (%)
Most Common Occupations - Construction and extraction occupations (%)
Most Common Occupations - Installation, maintenance, and repair occupations (%)
Most Common Occupations - Production, transportation, and material moving occupations (%)
Most Common Occupations - Production occupations (%)
Most Common Occupations - Transportation occupations (%)
Most Common Occupations - Material moving occupations (%)
People in Group quarters - Institutionalized population (%)
People in Group quarters - Correctional institutions (%)
People in Group quarters - Federal prisons and detention centers (%)
People in Group quarters - Halfway houses (%)
People in Group quarters - Local jails and other confinement facilities (including police lockups) (%)
People in Group quarters - Military disciplinary barracks (%)
People in Group quarters - State prisons (%)
People in Group quarters - Other types of correctional institutions (%)
People in Group quarters - Nursing homes (%)
People in Group quarters - Hospitals/wards, hospices, and schools for the handicapped (%)
People in Group quarters - Hospitals/wards and hospices for chronically ill (%)
People in Group quarters - Hospices or homes for chronically ill (%)
People in Group quarters - Military hospitals or wards for chronically ill (%)
People in Group quarters - Other hospitals or wards for chronically ill (%)
People in Group quarters - Hospitals or wards for drug/alcohol abuse (%)
People in Group quarters - Mental (Psychiatric) hospitals or wards (%)
People in Group quarters - Schools, hospitals, or wards for the mentally retarded (%)
People in Group quarters - Schools, hospitals, or wards for the physically handicapped (%)
People in Group quarters - Institutions for the deaf (%)
People in Group quarters - Institutions for the blind (%)
People in Group quarters - Orthopedic wards and institutions for the physically handicapped (%)
People in Group quarters - Wards in general hospitals for patients who have no usual home elsewhere (%)
People in Group quarters - Wards in military hospitals for patients who have no usual home elsewhere (%)
People in Group quarters - Juvenile institutions (%)
People in Group quarters - Long-term care (%)
People in Group quarters - Homes for abused, dependent, and neglected children (%)
People in Group quarters - Residential treatment centers for emotionally disturbed children (%)
People in Group quarters - Training schools for juvenile delinquents (%)
People in Group quarters - Short-term care, detention or diagnostic centers for delinquent children (%)
People in Group quarters - Type of juvenile institution unknown (%)
People in Group quarters - Noninstitutionalized population (%)
People in Group quarters - College dormitories (includes college quarters off campus) (%)
People in Group quarters - Military quarters (%)
People in Group quarters - On base (%)
People in Group quarters - Barracks, unaccompanied personnel housing (UPH), (Enlisted/Officer), ;and similar group living quarters for military personnel (%)
People in Group quarters - Transient quarters for temporary residents (%)
People in Group quarters - Military ships (%)
People in Group quarters - Group homes (%)
People in Group quarters - Homes or halfway houses for drug/alcohol abuse (%)
People in Group quarters - Homes for the mentally ill (%)
People in Group quarters - Homes for the mentally retarded (%)
People in Group quarters - Homes for the physically handicapped (%)
People in Group quarters - Other group homes (%)
People in Group quarters - Religious group quarters (%)
People in Group quarters - Dormitories (%)
People in Group quarters - Agriculture workers' dormitories on farms (%)
People in Group quarters - Job Corps and vocational training facilities (%)
People in Group quarters - Other workers' dormitories (%)
People in Group quarters - Crews of maritime vessels (%)
People in Group quarters - Other nonhousehold living situations (%)
People in Group quarters - Other noninstitutional group quarters (%)
Residents speaking English at home (%)
Residents speaking English at home - Born in the United States (%)
Residents speaking English at home - Native, born elsewhere (%)
Residents speaking English at home - Foreign born (%)
Residents speaking Spanish at home (%)
Residents speaking Spanish at home - Born in the United States (%)
Residents speaking Spanish at home - Native, born elsewhere (%)
Residents speaking Spanish at home - Foreign born (%)
Residents speaking other language at home (%)
Residents speaking other language at home - Born in the United States (%)
Residents speaking other language at home - Native, born elsewhere (%)
Residents speaking other language at home - Foreign born (%)
Class of Workers - Employee of private company (%)
Class of Workers - Self-employed in own incorporated business (%)
Class of Workers - Private not-for-profit wage and salary workers (%)
Class of Workers - Local government workers (%)
Class of Workers - State government workers (%)
Class of Workers - Federal government workers (%)
Class of Workers - Self-employed workers in own not incorporated business and Unpaid family workers (%)
House heating fuel used in houses and condos - Utility gas (%)
House heating fuel used in houses and condos - Bottled, tank, or LP gas (%)
House heating fuel used in houses and condos - Electricity (%)
House heating fuel used in houses and condos - Fuel oil, kerosene, etc. (%)
House heating fuel used in houses and condos - Coal or coke (%)
House heating fuel used in houses and condos - Wood (%)
House heating fuel used in houses and condos - Solar energy (%)
House heating fuel used in houses and condos - Other fuel (%)
House heating fuel used in houses and condos - No fuel used (%)
House heating fuel used in apartments - Utility gas (%)
House heating fuel used in apartments - Bottled, tank, or LP gas (%)
House heating fuel used in apartments - Electricity (%)
House heating fuel used in apartments - Fuel oil, kerosene, etc. (%)
House heating fuel used in apartments - Coal or coke (%)
House heating fuel used in apartments - Wood (%)
House heating fuel used in apartments - Solar energy (%)
House heating fuel used in apartments - Other fuel (%)
House heating fuel used in apartments - No fuel used (%)
Armed forces status - In Armed Forces (%)
Armed forces status - Civilian (%)
Armed forces status - Civilian - Veteran (%)
Armed forces status - Civilian - Nonveteran (%)
Fatal accidents locations in years 2005-2021
Fatal accidents locations in 2005
Fatal accidents locations in 2006
Fatal accidents locations in 2007
Fatal accidents locations in 2008
Fatal accidents locations in 2009
Fatal accidents locations in 2010
Fatal accidents locations in 2011
Fatal accidents locations in 2012
Fatal accidents locations in 2013
Fatal accidents locations in 2014
Fatal accidents locations in 2015
Fatal accidents locations in 2016
Fatal accidents locations in 2017
Fatal accidents locations in 2018
Fatal accidents locations in 2019
Fatal accidents locations in 2020
Fatal accidents locations in 2021
Alcohol use - People drinking some alcohol every month (%)
Alcohol use - People not drinking at all (%)
Alcohol use - Average days/month drinking alcohol
Alcohol use - Average drinks/week
Alcohol use - Average days/year people drink much
Audiometry - Average condition of hearing (%)
Audiometry - People that can hear a whisper from across a quiet room (%)
Audiometry - People that can hear normal voice from across a quiet room (%)
Audiometry - Ears ringing, roaring, buzzing (%)
Audiometry - Had a job exposure to loud noise (%)
Audiometry - Had off-work exposure to loud noise (%)
Blood Pressure & Cholesterol - Has high blood pressure (%)
Blood Pressure & Cholesterol - Checking blood pressure at home (%)
Blood Pressure & Cholesterol - Frequently checking blood cholesterol (%)
Blood Pressure & Cholesterol - Has high cholesterol level (%)
Consumer Behavior - Money monthly spent on food at supermarket/grocery store
Consumer Behavior - Money monthly spent on food at other stores
Consumer Behavior - Money monthly spent on eating out
Consumer Behavior - Money monthly spent on carryout/delivered foods
Consumer Behavior - Income spent on food at supermarket/grocery store (%)
Consumer Behavior - Income spent on food at other stores (%)
Consumer Behavior - Income spent on eating out (%)
Consumer Behavior - Income spent on carryout/delivered foods (%)
Current Health Status - General health condition (%)
Current Health Status - Blood donors (%)
Current Health Status - Has blood ever tested for HIV virus (%)
Current Health Status - Left-handed people (%)
Dermatology - People using sunscreen (%)
Diabetes - Diabetics (%)
Diabetes - Had a blood test for high blood sugar (%)
Diabetes - People taking insulin (%)
Diet Behavior & Nutrition - Diet health (%)
Diet Behavior & Nutrition - Milk product consumption (# of products/month)
Diet Behavior & Nutrition - Meals not home prepared (#/week)
Diet Behavior & Nutrition - Meals from fast food or pizza place (#/week)
Diet Behavior & Nutrition - Ready-to-eat foods (#/month)
Diet Behavior & Nutrition - Frozen meals/pizza (#/month)
Drug Use - People that ever used marijuana or hashish (%)
Drug Use - Ever used hard drugs (%)
Drug Use - Ever used any form of cocaine (%)
Drug Use - Ever used heroin (%)
Drug Use - Ever used methamphetamine (%)
Health Insurance - People covered by health insurance (%)
Kidney Conditions-Urology - Avg. # of times urinating at night
Medical Conditions - People with asthma (%)
Medical Conditions - People with anemia (%)
Medical Conditions - People with psoriasis (%)
Medical Conditions - People with overweight (%)
Medical Conditions - Elderly people having difficulties in thinking or remembering (%)
Medical Conditions - People who ever received blood transfusion (%)
Medical Conditions - People having trouble seeing even with glass/contacts (%)
Medical Conditions - People with arthritis (%)
Medical Conditions - People with gout (%)
Medical Conditions - People with congestive heart failure (%)
Medical Conditions - People with coronary heart disease (%)
Medical Conditions - People with angina pectoris (%)
Medical Conditions - People who ever had heart attack (%)
Medical Conditions - People who ever had stroke (%)
Medical Conditions - People with emphysema (%)
Medical Conditions - People with thyroid problem (%)
Medical Conditions - People with chronic bronchitis (%)
Medical Conditions - People with any liver condition (%)
Medical Conditions - People who ever had cancer or malignancy (%)
Mental Health - People who have little interest in doing things (%)
Mental Health - People feeling down, depressed, or hopeless (%)
Mental Health - People who have trouble sleeping or sleeping too much (%)
Mental Health - People feeling tired or having little energy (%)
Mental Health - People with poor appetite or overeating (%)
Mental Health - People feeling bad about themself (%)
Mental Health - People who have trouble concentrating on things (%)
Mental Health - People moving or speaking slowly or too fast (%)
Mental Health - People having thoughts they would be better off dead (%)
Oral Health - Average years since last visit a dentist
Oral Health - People embarrassed because of mouth (%)
Oral Health - People with gum disease (%)
Oral Health - General health of teeth and gums (%)
Oral Health - Average days a week using dental floss/device
Oral Health - Average days a week using mouthwash for dental problem
Oral Health - Average number of teeth
Pesticide Use - Households using pesticides to control insects (%)
Pesticide Use - Households using pesticides to kill weeds (%)
Physical Activity - People doing vigorous-intensity work activities (%)
Physical Activity - People doing moderate-intensity work activities (%)
Physical Activity - People walking or bicycling (%)
Physical Activity - People doing vigorous-intensity recreational activities (%)
Physical Activity - People doing moderate-intensity recreational activities (%)
Physical Activity - Average hours a day doing sedentary activities
Physical Activity - Average hours a day watching TV or videos
Physical Activity - Average hours a day using computer
Physical Functioning - People having limitations keeping them from working (%)
Physical Functioning - People limited in amount of work they can do (%)
Physical Functioning - People that need special equipment to walk (%)
Physical Functioning - People experiencing confusion/memory problems (%)
Physical Functioning - People requiring special healthcare equipment (%)
Prescription Medications - Average number of prescription medicines taking
Preventive Aspirin Use - Adults 40+ taking low-dose aspirin (%)
Reproductive Health - Vaginal deliveries (%)
Reproductive Health - Cesarean deliveries (%)
Reproductive Health - Deliveries resulted in a live birth (%)
Reproductive Health - Pregnancies resulted in a delivery (%)
Reproductive Health - Women breastfeeding newborns (%)
Reproductive Health - Women that had a hysterectomy (%)
Reproductive Health - Women that had both ovaries removed (%)
Reproductive Health - Women that have ever taken birth control pills (%)
Reproductive Health - Women taking birth control pills (%)
Reproductive Health - Women that have ever used Depo-Provera or injectables (%)
Reproductive Health - Women that have ever used female hormones (%)
Sexual Behavior - People 18+ that ever had sex (vaginal, anal, or oral) (%)
Sexual Behavior - Males 18+ that ever had vaginal sex with a woman (%)
Sexual Behavior - Males 18+ that ever performed oral sex on a woman (%)
Sexual Behavior - Males 18+ that ever had anal sex with a woman (%)
Sexual Behavior - Males 18+ that ever had any sex with a man (%)
Sexual Behavior - Females 18+ that ever had vaginal sex with a man (%)
Sexual Behavior - Females 18+ that ever performed oral sex on a man (%)
Sexual Behavior - Females 18+ that ever had anal sex with a man (%)
Sexual Behavior - Females 18+ that ever had any kind of sex with a woman (%)
Sexual Behavior - Average age people first had sex
Sexual Behavior - Average number of female sex partners in lifetime (males 18+)
Sexual Behavior - Average number of female vaginal sex partners in lifetime (males 18+)
Sexual Behavior - Average age people first performed oral sex on a woman (18+)
Sexual Behavior - Average number of woman performed oral sex on in lifetime (18+)
Sexual Behavior - Average number of male sex partners in lifetime (males 18+)
Sexual Behavior - Average number of male anal sex partners in lifetime (males 18+)
Sexual Behavior - Average age people first performed oral sex on a man (18+)
Sexual Behavior - Average number of male oral sex partners in lifetime (18+)
Sexual Behavior - People using protection when performing oral sex (%)
Sexual Behavior - Average number of times people have vaginal or anal sex a year
Sexual Behavior - People having sex without condom (%)
Sexual Behavior - Average number of male sex partners in lifetime (females 18+)
Sexual Behavior - Average number of male vaginal sex partners in lifetime (females 18+)
Sexual Behavior - Average number of female sex partners in lifetime (females 18+)
Sexual Behavior - Circumcised males 18+ (%)
Sleep Disorders - Average hours sleeping at night
Sleep Disorders - People that has trouble sleeping (%)
Smoking-Cigarette Use - People smoking cigarettes (%)
Taste & Smell - People 40+ having problems with smell (%)
Taste & Smell - People 40+ having problems with taste (%)
Taste & Smell - People 40+ that ever had wisdom teeth removed (%)
Taste & Smell - People 40+ that ever had tonsils teeth removed (%)
Taste & Smell - People 40+ that ever had a loss of consciousness because of a head injury (%)
Taste & Smell - People 40+ that ever had a broken nose or other serious injury to face or skull (%)
Taste & Smell - People 40+ that ever had two or more sinus infections (%)
Weight - Average height (inches)
Weight - Average weight (pounds)
Weight - Average BMI
Weight - People that are obese (%)
Weight - People that ever were obese (%)
Weight - People trying to lose weight (%)
Urban population: 7,472
Rural population: 10,795
Estimated median house/condo value in 2022: $259,940
33565:
$259,940Florida:
$354,100
Median resident age: This zip code:
43.4 yearsFlorida median age:
42.7 years
Average household size: This zip code:
2.7 peopleFlorida:
2.5 people
Averages for the 2020 tax year for zip code 33565, filed in 2021:
Average Adjusted Gross Income (AGI) in 2020: $60,718 (Individual Income Tax Returns) Here:
$60,718State:
$82,200
Salary/wage: $53,588 (reported on 80.0% of returns )Here:
$53,588State:
$58,347
(% of AGI for various income ranges: 1190.0% for AGIs below $25k , 3713.9% for AGIs $25k-50k , 6491.4% for AGIs $50k-75k , 8967.1% for AGIs $75k-100k , 16597.1% for AGIs $100k-200k , 63767.5% for AGIs over 200k ) Taxable interest for individuals: $1,520 (reported on 23.6% of returns )This zip code:
$1,520Florida:
$4,272
(% of AGI for various income ranges: 14.5% for AGIs below $25k , 16.2% for AGIs $25k-50k , 53.2% for AGIs $50k-75k , 59.0% for AGIs $75k-100k , 106.0% for AGIs $100k-200k , 1098.8% for AGIs over 200k ) Ordinary dividends: $4,721 (reported on 13.4% of returns )(% of AGI for various income ranges: 18.8% for AGIs below $25k , 33.8% for AGIs $25k-50k , 64.7% for AGIs $50k-75k , 141.7% for AGIs $75k-100k , 214.3% for AGIs $100k-200k , 1856.2% for AGIs over 200k ) Net capital gain/loss in AGI: +$13,876 (reported on 11.3% of returns )Here:
+$13,876State:
+$62,983
(% of AGI for various income ranges: 12.7% for AGIs below $25k , 31.2% for AGIs $25k-50k , 45.1% for AGIs $50k-75k , 162.7% for AGIs $75k-100k , 424.0% for AGIs $100k-200k , 9645.0% for AGIs over 200k ) Profit/loss from business: +$9,976 (reported on 15.2% of returns )Here:
+$9,976State:
+$9,719
(% of AGI for various income ranges: 144.4% for AGIs below $25k , 155.9% for AGIs $25k-50k , 202.8% for AGIs $50k-75k , 273.3% for AGIs $75k-100k , 320.3% for AGIs $100k-200k , 2003.8% for AGIs over 200k ) Taxable individual retirement arrangement distribution: $15,913 (reported on 8.9% of returns )33565:
$15,913Florida:
$24,823
(% of AGI for various income ranges: 57.5% for AGIs below $25k , 92.0% for AGIs $25k-50k , 162.8% for AGIs $50k-75k , 545.6% for AGIs $75k-100k , 493.4% for AGIs $100k-200k , 1768.8% for AGIs over 200k ) Total itemized deductions: $34,613 (reported on 5.7% of returns )Here:
$34,613State:
$45,393
(% of AGI for various income ranges: 18.5% for AGIs below $25k , 112.9% for AGIs $25k-50k , 255.7% for AGIs $50k-75k , 391.0% for AGIs $75k-100k , 762.4% for AGIs $100k-200k , 5390.0% for AGIs over 200k ) Charity contributions: $13,308 (reported on 4.5% of returns )Here:
$13,308State:
$20,178
(% of AGI for various income ranges: 17.7% for AGIs $25k-50k , 35.6% for AGIs $50k-75k , 79.6% for AGIs $75k-100k , 226.3% for AGIs $100k-200k , 2882.5% for AGIs over 200k ) Taxes paid: $6,564 (reported on 5.7% of returns )(% of AGI for various income ranges: 3.1% for AGIs below $25k , 19.6% for AGIs $25k-50k , 56.4% for AGIs $50k-75k , 82.3% for AGIs $75k-100k , 144.4% for AGIs $100k-200k , 938.7% for AGIs over 200k ) Earned income credit: $2,359 (reported on 16.2% of returns )(% of AGI for various income ranges: 98.7% for AGIs below $25k , 67.9% for AGIs $25k-50k ) Percentage of individuals using paid preparers for their 2020 taxes: 91.3%(% for various income ranges: 89.1% for AGIs below $25k , 92.5% for AGIs $25k-50k , 92.1% for AGIs $50k-75k , 92.9% for AGIs $75k-100k , 92.7% for AGIs $100k-200k , 92.6% for AGIs over 200k )
Averages for the 2012 tax year for zip code 33565, filed in 2013:
Average Adjusted Gross Income (AGI) in 2012: $46,175 (Individual Income Tax Returns) Here:
$46,175State:
$60,316
Salary/wage: $42,064 (reported on 80.4% of returns )Here:
$42,064State:
$45,277
(% of AGI for various income ranges: 71.7% for AGIs below $25k , 76.8% for AGIs $25k-50k , 75.8% for AGIs $50k-75k , 77.9% for AGIs $75k-100k , 76.6% for AGIs $100k-200k , 47.4% for AGIs over 200k ) Taxable interest for individuals: $1,386 (reported on 28.3% of returns )This zip code:
$1,386Florida:
$3,587
(% of AGI for various income ranges: 1.2% for AGIs below $25k , 0.8% for AGIs $25k-50k , 0.6% for AGIs $50k-75k , 0.8% for AGIs $75k-100k , 0.4% for AGIs $100k-200k , 2.2% for AGIs over 200k ) Ordinary dividends: $4,236 (reported on 15.5% of returns )(% of AGI for various income ranges: 2.3% for AGIs below $25k , 1.4% for AGIs $25k-50k , 1.2% for AGIs $50k-75k , 1.3% for AGIs $75k-100k , 1.1% for AGIs $100k-200k , 2.0% for AGIs over 200k ) Net capital gain/loss in AGI: +$4,072 (reported on 10.0% of returns )Here:
+$4,072State:
+$33,493
(% of AGI for various income ranges: 0.5% for AGIs $25k-50k , 0.6% for AGIs $50k-75k , 0.5% for AGIs $75k-100k , 0.8% for AGIs $100k-200k , 4.4% for AGIs over 200k ) Profit/loss from business: +$7,818 (reported on 14.8% of returns )Here:
+$7,818State:
+$10,012
(% of AGI for various income ranges: 9.4% for AGIs below $25k , 2.9% for AGIs $25k-50k , 1.4% for AGIs $50k-75k , 0.7% for AGIs $75k-100k , 1.8% for AGIs $100k-200k ) Taxable individual retirement arrangement distribution: $12,386 (reported on 10.1% of returns )33565:
$12,386Florida:
$21,544
(% of AGI for various income ranges: 3.2% for AGIs below $25k , 2.6% for AGIs $25k-50k , 2.9% for AGIs $50k-75k , 2.9% for AGIs $75k-100k , 3.4% for AGIs $100k-200k ) Total itemized deductions: $19,459 (22% of AGI, reported on 21.8% of returns )Here:
$19,459State:
$25,533
Here:
21.9% of AGIState:
18.0% of AGI
(% of AGI for various income ranges: 6.3% for AGIs below $25k , 8.4% for AGIs $25k-50k , 8.5% for AGIs $50k-75k , 9.9% for AGIs $75k-100k , 11.3% for AGIs $100k-200k , 8.9% for AGIs over 200k ) Charity contributions: $4,725 (reported on 16.6% of returns )(% of AGI for various income ranges: 0.6% for AGIs below $25k , 1.3% for AGIs $25k-50k , 1.2% for AGIs $50k-75k , 1.6% for AGIs $75k-100k , 2.4% for AGIs $100k-200k , 3.1% for AGIs over 200k ) Taxes paid: $3,959 (reported on 21.3% of returns )(% of AGI for various income ranges: 0.9% for AGIs below $25k , 1.4% for AGIs $25k-50k , 1.7% for AGIs $50k-75k , 2.1% for AGIs $75k-100k , 2.4% for AGIs $100k-200k , 2.0% for AGIs over 200k ) Earned income credit: $2,436 (reported on 20.1% of returns )(% of AGI for various income ranges: 7.0% for AGIs below $25k , 1.1% for AGIs $25k-50k ) Percentage of individuals using paid preparers for their 2012 taxes: 52.1%(% for various income ranges: 50.3% for AGIs below $25k , 49.4% for AGIs $25k-50k , 53.8% for AGIs $50k-75k , 53.3% for AGIs $75k-100k , 60.6% for AGIs $100k-200k , 77.8% for AGIs over 200k )
Averages for the 2004 tax year for zip code 33565, filed in 2005:
Average Adjusted Gross Income (AGI) in 2004: $41,476 (Individual Income Tax Returns) Here:
$41,476State:
$50,523
Salary/wage: $38,379 (reported on 82.7% of returns )Here:
$38,379State:
$39,563
(% of AGI for various income ranges: 140.9% for AGIs below $10k , 73.2% for AGIs $10k-25k , 81.3% for AGIs $25k-50k , 81.4% for AGIs $50k-75k , 81.0% for AGIs $75k-100k , 64.0% for AGIs over 100k ) Taxable interest for individuals: $1,485 (reported on 43.6% of returns )This zip code:
$1,485Florida:
$3,211
(% of AGI for various income ranges: 11.8% for AGIs below $10k , 2.8% for AGIs $10k-25k , 1.3% for AGIs $25k-50k , 1.5% for AGIs $50k-75k , 1.0% for AGIs $75k-100k , 1.2% for AGIs over 100k ) Taxable dividends: $1,945 (reported on 18.5% of returns )(% of AGI for various income ranges: 4.5% for AGIs below $10k , 1.1% for AGIs $10k-25k , 0.8% for AGIs $25k-50k , 0.7% for AGIs $50k-75k , 0.8% for AGIs $75k-100k , 0.9% for AGIs over 100k ) Net capital gain/loss: +$9,902 (reported on 14.0% of returns )Here:
+$9,902State:
+$27,205
(% of AGI for various income ranges: -2.5% for AGIs below $10k , 0.3% for AGIs $10k-25k , 0.9% for AGIs $25k-50k , 1.3% for AGIs $50k-75k , 1.9% for AGIs $75k-100k , 9.5% for AGIs over 100k ) Profit/loss from business: +$7,602 (reported on 13.7% of returns )Here:
+$7,602State:
+$10,634
(% of AGI for various income ranges: 8.2% for AGIs below $10k , 5.0% for AGIs $10k-25k , 2.5% for AGIs $25k-50k , 2.1% for AGIs $50k-75k , 1.6% for AGIs $75k-100k , 2.1% for AGIs over 100k ) IRA payment deduction: $3,069 (reported on 2.0% of returns )33565:
$3,069Florida:
$3,082
(% of AGI for various income ranges: 0.2% for AGIs $10k-25k , 0.2% for AGIs $25k-50k , 0.1% for AGIs $50k-75k , 0.1% for AGIs $75k-100k , 0.2% for AGIs over 100k ) Self-employed pension: $17,000 (reported on 0.2% of returns )Here:
$17,000Florida:
$15,857
Total itemized deductions: $16,704 (23% of AGI, reported on 27.4% of returns )Here:
$16,704State:
$20,370
Here:
22.9% of AGIState:
20.7% of AGI
(% of AGI for various income ranges: 18.1% for AGIs below $10k , 7.7% for AGIs $10k-25k , 10.1% for AGIs $25k-50k , 12.2% for AGIs $50k-75k , 13.4% for AGIs $75k-100k , 10.4% for AGIs over 100k ) Charity contributions deductions: $3,712 (5% of AGI, reported on 22.4% of returns )Here:
4.8% of AGIState:
3.8% of AGI
(% of AGI for various income ranges: 0.7% for AGIs below $10k , 1.0% for AGIs $10k-25k , 1.3% for AGIs $25k-50k , 1.9% for AGIs $50k-75k , 2.5% for AGIs $75k-100k , 2.9% for AGIs over 100k ) Total tax: $5,858 (reported on 73.9% of returns )(% of AGI for various income ranges: 4.8% for AGIs below $10k , 3.8% for AGIs $10k-25k , 6.3% for AGIs $25k-50k , 8.5% for AGIs $50k-75k , 10.5% for AGIs $75k-100k , 18.4% for AGIs over 100k ) Earned income credit: $1,742 (reported on 16.3% of returns )Percentage of individuals using paid preparers for their 2004 taxes: 57.0%(% for various income ranges: 52.2% for AGIs below $10k , 58.1% for AGIs $10k-25k , 54.3% for AGIs $25k-50k , 59.2% for AGIs $50k-75k , 57.2% for AGIs $75k-100k , 71.0% for AGIs over 100k )
Estimated median household income in 2022: This zip code:
$67,561Florida:
$69,303
Nearest zip codes: 33563 ,
33566 ,
33810 ,
33527 ,
33592 ,
33542 .
Plant City Zip Code Map
Percentage of family households: This zip code:
44.3%Florida:
41.2%
Percentage of households with unmarried partners: This zip code:
5.6%Florida:
46.7%
Likely homosexual households (counted as self-reported same-sex unmarried-partner households)
Lesbian couples: 0.0% of all households Gay men: 0.1% of all households
Household received Food Stamps/SNAP in the past 12 months: 678Household did not receive Food Stamps/SNAP in the past 12 months: 5,967
Women who had a birth in the past 12 months: 162 (75 now married , 82 unmarried) Women who did not have a birth in the past 12 months: 3,336 (1,743 now married , 1,595 unmarried)
Housing units in zip code 33565 with a mortgage: 2,685 (263
second mortgage , 207
both second mortgage and home equity loan )
Houses without a mortgage: 55
Median monthly owner costs for units with a mortgage: $1,732
Median monthly owner costs for units without a mortgage: $458
Residents with income below the poverty level in 2022:
This zip code:
16.2%Whole state:
12.7%
Residents with income below 50% of the poverty level in 2022:
This zip code:
9.3%Whole state:
6.6%
Median number of rooms in houses and condos: Median number of rooms in apartments: Notable locations in this zip code not listed on our city pages
Click to draw/clear zip code borders Notable locations in zip code 33565: (A) , McGee Farm (B) , Moffitt Plantation (C) , Kilgore Railroad Station (D) , Cone Railroad Station (E) , Central Railroad Station (F) , Cork Knights Volunteer Fire Department (G) , Hillsborough County Fire Rescue Station 30 Midway Combo (H) . Display/hide their locations on the map
Churches in zip code 33565 include: (A) , Sharon Church (B) , Mount Zion Church (C) , Church of Christ Palm Harbor (D) , Presbyterian Church of Palm Harbor (E) . Display/hide their locations on the map
Lakes and swamps: (A) , Wiggins Prairie (B) . Display/hide their locations on the map
Streams, rivers, and creeks: (A) , Itchepackesassa Creek (B) . Display/hide their locations on the map
Year house built (houses)
12 2020 or later581 2010 to 20191,661 2000 to 2009891 1990 to 19992,121 1980 to 1989681 1970 to 1979474 1960 to 1969286 1950 to 195999 1940 to 1949138 1939 or earlier
Zip code 33565 household income distribution in 2022 247 Less than $10,000147 $10,000 to $14,999289 $15,000 to $19,999238 $20,000 to $24,999264 $25,000 to $29,999366 $30,000 to $34,999269 $35,000 to $39,999394 $40,000 to $44,999166 $45,000 to $49,999633 $50,000 to $59,999508 $60,000 to $74,999692 $75,000 to $99,999703 $100,000 to $124,999595 $125,000 to $149,999632 $150,000 to $199,999480 $200,000 or moreEstimate of home value of owner-occupied houses/condos in 2022 in zip code 33565 258 Less than $10,00058 $10,000 to $14,99976 $15,000 to $19,999205 $20,000 to $24,999120 $25,000 to $29,99997 $30,000 to $34,99979 $35,000 to $39,99989 $40,000 to $49,99969 $50,000 to $59,999115 $60,000 to $69,9997 $70,000 to $79,999148 $80,000 to $89,99946 $90,000 to $99,999308 $100,000 to $124,99996 $125,000 to $149,999137 $150,000 to $174,999212 $175,000 to $199,999415 $200,000 to $249,999428 $250,000 to $299,999629 $300,000 to $399,999785 $400,000 to $499,999715 $500,000 to $749,999184 $750,000 to $999,99935 $1,500,000 to $1,999,99967 $2,000,000 or moreRent paid by renters in 2022 in zip code 33565 21 $200 to $24922 $300 to $34961 $500 to $54954 $550 to $59930 $600 to $64963 $700 to $74977 $800 to $89946 $900 to $999236 $1,000 to $1,24945 $1,250 to $1,49933 $1,500 to $1,99951 $2,500 to $2,999150 No cash rent
Median gross rent in 2022: $1,135.
Median price asked for vacant for-sale houses and condos in 2022: $188,525.
Estimated median house (or condo) value in 2022 for: White Non-Hispanic householders: $359,816Black or African American householders: $447,330American Indian or Alaska Native householders: $395,603Asian householders: $506,866Some other race householders: $262,217Two or more races householders: $191,620Hispanic or Latino householders: $249,529Estimated median house or condo value in 2022: $259,940
33565:
$259,940Florida:
$354,100
Lower value quartile - upper value quartile: $105,830 - $455,502
Mean price in 2022: Detached houses: $389,287Here:
$389,287State:
$500,941
Townhouses or other attached units: $292,242Here:
$292,242State:
$370,869
Mobile homes: $111,999Here:
$111,999State:
$113,202
Housing units in structures:
One, detached: 3,758One, attached: 4850 or more: 10Mobile homes: 3,188Boats, RVs, vans, etc.: 28Unemployment : 2.6%
Means of transportation to work in zip code 33565 68.8% 5,537 Drove a car alone8.9% 717 Carpooled0.3% 23 Bus or trolley bus3.5% 279 Walked2.6% 211 Other means16.0% 1,284 Worked at homeTravel time to work (commute) in zip code 33565 75 Less than 5 minutes424 5 to 9 minutes375 10 to 14 minutes982 15 to 19 minutes1,311 20 to 24 minutes405 25 to 29 minutes1,170 30 to 34 minutes469 35 to 39 minutes242 40 to 44 minutes711 45 to 59 minutes398 60 to 89 minutes186 90 or more minutes
Neighborhoods in zip code 33565: Percentage of zip code residents living and working in this county: 84.3%
Household type by relationship:
Households: 18,268
Male householders: 3,025 (847 living alone ), Female householders: 3,616 (794 living alone )3,607 spouses (3,557 opposite-sex spouses ), 617 unmarried partners , (608 opposite-sex unmarried partners ), 5,000 children (4,681 natural , 71 adopted , 244 stepchildren ), 481 grandchildren , 159 brothers or sisters , 268 parents , 0 foster children , 254 other relatives , 972 non-relatives In group quarters: 219 (-1 institutionalized population )
Size of family households: 2,079 2-persons , 999 3-persons , 494 4-persons , 372 5-persons , 372 6-persons , 231 7-or-more-persons
Size of nonfamily households: 1,638 1-person , 293 2-persons , 112 3-persons , 12 4-persons , 39 5-persons , 11 6-persons , 43 7-or-more-persons
2,620 married couples with children. single-parent households (727 men , 400 women ).
80.6% of residents of 33565 zip code speak English at home. of residents speak Spanish at home (53% very well, 19% well, 17% not well, 11% not at all ).of residents speak other Indo-European language at home (92% very well, 8% well ).of residents speak Asian or Pacific Island language at home (85% very well, 15% well ).
Foreign born population: 1,802 (9.9%)
(25.9%
of them are naturalized citizens )
This zip code:
9.9%Whole state:
21.7%
69% Honduras 4% Sweden 2% England 2% Barbados 2% Haiti 2% Guatemala 2% Chile 18% American 12% English 6% Irish 6% German 2% Scottish 2% Italian 1% Dutch
Year of entry for the foreign-born population
417 2010 or later 512 2000 to 2009 555 1990 to 1999 554 Before 1990
Facilities with environmental interests located in this zip code:
KNIGHTS ELEMENTARY SCHOOL (4815 NORTH KEENE ROAD in PLANT CITY, FL)
(Geographic Names Information System) (National Center for Education Statistics) - STATE ID-2291 Organizations: HILLSBOROUGH COUNTY SCHOOL DISTRICT (SCHOOL DISTRICT)
PRO SOURCE ONE (AGRO DISTRIBUTION, LLC) (4094 PAUL BUCHMAN HIGHWAY in PLANT CITY, FL)
AIR MINOR (AIRS/AFS) HAZARDOUS WASTE BIENNIAL REPORTER (Resource Conservation and Recovery Act (tracking hazardous waste)) Large Quantity Generators, more that 1000 kg of hazardous waste/month (Resource Conservation and Recovery Act (tracking hazardous waste)) Business SIC classification: PESTICIDES AND AGRICULTURAL CHEMICALS
CORK ELEMENTARY SCHOOL (3501 NORTH CORK ROAD in PLANT CITY, FL)
(Geographic Names Information System) (National Center for Education Statistics) - STATE ID-1001 Organizations: HILLSBOROUGH COUNTY SCHOOL DISTRICT (SCHOOL DISTRICT)
AMERISTEEL CORP (4006 PAUL BUCHMAN HWY in PLANT CITY, FL)
National Pollutant Discharge Elimination System NON-MAJOR (Tracking pollutant discharge elimination systems) - permit Business SIC classification: MISCELLANEOUS STRUCTURAL METALWORKOrganizations: LUIS NIEVES (CONTACT/OWNER)
AMOCO STATION #6278 (2851 THONOTOSASSA ROAD in PLANT CITY, FL)
National Pollutant Discharge Elimination System NON-MAJOR (Tracking pollutant discharge elimination systems) - permit Small Quantity Generators, between 100 kg and 1000 kg of hazardous waste/month (Resource Conservation and Recovery Act (tracking hazardous waste)) - notification Organizations: MAJIK MKT MGMNT, DEALER (CONTACT/OWNER)
Alternative names: AMOCO OIL CO., AMOCO SERVICE STATION # 6278
MCINTOSH PARK ENHANCED STROMWA (775 E KNIGHTS GRIFFIN RD in PLANT CITY, FL)
National Pollutant Discharge Elimination System NON-MAJOR (Tracking pollutant discharge elimination systems) - permit Organizations: J ANDREWS ANDREWS (CONTACT/OWNER)
Alternative names: HERITAGE ISLE PUD - PHASE 4
CIRCLE K #7187 (7202 W KNIGHTS GRIFFIN RD in PLANT CITY, FL)
(Resource Conservation and Recovery Act (tracking hazardous waste)) Organizations: STEVE BELIN (CONTACT/OWNER)
CIRCLE K STORE #7187 (7202 W KNIGHTS GRIFFIN RD in PLANT CITY, FL)
National Pollutant Discharge Elimination System NON-MAJOR (Tracking pollutant discharge elimination systems) - permit Business SIC classification: GASOLINE SERVICE STATIONSOrganizations: STEVE BELIN (CONTACT/OWNER)
CS INTEGRATED - TAMPA (302 N FRONTAGE RD in PLANT CITY, FL)
Small Quantity Generators, between 100 kg and 1000 kg of hazardous waste/month (Resource Conservation and Recovery Act (tracking hazardous waste)) - notification Organizations: KEN HENRY (CONTACT/OWNER)
Alternative names: TAMPA LAKELAND REFRIGERATED SERV
DELETE THIS HANDLER (5530 94TH AVE in PINELLAS, FL)
Small Quantity Generators, between 100 kg and 1000 kg of hazardous waste/month (Resource Conservation and Recovery Act (tracking hazardous waste)) - notification Business NAICS classification: ALL OTHER MISCELLANEOUS FABRICATED METAL PRODUCT MANUFACTURING.Organizations: MICHAEL CIRCLE, OWNER (CONTACT/OWNER)
LAWSON HARDWARE (3217 N CORK RD in PLANT CITY, FL)
COMPLIANCE ACTIVITY (Tracking inspections of insecticide, fungicide, and rodenticide, and toxic substances)
Housing units lacking complete plumbing facilities: 2.6%
Housing units lacking complete kitchen facilities: 3.3%
95.5% Electricity 3.1% Bottled, tank, or LP gas 0.5% Utility gas
Population in 1990: 13,299. Population change in the 1990s: +3,515 (+26.4%).
Place of birth for U.S.-born residents:
This state: 9,627Northeast: 2,026Midwest: 1,985South: 1,748West: 644
62% of the 33565 zip code residents lived in the same house 5 years ago.
Out of people who lived in different houses, 65% lived in this county.
Out of people who lived in different counties, 50% lived in Florida.
91% of the 33565 zip code residents lived in the same house 1 year ago.
Out of people who lived in different houses, 34% moved from this county.
Out of people who lived in different houses, 26% moved from different county within same state.
Out of people who lived in different houses, 24% moved from different state.
Out of people who lived in different houses, 24% moved from abroad.
Private vs. public school enrollment:
Students in private schools in grades 1 to 8 (elementary and middle school): 282
Students in private schools in grades 9 to 12 (high school): 71
Students in private undergraduate colleges: 113
Occupation by median earnings in the past 12 months ($)
134,997 Architecture and engineering occupations 102,356 Law enforcement workers including supervisors 102,118 Computer and mathematical occupations 84,824 Management occupations 75,321 Health diagnosing and treating practitioners and other technical occupations 61,764 Sales and related occupations
Companies with federal contracts located in this zip code:
MOOREFIELD, PHYLLIS (316 MAGNOLIA HILL DR in PLANT CITY, FL) in 2 contracts in 2005
$6,600 with U.S. Army Corps of Engineers - civil program financing only for Other Housekeeping Services. Taking place in TX. Signed on 2005-03-04. Completion date: 2005-09-30.
with Army for Other Housekeeping Services. Taking place in TX. Signed on 2005-03-04. Completion date: 2005-09-30.
Top industries in this zip code by the number of employees in 2005:
Construction: Industrial Building Construction (250-499 employees: 1 establishment)Accommodation and Food Services: Full-Service Restaurants (50-99: 1, 10-19: 1, 1-4: 2)Construction: Drywall and Insulation Contractors (50-99: 1, 1-4: 1)Administrative and Support and Waste Management and Remediation Services: Professional Employer Organizations (50-99: 1)Health Care and Social Assistance: Child Day Care Services (20-49: 1, 10-19: 1, 5-9: 2)Other Services (except Public Administration): Religious Organizations (10-19: 2, 5-9: 2, 1-4: 4)Administrative and Support and Waste Management and Remediation Services: Landscaping Services (20-49: 1, 5-9: 1, 1-4: 5)Construction: Plumbing, Heating, and Air-Conditioning Contractors (20-49: 1, 5-9: 1, 1-4: 4)
People in group quarters in 2010:
318 people in workers' group living quarters and job corps centers
31 people in group homes for juveniles (non-correctional)
27 people in group homes intended for adults
11 people in nursing facilities/skilled-nursing facilities
People in group quarters in 2000:
62 people in agriculture workers' dormitories on farms
35 people in homes for the mentally retarded
26 people in other workers' dormitories
21 people in other noninstitutional group quarters
13 people in other nonhousehold living situations
Fatal accident statistics in 2014:
Fatal accident count: 2Vehicles involved in fatal accidents: 3Fatal accidents caused by drunken drivers: 0Fatalities: 3Persons involved in fatal accidents: 3Pedestrians involved in fatal accidents: 2
Fatal accident statistics in 2013:
Fatal accident count: 3Vehicles involved in fatal accidents: 5Fatal accidents caused by drunken drivers: 2Fatalities: 3Persons involved in fatal accidents: 8Pedestrians involved in fatal accidents: 0
Home Mortgage Disclosure Act Aggregated Statistics For Year 2009(Based on 5 full and 6 partial tracts) A) FHA, FSA/RHS & VA B) Conventional C) Refinancings D) Home Improvement Loans F) Non-occupant Loans on G) Loans On Manufactured Number Average Value Number Average Value Number Average Value Number Average Value Number Average Value Number Average Value
LOANS ORIGINATED 71 $155,580 60 $157,530 271 $166,092 10 $149,423 22 $134,591 82 $109,876 APPLICATIONS APPROVED, NOT ACCEPTED 2 $108,435 14 $88,948 42 $153,500 5 $24,844 4 $53,142 9 $82,698 APPLICATIONS DENIED 27 $156,273 41 $138,974 235 $175,824 29 $27,883 9 $108,447 78 $84,394 APPLICATIONS WITHDRAWN 13 $151,686 13 $230,921 84 $208,248 0 $0 2 $98,455 17 $114,381 FILES CLOSED FOR INCOMPLETENESS 5 $158,294 7 $150,297 19 $189,296 0 $0 1 $160,960 3 $74,023
Aggregated Statistics For Year 2008(Based on 5 full and 6 partial tracts) A) FHA, FSA/RHS & VA B) Conventional C) Refinancings D) Home Improvement Loans F) Non-occupant Loans on G) Loans On Manufactured Number Average Value Number Average Value Number Average Value Number Average Value Number Average Value Number Average Value
LOANS ORIGINATED 62 $162,716 121 $187,429 308 $168,732 46 $106,817 32 $134,622 125 $112,166 APPLICATIONS APPROVED, NOT ACCEPTED 10 $169,403 46 $115,916 64 $137,459 5 $34,074 4 $92,968 50 $100,175 APPLICATIONS DENIED 21 $125,446 77 $132,240 314 $191,433 65 $86,654 24 $153,997 124 $80,599 APPLICATIONS WITHDRAWN 5 $125,006 18 $184,062 87 $182,516 9 $97,520 5 $162,394 19 $113,146 FILES CLOSED FOR INCOMPLETENESS 1 $86,320 11 $220,083 39 $202,224 2 $23,325 0 $0 9 $169,113
Aggregated Statistics For Year 2007(Based on 5 full and 6 partial tracts) A) FHA, FSA/RHS & VA B) Conventional C) Refinancings D) Home Improvement Loans F) Non-occupant Loans on G) Loans On Manufactured Number Average Value Number Average Value Number Average Value Number Average Value Number Average Value Number Average Value
LOANS ORIGINATED 30 $148,213 278 $183,026 564 $178,703 93 $94,734 46 $195,252 172 $109,318 APPLICATIONS APPROVED, NOT ACCEPTED 0 $0 72 $130,657 130 $174,534 26 $34,040 8 $122,829 62 $87,986 APPLICATIONS DENIED 22 $161,294 136 $180,254 548 $188,742 96 $89,150 51 $164,954 177 $114,541 APPLICATIONS WITHDRAWN 4 $85,955 31 $249,458 242 $182,358 29 $81,123 6 $250,807 53 $113,910 FILES CLOSED FOR INCOMPLETENESS 1 $202,830 11 $228,950 51 $217,075 2 $161,135 6 $160,727 5 $159,818
Aggregated Statistics For Year 2006(Based on 5 full and 6 partial tracts) A) FHA, FSA/RHS & VA B) Conventional C) Refinancings D) Home Improvement Loans F) Non-occupant Loans on G) Loans On Manufactured Number Average Value Number Average Value Number Average Value Number Average Value Number Average Value Number Average Value
LOANS ORIGINATED 59 $144,077 464 $187,823 626 $176,450 136 $78,906 91 $192,646 263 $107,249 APPLICATIONS APPROVED, NOT ACCEPTED 13 $145,718 98 $141,194 157 $164,866 38 $65,300 12 $121,990 85 $82,212 APPLICATIONS DENIED 10 $130,657 156 $176,416 475 $184,269 118 $93,413 29 $215,659 203 $93,241 APPLICATIONS WITHDRAWN 11 $129,345 69 $173,521 268 $182,488 25 $140,160 6 $141,087 48 $109,965 FILES CLOSED FOR INCOMPLETENESS 2 $117,480 35 $130,777 84 $176,327 3 $74,817 5 $105,734 7 $110,451
Aggregated Statistics For Year 2005(Based on 5 full and 6 partial tracts) A) FHA, FSA/RHS & VA B) Conventional C) Refinancings D) Home Improvement Loans F) Non-occupant Loans on G) Loans On Manufactured Number Average Value Number Average Value Number Average Value Number Average Value Number Average Value Number Average Value
LOANS ORIGINATED 77 $124,606 557 $162,257 673 $153,732 84 $74,675 68 $136,593 232 $98,448 APPLICATIONS APPROVED, NOT ACCEPTED 8 $140,748 95 $133,421 135 $129,096 20 $50,862 11 $145,735 58 $80,142 APPLICATIONS DENIED 13 $138,371 208 $118,315 542 $122,652 115 $69,933 18 $123,706 269 $90,542 APPLICATIONS WITHDRAWN 5 $138,316 90 $153,232 287 $139,797 43 $116,132 28 $101,577 86 $99,103 FILES CLOSED FOR INCOMPLETENESS 1 $129,550 25 $124,924 158 $143,228 5 $18,436 0 $0 39 $116,860
Aggregated Statistics For Year 2004(Based on 5 full and 6 partial tracts) A) FHA, FSA/RHS & VA B) Conventional C) Refinancings D) Home Improvement Loans F) Non-occupant Loans on G) Loans On Manufactured Number Average Value Number Average Value Number Average Value Number Average Value Number Average Value Number Average Value
LOANS ORIGINATED 74 $116,268 397 $142,462 606 $130,231 86 $52,172 65 $101,685 186 $84,010 APPLICATIONS APPROVED, NOT ACCEPTED 6 $100,283 59 $124,983 144 $118,541 14 $27,931 10 $131,267 55 $67,657 APPLICATIONS DENIED 20 $92,688 150 $111,462 512 $112,199 113 $43,501 30 $93,285 211 $82,458 APPLICATIONS WITHDRAWN 12 $96,101 38 $138,179 231 $130,614 16 $52,958 3 $165,510 48 $91,885 FILES CLOSED FOR INCOMPLETENESS 4 $104,772 8 $131,366 144 $115,840 9 $56,936 0 $0 49 $100,624
Aggregated Statistics For Year 2003(Based on 5 full and 6 partial tracts) A) FHA, FSA/RHS & VA B) Conventional C) Refinancings D) Home Improvement Loans F) Non-occupant Loans on Number Average Value Number Average Value Number Average Value Number Average Value Number Average Value
LOANS ORIGINATED 105 $114,635 370 $120,415 1,078 $115,952 52 $25,060 34 $96,127 APPLICATIONS APPROVED, NOT ACCEPTED 4 $88,355 74 $108,711 247 $103,091 18 $35,644 7 $78,966 APPLICATIONS DENIED 30 $110,083 123 $114,417 573 $110,434 53 $25,377 11 $84,529 APPLICATIONS WITHDRAWN 9 $116,316 42 $134,085 228 $120,840 2 $25,540 9 $87,718 FILES CLOSED FOR INCOMPLETENESS 8 $109,792 11 $100,562 44 $110,208 8 $54,436 4 $57,278
Aggregated Statistics For Year 2002(Based on 4 partial tracts) A) FHA, FSA/RHS & VA B) Conventional C) Refinancings D) Home Improvement Loans F) Non-occupant Loans on Number Average Value Number Average Value Number Average Value Number Average Value Number Average Value
LOANS ORIGINATED 38 $108,849 95 $108,526 175 $103,279 20 $38,610 17 $86,276 APPLICATIONS APPROVED, NOT ACCEPTED 4 $88,912 21 $70,796 61 $88,421 2 $13,620 2 $88,105 APPLICATIONS DENIED 9 $95,737 23 $89,326 115 $100,230 20 $15,855 4 $121,995 APPLICATIONS WITHDRAWN 0 $0 8 $169,595 51 $103,784 5 $52,316 2 $74,950 FILES CLOSED FOR INCOMPLETENESS 2 $69,805 9 $87,589 19 $83,601 0 $0 0 $0
Aggregated Statistics For Year 2001(Based on 4 partial tracts) A) FHA, FSA/RHS & VA B) Conventional C) Refinancings D) Home Improvement Loans F) Non-occupant Loans on Number Average Value Number Average Value Number Average Value Number Average Value Number Average Value
LOANS ORIGINATED 48 $101,213 115 $109,075 166 $96,806 18 $22,361 10 $87,318 APPLICATIONS APPROVED, NOT ACCEPTED 2 $70,660 26 $69,849 38 $65,775 11 $19,821 4 $36,452 APPLICATIONS DENIED 6 $89,567 61 $75,500 114 $75,031 21 $33,759 9 $29,306 APPLICATIONS WITHDRAWN 1 $55,830 19 $122,712 59 $85,267 2 $29,795 3 $128,830 FILES CLOSED FOR INCOMPLETENESS 0 $0 5 $96,982 14 $89,021 0 $0 0 $0
Aggregated Statistics For Year 2000(Based on 4 partial tracts) A) FHA, FSA/RHS & VA B) Conventional C) Refinancings D) Home Improvement Loans F) Non-occupant Loans on Number Average Value Number Average Value Number Average Value Number Average Value Number Average Value
LOANS ORIGINATED 21 $93,362 106 $82,155 50 $79,488 37 $22,581 8 $70,958 APPLICATIONS APPROVED, NOT ACCEPTED 3 $64,700 21 $59,930 24 $66,811 18 $17,921 7 $49,659 APPLICATIONS DENIED 1 $89,460 61 $71,254 84 $75,121 20 $22,376 11 $38,853 APPLICATIONS WITHDRAWN 4 $125,028 7 $156,859 41 $62,930 4 $19,660 0 $0 FILES CLOSED FOR INCOMPLETENESS 0 $0 4 $57,022 9 $109,200 0 $0 0 $0
Aggregated Statistics For Year 1999(Based on 1 full and 3 partial tracts) A) FHA, FSA/RHS & VA B) Conventional C) Refinancings D) Home Improvement Loans E) Loans on Dwellings For 5+ Families F) Non-occupant Loans on Number Average Value Number Average Value Number Average Value Number Average Value Number Average Value Number Average Value
LOANS ORIGINATED 36 $79,355 213 $84,829 209 $76,063 32 $23,324 1 $22,220 25 $50,029 APPLICATIONS APPROVED, NOT ACCEPTED 2 $100,420 55 $76,360 69 $72,657 12 $40,250 0 $0 5 $58,296 APPLICATIONS DENIED 3 $107,097 182 $59,832 170 $68,533 37 $19,497 0 $0 14 $44,363 APPLICATIONS WITHDRAWN 4 $94,648 29 $106,927 61 $68,980 12 $49,570 0 $0 5 $60,580 FILES CLOSED FOR INCOMPLETENESS 1 $461,070 12 $75,176 31 $64,286 2 $23,195 0 $0 2 $48,070
Private Mortgage Insurance Companies Aggregated Statistics For Year 2009(Based on 4 full and 6 partial tracts) A) Conventional B) Refinancings C) Non-occupant Loans on D) Loans On Manufactured Number Average Value Number Average Value Number Average Value Number Average Value
LOANS ORIGINATED 7 $230,250 6 $219,067 0 $0 0 $0 APPLICATIONS APPROVED, NOT ACCEPTED 10 $269,434 0 $0 4 $243,535 1 $130,860 APPLICATIONS DENIED 3 $211,197 2 $181,945 0 $0 2 $136,210 APPLICATIONS WITHDRAWN 5 $257,014 0 $0 0 $0 2 $130,250 FILES CLOSED FOR INCOMPLETENESS 0 $0 0 $0 0 $0 0 $0
Aggregated Statistics For Year 2008(Based on 5 full and 6 partial tracts) A) Conventional B) Refinancings C) Non-occupant Loans on D) Loans On Manufactured Number Average Value Number Average Value Number Average Value Number Average Value
LOANS ORIGINATED 27 $224,946 18 $256,126 5 $208,316 1 $236,860 APPLICATIONS APPROVED, NOT ACCEPTED 21 $226,498 23 $278,220 5 $264,518 0 $0 APPLICATIONS DENIED 8 $186,785 6 $157,495 4 $103,468 4 $103,468 APPLICATIONS WITHDRAWN 2 $395,420 4 $240,550 0 $0 0 $0 FILES CLOSED FOR INCOMPLETENESS 4 $313,842 2 $218,785 6 $282,157 0 $0
Aggregated Statistics For Year 2007(Based on 5 full and 6 partial tracts) A) Conventional B) Refinancings C) Non-occupant Loans on D) Loans On Manufactured Number Average Value Number Average Value Number Average Value Number Average Value
LOANS ORIGINATED 67 $248,420 26 $307,497 7 $243,256 9 $151,163 APPLICATIONS APPROVED, NOT ACCEPTED 23 $254,131 11 $286,425 1 $501,190 0 $0 APPLICATIONS DENIED 2 $284,860 0 $0 0 $0 0 $0 APPLICATIONS WITHDRAWN 9 $363,122 8 $332,249 2 $356,820 0 $0 FILES CLOSED FOR INCOMPLETENESS 1 $361,170 1 $346,780 0 $0 0 $0
Aggregated Statistics For Year 2006(Based on 5 full and 6 partial tracts) A) Conventional B) Refinancings C) Non-occupant Loans on D) Loans On Manufactured Number Average Value Number Average Value Number Average Value Number Average Value
LOANS ORIGINATED 70 $239,022 20 $231,111 15 $231,057 10 $132,577 APPLICATIONS APPROVED, NOT ACCEPTED 30 $275,502 7 $268,624 3 $188,147 0 $0 APPLICATIONS DENIED 3 $209,987 0 $0 0 $0 3 $209,987 APPLICATIONS WITHDRAWN 5 $267,028 2 $519,995 0 $0 0 $0 FILES CLOSED FOR INCOMPLETENESS 0 $0 1 $113,000 0 $0 0 $0
Aggregated Statistics For Year 2005(Based on 5 full and 6 partial tracts) A) Conventional B) Refinancings C) Non-occupant Loans on D) Loans On Manufactured Number Average Value Number Average Value Number Average Value Number Average Value
LOANS ORIGINATED 95 $195,872 35 $189,125 9 $180,447 10 $118,400 APPLICATIONS APPROVED, NOT ACCEPTED 27 $187,809 5 $225,662 2 $113,055 5 $107,264 APPLICATIONS DENIED 0 $0 1 $166,010 0 $0 0 $0 APPLICATIONS WITHDRAWN 10 $251,797 1 $274,810 2 $130,250 0 $0 FILES CLOSED FOR INCOMPLETENESS 2 $109,900 0 $0 0 $0 2 $93,645
Aggregated Statistics For Year 2004(Based on 5 full and 6 partial tracts) A) Conventional B) Refinancings C) Non-occupant Loans on D) Loans On Manufactured Number Average Value Number Average Value Number Average Value Number Average Value
LOANS ORIGINATED 87 $148,695 20 $170,620 7 $103,071 10 $86,346 APPLICATIONS APPROVED, NOT ACCEPTED 26 $179,650 17 $205,968 5 $150,396 2 $87,685 APPLICATIONS DENIED 2 $44,975 0 $0 2 $44,975 0 $0 APPLICATIONS WITHDRAWN 7 $120,491 3 $189,160 0 $0 0 $0 FILES CLOSED FOR INCOMPLETENESS 0 $0 0 $0 0 $0 0 $0
Aggregated Statistics For Year 2003(Based on 5 full and 6 partial tracts) A) Conventional B) Refinancings C) Non-occupant Loans on Number Average Value Number Average Value Number Average Value
LOANS ORIGINATED 97 $125,774 92 $129,921 9 $111,470 APPLICATIONS APPROVED, NOT ACCEPTED 23 $226,405 26 $152,695 2 $46,985 APPLICATIONS DENIED 1 $150,490 2 $122,585 0 $0 APPLICATIONS WITHDRAWN 6 $144,243 5 $163,756 1 $112,540 FILES CLOSED FOR INCOMPLETENESS 0 $0 0 $0 0 $0
Aggregated Statistics For Year 2002(Based on 4 partial tracts) A) Conventional B) Refinancings C) Non-occupant Loans on Number Average Value Number Average Value Number Average Value
LOANS ORIGINATED 36 $119,812 23 $116,566 4 $74,405 APPLICATIONS APPROVED, NOT ACCEPTED 5 $162,492 11 $120,529 0 $0 APPLICATIONS DENIED 0 $0 0 $0 0 $0 APPLICATIONS WITHDRAWN 0 $0 0 $0 0 $0 FILES CLOSED FOR INCOMPLETENESS 0 $0 0 $0 0 $0
Aggregated Statistics For Year 2001(Based on 4 partial tracts) A) Conventional B) Refinancings C) Non-occupant Loans on Number Average Value Number Average Value Number Average Value
LOANS ORIGINATED 32 $120,539 19 $99,687 4 $127,890 APPLICATIONS APPROVED, NOT ACCEPTED 9 $111,158 4 $89,415 2 $101,065 APPLICATIONS DENIED 2 $45,120 2 $113,570 0 $0 APPLICATIONS WITHDRAWN 2 $78,860 0 $0 0 $0 FILES CLOSED FOR INCOMPLETENESS 2 $74,065 0 $0 0 $0
Aggregated Statistics For Year 2000(Based on 4 partial tracts) A) Conventional B) Refinancings C) Non-occupant Loans on Number Average Value Number Average Value Number Average Value
LOANS ORIGINATED 35 $101,528 3 $142,243 3 $44,323 APPLICATIONS APPROVED, NOT ACCEPTED 2 $178,195 2 $84,280 0 $0 APPLICATIONS DENIED 2 $131,100 0 $0 0 $0 APPLICATIONS WITHDRAWN 2 $274,970 0 $0 0 $0 FILES CLOSED FOR INCOMPLETENESS 0 $0 0 $0 0 $0
Aggregated Statistics For Year 1999(Based on 1 full and 3 partial tracts) A) Conventional B) Refinancings C) Non-occupant Loans on Number Average Value Number Average Value Number Average Value
LOANS ORIGINATED 34 $108,864 19 $104,248 1 $65,020 APPLICATIONS APPROVED, NOT ACCEPTED 3 $106,107 2 $90,540 0 $0 APPLICATIONS DENIED 2 $64,570 3 $73,440 1 $26,490 APPLICATIONS WITHDRAWN 3 $78,610 0 $0 0 $0 FILES CLOSED FOR INCOMPLETENESS 0 $0 1 $121,690 0 $0
2002 - 2018 National Fire Incident Reporting System (NFIRS) incidents See full 2006 National Fire Incident Reporting System statistics for zip code 33565, Florida
Most common first names in zip code 33565 among deceased individuals Name Count Lived (average)
John 325 74.4 years William 322 73.6 years Mary 223 77.0 years Charles 204 73.9 years James 201 71.8 years Robert 175 70.9 years George 169 75.0 years Joseph 153 75.8 years Edward 110 75.2 years Helen 108 76.6 years
Most common last names in zip code 33565 among deceased individuals Last name Count Lived (average)
Smith 82 74.6 years Johnson 63 74.4 years Miller 47 76.2 years Jones 45 73.9 years Brown 41 72.7 years Anderson 37 76.5 years Williams 36 75.5 years Davis 34 72.1 years Moore 31 78.1 years Taylor 30 74.7 years
Businesses in zip code 33565
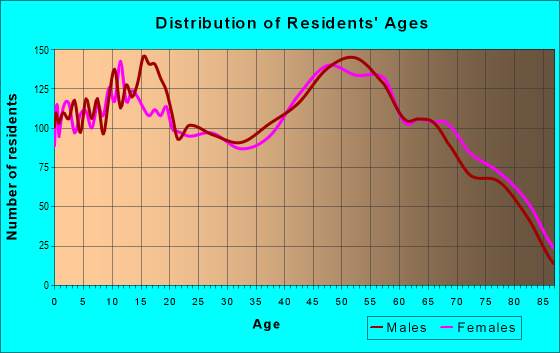
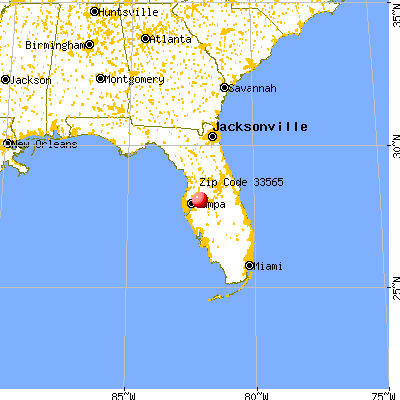


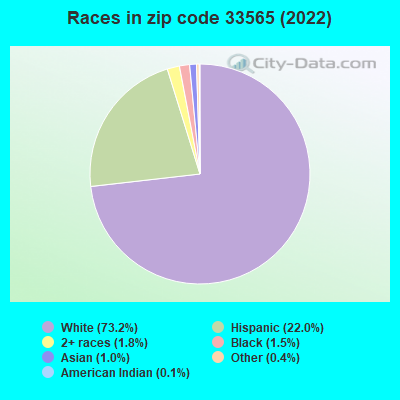


 Nearest zip codes: 33563, 33566, 33810, 33527, 33592, 33542.
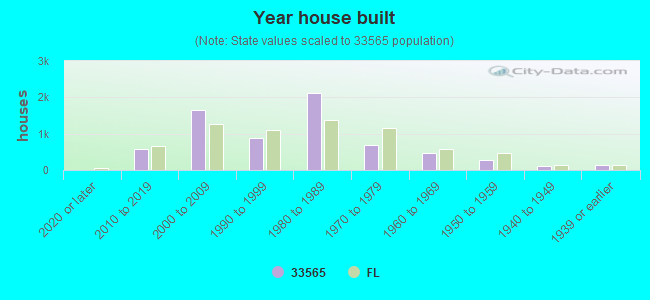

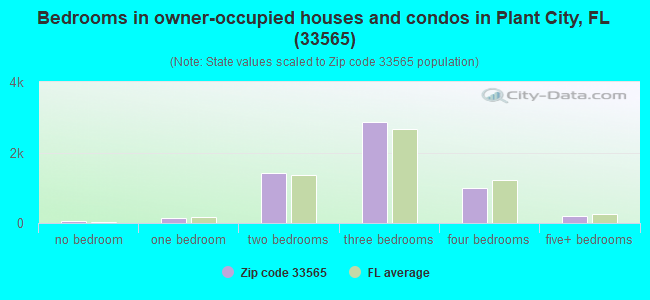
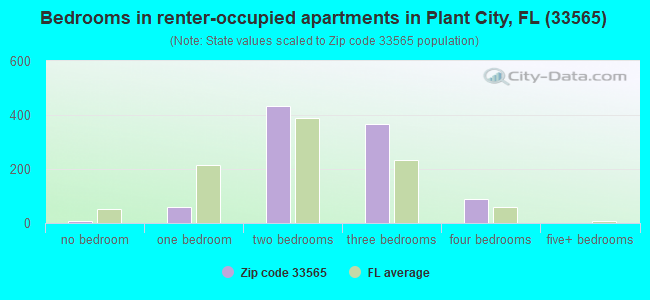
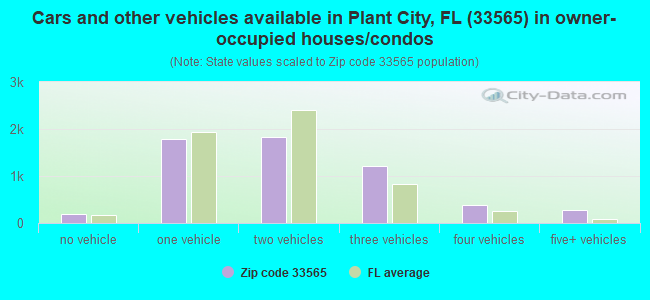
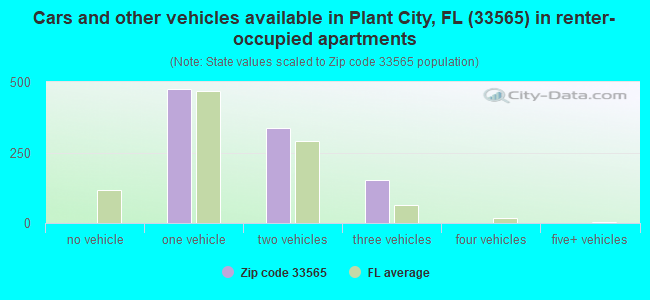


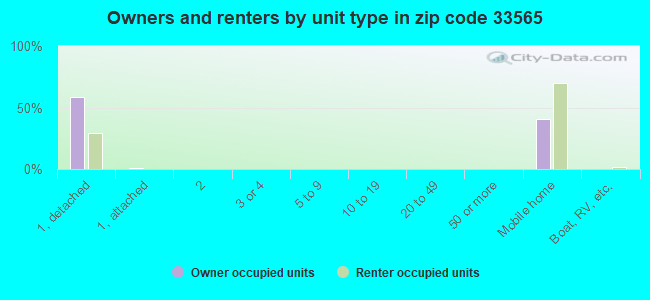
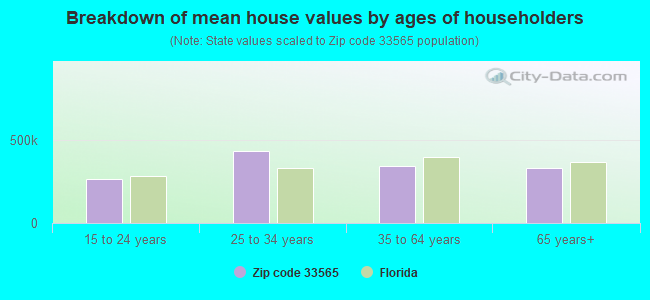


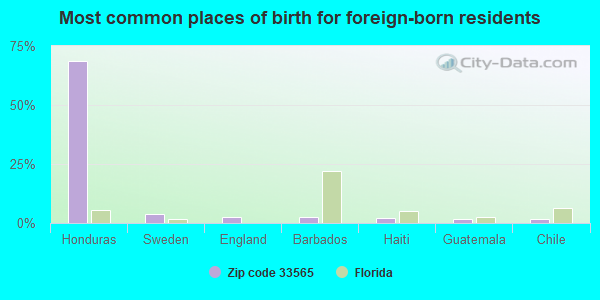
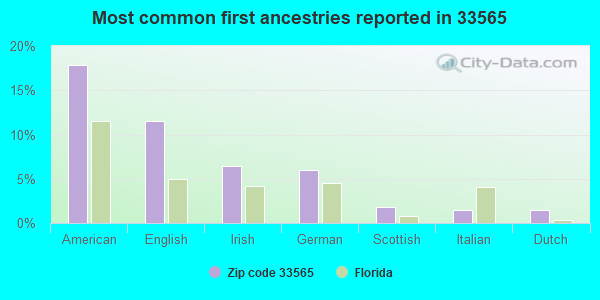
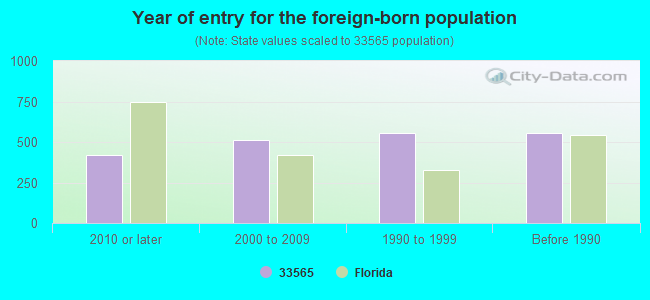


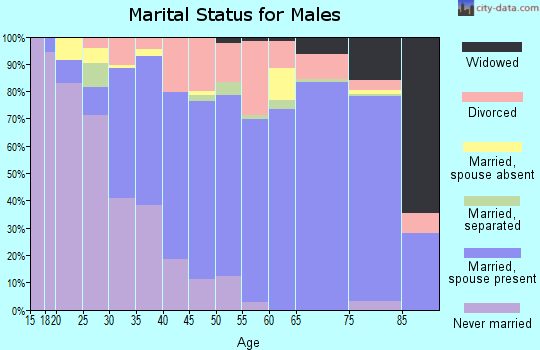
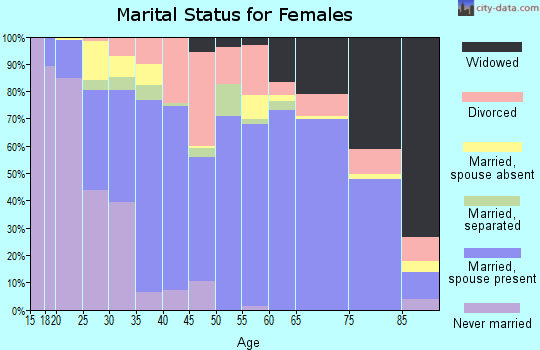
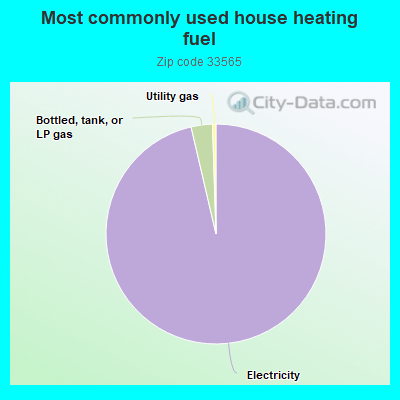
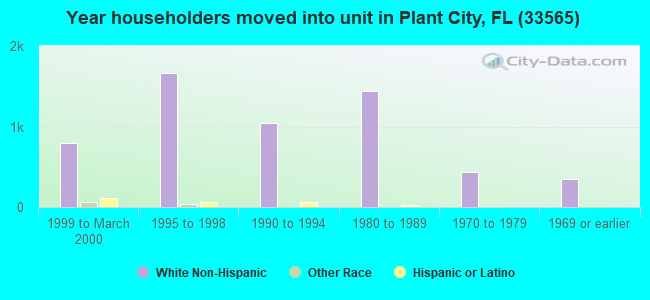
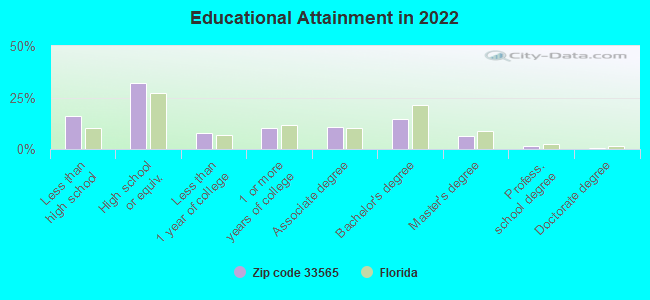
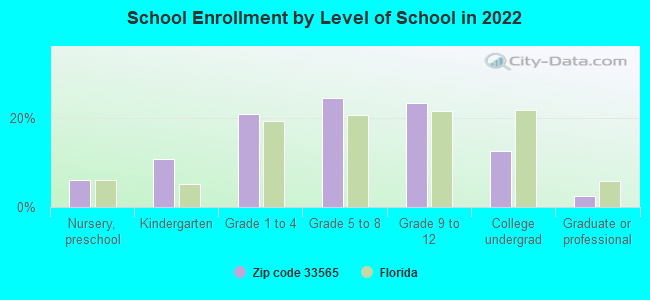
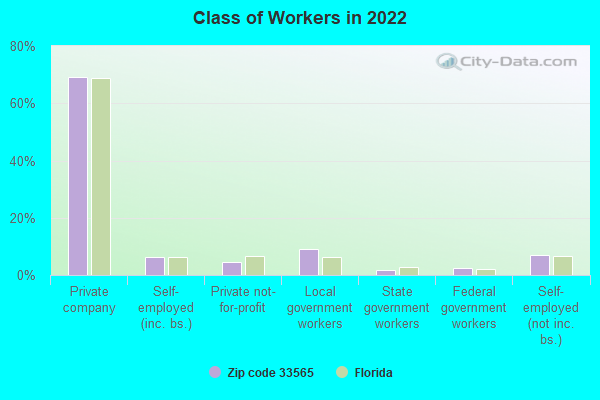
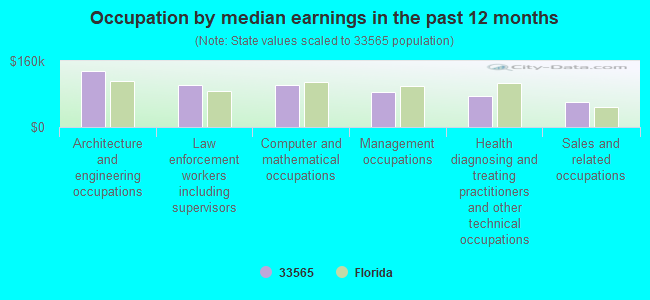
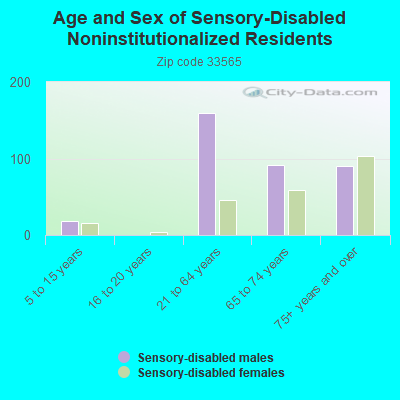
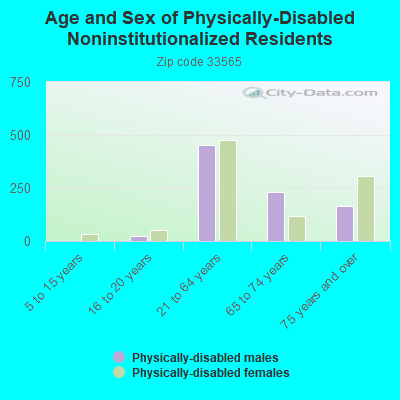
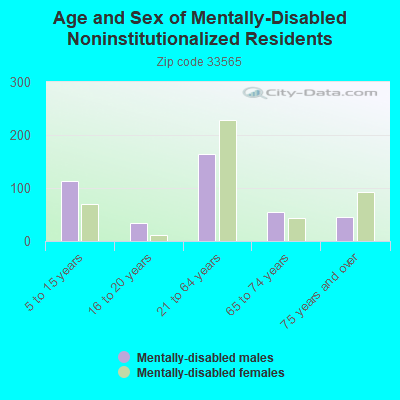
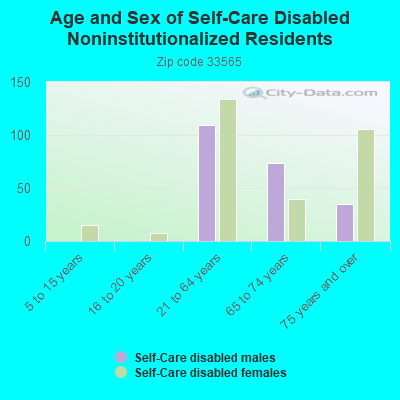
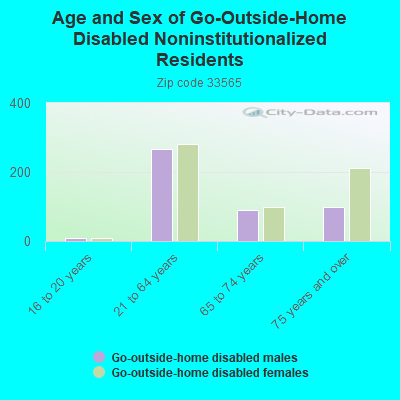
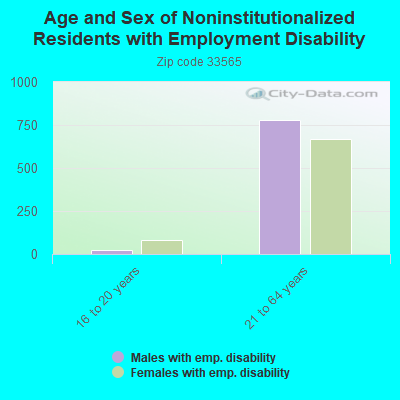
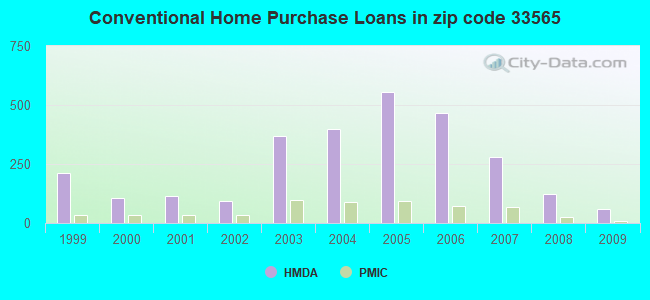
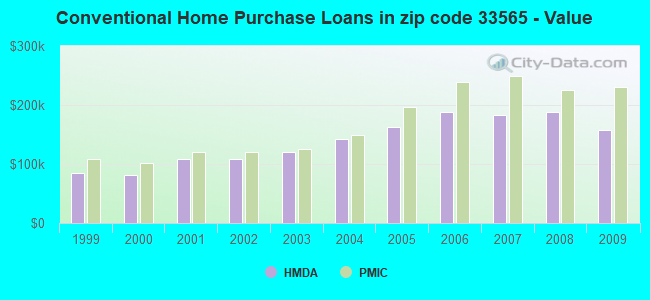
 Based on the data from the years 2002 - 2018 the average number of fire incidents per year is 42. The highest number of fires - 116 took place in 2012, and the least - 2 in 2004. The data has a growing trend.
 When looking into fire subcategories, the most incidents belonged to: Outside Fires (49.4%), and Structure Fires (29.3%).