Estimated zip code population in 2022: 39,939 Zip code population in 2010: 38,251 Zip code population in 2000: 25,020
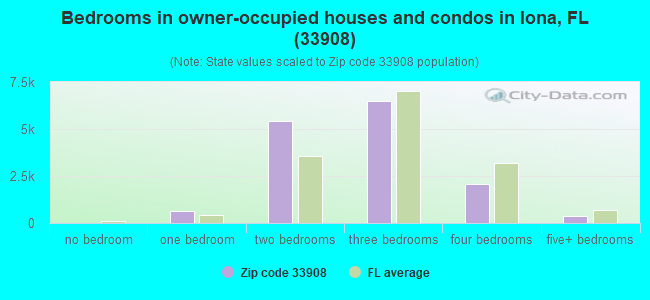
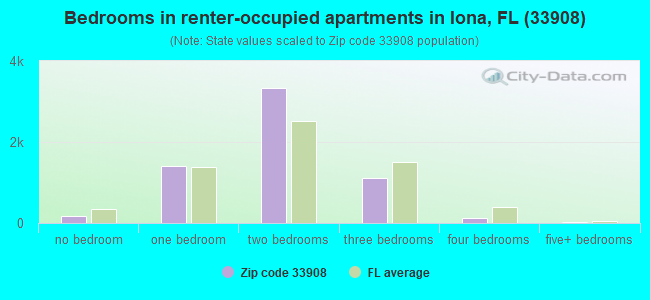
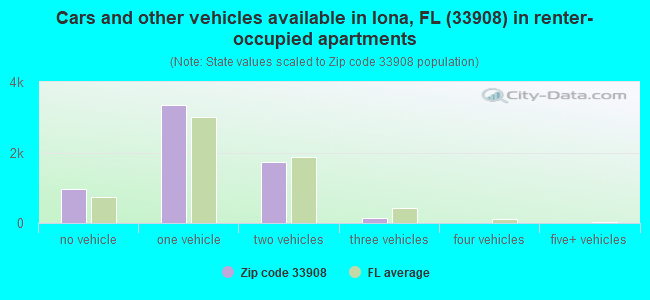
Houses and condos: 32,806 Renter-occupied apartments: 6,181
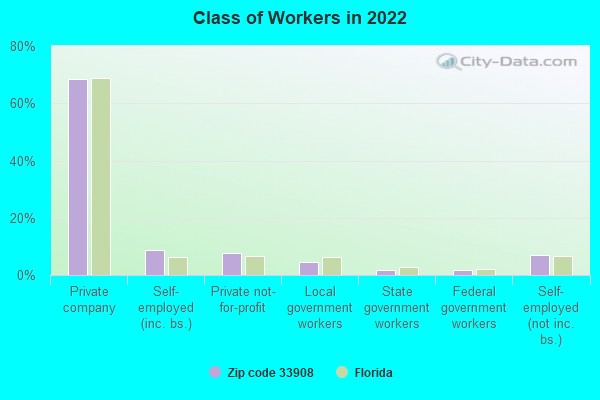
% of renters here:
29%
State:
33%
March 2022 cost of living index in zip code 33908: 93.5 (less than average, U.S. average is 100)
Land area: 32.3 sq. mi. Water area: 12.5 sq. mi.
Population density: 1,236 people per square mile
(low).
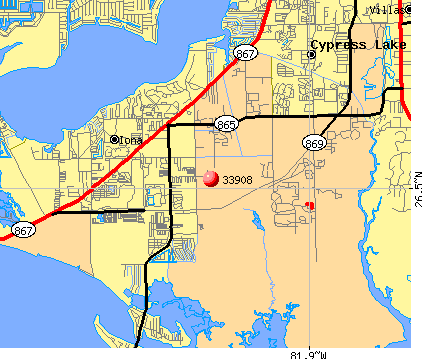
OSM Map
General Map
Google Map
MSN Map
OSM Map
General Map
Google Map
MSN Map
OSM Map
General Map
Google Map
MSN Map
OSM Map
General Map
Google Map
MSN Map
Please wait while loading the map...
Real estate property taxes paid for housing units in 2022:
This zip code:
0.8% ($2,779)
Florida:
0.7% ($2,529)
Median real estate property taxes paid for housing units with mortgages in 2022: $3,462 (0.7%) Median real estate property taxes paid for housing units with no mortgage in 2022: $2,410 (0.8%)
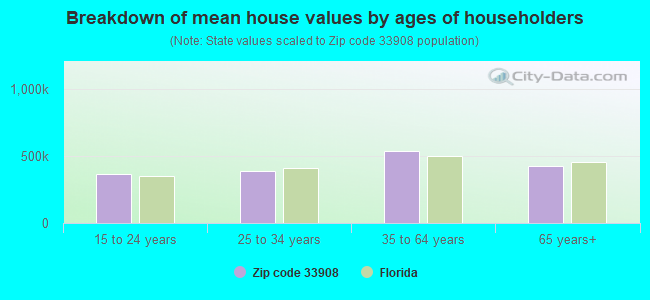
Estimated median house/condo value in 2022: $363,795
33908:
$363,795
Florida:
$354,100
According to our research of Florida and other state lists, there were 52 registered sex offenders living in 33908 zip code as of April 27, 2024. The ratio of all residents to sex offenders in zip code 33908 is 697 to 1. The ratio of registered sex offenders to all residents in this zip code is near the state average.
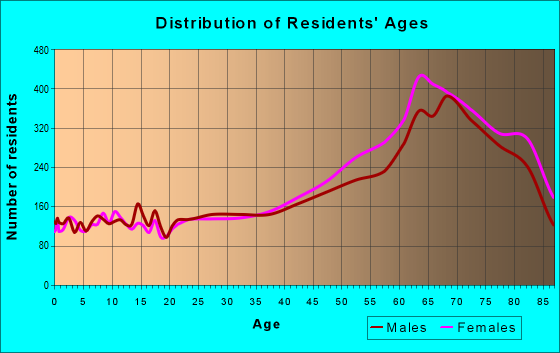
Median resident age:
This zip code:
64.4 years
Florida median age:
42.7 years
Average household size:
This zip code:
1.8 people
Florida:
2.5 people
Averages for the 2020 tax year for zip code 33908, filed in 2021:
Average Adjusted Gross Income (AGI) in 2020: $126,175 (Individual Income Tax Returns)
Here:
$126,175
State:
$82,200
Salary/wage: $78,807 (reported on 61.0% of returns)
Here:
$78,807
State:
$58,347
(% of AGI for various income ranges: 1080.5% for AGIs below $25k, 3258.9% for AGIs $25k-50k, 5189.9% for AGIs $50k-75k, 6702.8% for AGIs $75k-100k, 11870.9% for AGIs $100k-200k, 88441.5% for AGIs over 200k)
Taxable interest for individuals: $4,841 (reported on 47.9% of returns)
This zip code:
$4,841
Florida:
$4,272
(% of AGI for various income ranges: 46.7% for AGIs below $25k, 65.8% for AGIs $25k-50k, 156.2% for AGIs $50k-75k, 294.1% for AGIs $75k-100k, 601.3% for AGIs $100k-200k, 5010.3% for AGIs over 200k)
Ordinary dividends: $19,881 (reported on 41.2% of returns)
Here:
$19,881
State:
$15,863
(% of AGI for various income ranges: 108.3% for AGIs below $25k, 163.5% for AGIs $25k-50k, 501.5% for AGIs $50k-75k, 896.3% for AGIs $75k-100k, 2107.6% for AGIs $100k-200k, 18806.4% for AGIs over 200k)
Net capital gain/loss in AGI: +$48,971 (reported on 39.4% of returns)
Here:
+$48,971
State:
+$62,983
(% of AGI for various income ranges: 16.4% for AGIs below $25k, 94.9% for AGIs $25k-50k, 384.3% for AGIs $50k-75k, 701.4% for AGIs $75k-100k, 2167.2% for AGIs $100k-200k, 60434.3% for AGIs over 200k)
Profit/loss from business: +$24,606 (reported on 15.7% of returns)
Here:
+$24,606
State:
+$9,719
(% of AGI for various income ranges: 149.0% for AGIs below $25k, 207.7% for AGIs $25k-50k, 231.0% for AGIs $50k-75k, 446.3% for AGIs $75k-100k, 845.4% for AGIs $100k-200k, 8002.5% for AGIs over 200k)
Taxable individual retirement arrangement distribution: $33,082 (reported on 23.6% of returns)
33908:
$33,082
Florida:
$24,823
(% of AGI for various income ranges: 154.1% for AGIs below $25k, 245.1% for AGIs $25k-50k, 739.7% for AGIs $50k-75k, 1453.8% for AGIs $75k-100k, 3212.9% for AGIs $100k-200k, 11744.3% for AGIs over 200k)
Self-employed (Keogh) retirement plans: $30,094 (reported on 0.8% of returns)
33908:
$30,094
Florida:
$29,694
(% of AGI for various income ranges: 7.6% for AGIs $25k-50k, 49.9% for AGIs $100k-200k, 703.6% for AGIs over 200k)
Total itemized deductions: $51,685 (reported on 16.1% of returns)
Here:
$51,685
State:
$45,393
(% of AGI for various income ranges: 153.5% for AGIs below $25k, 301.2% for AGIs $25k-50k, 771.8% for AGIs $50k-75k, 1370.5% for AGIs $75k-100k, 2429.7% for AGIs $100k-200k, 15744.8% for AGIs over 200k)
Charity contributions: $18,306 (reported on 14.0% of returns)
Here:
$18,306
State:
$20,178
(% of AGI for various income ranges: 10.0% for AGIs below $25k, 27.0% for AGIs $25k-50k, 106.2% for AGIs $50k-75k, 222.1% for AGIs $75k-100k, 488.6% for AGIs $100k-200k, 6897.2% for AGIs over 200k)
Taxes paid: $6,209 (reported on 16.0% of returns)
33908:
$6,209
State:
$6,967
(% of AGI for various income ranges: 19.4% for AGIs below $25k, 32.7% for AGIs $25k-50k, 96.6% for AGIs $50k-75k, 194.3% for AGIs $75k-100k, 349.9% for AGIs $100k-200k, 1637.0% for AGIs over 200k)
Earned income credit: $1,879 (reported on 8.2% of returns)
Here:
$1,879
State:
$2,306
(% of AGI for various income ranges: 62.3% for AGIs below $25k, 36.2% for AGIs $25k-50k)
Percentage of individuals using paid preparers for their 2020 taxes: 91.7%
Here:
92%
State:
92%
(% for various income ranges: 90.0% for AGIs below $25k, 92.1% for AGIs $25k-50k, 92.1% for AGIs $50k-75k, 91.6% for AGIs $75k-100k, 92.2% for AGIs $100k-200k, 93.9% for AGIs over 200k)
Averages for the 2012 tax year for zip code 33908, filed in 2013:
Average Adjusted Gross Income (AGI) in 2012: $96,160 (Individual Income Tax Returns)
Here:
$96,160
State:
$60,316
Salary/wage: $61,359 (reported on 61.9% of returns)
Here:
$61,359
State:
$45,277
(% of AGI for various income ranges: 59.2% for AGIs below $25k, 58.6% for AGIs $25k-50k, 46.0% for AGIs $50k-75k, 37.9% for AGIs $75k-100k, 37.5% for AGIs $100k-200k, 34.7% for AGIs over 200k)
Taxable interest for individuals: $5,213 (reported on 50.9% of returns)
This zip code:
$5,213
Florida:
$3,587
(% of AGI for various income ranges: 3.4% for AGIs below $25k, 2.2% for AGIs $25k-50k, 2.3% for AGIs $50k-75k, 2.3% for AGIs $75k-100k, 2.7% for AGIs $100k-200k, 3.0% for AGIs over 200k)
Ordinary dividends: $16,096 (reported on 40.8% of returns)
Here:
$16,096
State:
$12,831
(% of AGI for various income ranges: 6.3% for AGIs below $25k, 4.2% for AGIs $25k-50k, 5.7% for AGIs $50k-75k, 6.0% for AGIs $75k-100k, 7.2% for AGIs $100k-200k, 7.5% for AGIs over 200k)
Net capital gain/loss in AGI: +$30,511 (reported on 37.3% of returns)
Here:
+$30,511
State:
+$33,493
(% of AGI for various income ranges: 0.4% for AGIs $25k-50k, 0.9% for AGIs $50k-75k, 2.3% for AGIs $75k-100k, 4.2% for AGIs $100k-200k, 21.8% for AGIs over 200k)
Profit/loss from business: +$18,706 (reported on 14.9% of returns)
Here:
+$18,706
State:
+$10,012
(% of AGI for various income ranges: 7.5% for AGIs below $25k, 3.3% for AGIs $25k-50k, 2.5% for AGIs $50k-75k, 2.4% for AGIs $75k-100k, 3.3% for AGIs $100k-200k, 2.4% for AGIs over 200k)
Taxable individual retirement arrangement distribution: $29,079 (reported on 27.3% of returns)
33908:
$29,079
Florida:
$21,544
(% of AGI for various income ranges: 7.4% for AGIs below $25k, 6.4% for AGIs $25k-50k, 7.7% for AGIs $50k-75k, 11.1% for AGIs $75k-100k, 12.0% for AGIs $100k-200k, 6.7% for AGIs over 200k)
Self-employment retirement plans: $24,527 (reported on 0.8% of returns)
33908:
$24,527
Florida:
$20,611
(% of AGI for various income ranges: 0.2% for AGIs $25k-50k, 0.2% for AGIs $100k-200k, 0.3% for AGIs over 200k)
Total itemized deductions: $30,480 (18% of AGI, reported on 41.1% of returns)
Here:
$30,480
State:
$25,533
Here:
17.6% of AGI
State:
18.0% of AGI
(% of AGI for various income ranges: 20.0% for AGIs below $25k, 15.7% for AGIs $25k-50k, 15.9% for AGIs $50k-75k, 16.6% for AGIs $75k-100k, 16.4% for AGIs $100k-200k, 9.4% for AGIs over 200k)
Charity contributions: $5,935 (reported on 35.7% of returns)
Here:
$5,935
State:
$5,698
(% of AGI for various income ranges: 1.4% for AGIs below $25k, 1.4% for AGIs $25k-50k, 2.0% for AGIs $50k-75k, 2.4% for AGIs $75k-100k, 2.7% for AGIs $100k-200k, 2.2% for AGIs over 200k)
Taxes paid: $7,953 (reported on 40.3% of returns)
33908:
$7,953
State:
$6,203
(% of AGI for various income ranges: 3.2% for AGIs below $25k, 2.8% for AGIs $25k-50k, 3.1% for AGIs $50k-75k, 3.6% for AGIs $75k-100k, 4.0% for AGIs $100k-200k, 3.1% for AGIs over 200k)
Earned income credit: $1,837 (reported on 9.2% of returns)
Here:
$1,837
State:
$2,372
(% of AGI for various income ranges: 3.3% for AGIs below $25k, 0.4% for AGIs $25k-50k)
Percentage of individuals using paid preparers for their 2012 taxes: 58.5%
Here:
59%
State:
54%
(% for various income ranges: 48.9% for AGIs below $25k, 52.1% for AGIs $25k-50k, 59.6% for AGIs $50k-75k, 63.1% for AGIs $75k-100k, 70.5% for AGIs $100k-200k, 85.4% for AGIs over 200k)
Averages for the 2004 tax year for zip code 33908, filed in 2005:
Average Adjusted Gross Income (AGI) in 2004: $85,520 (Individual Income Tax Returns)
Here:
$85,520
State:
$50,523
Salary/wage: $54,437 (reported on 63.5% of returns)
Here:
$54,437
State:
$39,563
(% of AGI for various income ranges: 181.2% for AGIs below $10k, 57.2% for AGIs $10k-25k, 55.3% for AGIs $25k-50k, 46.1% for AGIs $50k-75k, 42.2% for AGIs $75k-100k, 35.4% for AGIs over 100k)
Taxable interest for individuals: $5,350 (reported on 62.3% of returns)
This zip code:
$5,350
Florida:
$3,211
(% of AGI for various income ranges: 31.4% for AGIs below $10k, 5.9% for AGIs $10k-25k, 4.5% for AGIs $25k-50k, 4.5% for AGIs $50k-75k, 4.3% for AGIs $75k-100k, 3.4% for AGIs over 100k)
Taxable dividends: $9,371 (reported on 45.8% of returns)
Here:
$9,371
State:
$6,129
(% of AGI for various income ranges: 24.6% for AGIs below $10k, 5.5% for AGIs $10k-25k, 4.6% for AGIs $25k-50k, 4.9% for AGIs $50k-75k, 6.3% for AGIs $75k-100k, 4.8% for AGIs over 100k)
Net capital gain/loss: +$35,603 (reported on 42.6% of returns)
Here:
+$35,603
State:
+$27,205
(% of AGI for various income ranges: -3.4% for AGIs below $10k, -0.2% for AGIs $10k-25k, 1.5% for AGIs $25k-50k, 2.8% for AGIs $50k-75k, 5.8% for AGIs $75k-100k, 25.0% for AGIs over 100k)
Profit/loss from business: +$25,516 (reported on 15.3% of returns)
Here:
+$25,516
State:
+$10,634
(% of AGI for various income ranges: 8.9% for AGIs below $10k, 5.5% for AGIs $10k-25k, 3.6% for AGIs $25k-50k, 3.3% for AGIs $50k-75k, 4.0% for AGIs $75k-100k, 4.9% for AGIs over 100k)
IRA payment deduction: $3,770 (reported on 3.3% of returns)
33908:
$3,770
Florida:
$3,082
(% of AGI for various income ranges: 0.8% for AGIs below $10k, 0.3% for AGIs $10k-25k, 0.3% for AGIs $25k-50k, 0.2% for AGIs $50k-75k, 0.2% for AGIs $75k-100k, 0.1% for AGIs over 100k)
Self-employed pension: $17,489 (reported on 1.2% of returns)
Here:
$17,489
Florida:
$15,857
(% of AGI for various income ranges: 0.1% for AGIs $25k-50k, 0.2% for AGIs $50k-75k, 0.2% for AGIs $75k-100k, 0.3% for AGIs over 100k)
Total itemized deductions: $26,900 (18% of AGI, reported on 43.5% of returns)
Here:
$26,900
State:
$20,370
Here:
18.4% of AGI
State:
20.7% of AGI
(% of AGI for various income ranges: 75.9% for AGIs below $10k, 22.5% for AGIs $10k-25k, 18.5% for AGIs $25k-50k, 20.0% for AGIs $50k-75k, 20.0% for AGIs $75k-100k, 10.4% for AGIs over 100k)
Charity contributions deductions: $5,882 (4% of AGI, reported on 38.4% of returns)
Here:
$5,882
State:
$4,064
Here:
3.8% of AGI
State:
3.8% of AGI
(% of AGI for various income ranges: 3.8% for AGIs below $10k, 2.0% for AGIs $10k-25k, 2.0% for AGIs $25k-50k, 2.7% for AGIs $50k-75k, 3.2% for AGIs $75k-100k, 2.7% for AGIs over 100k)
Total tax: $18,413 (reported on 79.5% of returns)
33908:
$18,413
State:
$9,431
(% of AGI for various income ranges: 7.0% for AGIs below $10k, 4.1% for AGIs $10k-25k, 7.4% for AGIs $25k-50k, 9.5% for AGIs $50k-75k, 10.8% for AGIs $75k-100k, 21.3% for AGIs over 100k)
Earned income credit: $1,466 (reported on 7.4% of returns)
Here:
$1,466
State:
$1,808
Percentage of individuals using paid preparers for their 2004 taxes: 65.5%
Here:
66%
State:
60%
(% for various income ranges: 60.8% for AGIs below $10k, 62.4% for AGIs $10k-25k, 60.7% for AGIs $25k-50k, 65.1% for AGIs $50k-75k, 67.4% for AGIs $75k-100k, 79.6% for AGIs over 100k)
Likely homosexual households (counted as self-reported same-sex unmarried-partner households)
Lesbian couples: 0.1% of all households
Gay men: 0.1% of all households
Household received Food Stamps/SNAP in the past 12 months: 526 Household did not receive Food Stamps/SNAP in the past 12 months: 20,810
Women who had a birth in the past 12 months: 85 (81 now married, 7 unmarried) Women who did not have a birth in the past 12 months: 5,683 (2,317 now married, 3,366 unmarried)
Housing units in zip code 33908 with a mortgage: 5,887 (347 second mortgage, 339 both second mortgage and home equity loan) Houses without a mortgage: 146
Median monthly owner costs for units with a mortgage: $2,016 Median monthly owner costs for units without a mortgage: $709
Residents with income below the poverty level in 2022:
This zip code:
8.7%
Whole state:
12.7%
Residents with income below 50% of the poverty level in 2022:
This zip code:
4.9%
Whole state:
6.6%
Median number of rooms in houses and condos:
Here:
5.7
State:
5.9
Median number of rooms in apartments:
Here:
4.2
State:
4.2
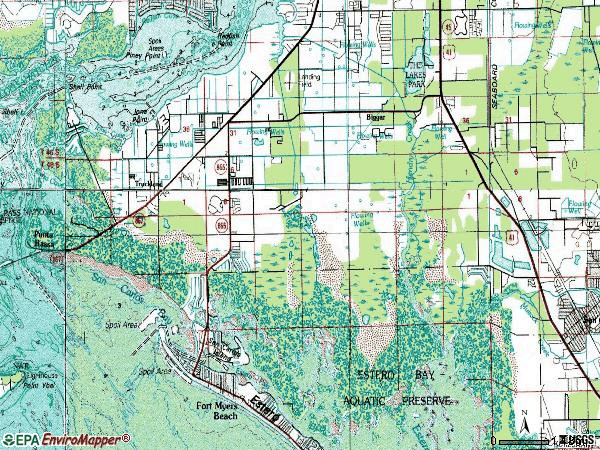
Notable locations in this zip code not listed on our city pages
Notable locations in zip code 33908: The Forest Country Club (A), Crown Colony Golf and Country Club (B), Evergreen Golf Club (C), Errol Country Club (D), Eagle Marsh Golf Club (E), South Plaza (F), Savings Square (G), College Center Plaza (H), Villas Plaza (I), Iona McGregor Fire District Station 3 (J), Iona McGregor Fire District Station 2 (K), San Carlos Park Fire Protection and Rescue Service District Station 52 (L), Lee County Emergency Medical Services (M), Lee County Sheriff's Office Charlie West District (N). Display/hide their locations on the map
Shopping Centers: The Bell Tower Shopping Center (1), Island Park Shopping Center (2), South Trail Shopping Center (3), Villas South Shopping Center (4). Display/hide their locations on the map
Churches in zip code 33908 include: Westminster Presbyterian Church (A), Temple Beth El (B), Saint Columbkille Catholic Church (C), Mount Pleasant Missionary Baptist Church (D), Faith United Methodist Church (E), Cross Way Baptist Church (F), Beth Shiloh Messianic Synagogue (G), McGregor Baptist Church (H). Display/hide their locations on the map
In group quarters: 1,043 (-1 institutionalized population)
Size of family households: 9,810 2-persons, 1,215 3-persons, 855 4-persons, 402 5-persons, 1 6-persons
Size of nonfamily households: 7,919 1-person, 938 2-persons, 14 3-persons
2,603 married couples with children.
776 single-parent households (104 men, 672 women).
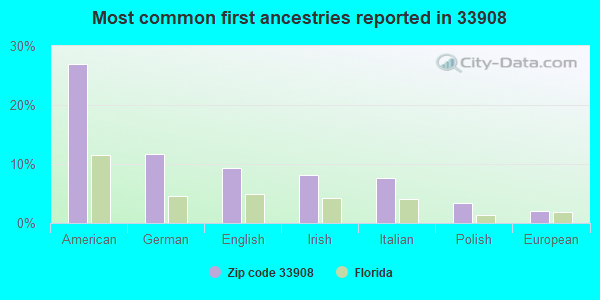
90.8% of residents of 33908 zip code speak English at home.
4.8% of residents speak Spanish at home (61% very well, 11% well, 21% not well, 7% not at all).
4.0% of residents speak other Indo-European language at home (63% very well, 26% well, 12% not well).
1.1% of residents speak Asian or Pacific Island language at home (79% very well, 21% well).
0.2% of residents speak other language at home (100% very well).
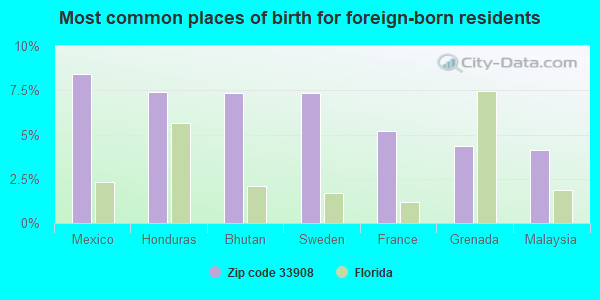
Foreign born population: 4,450 (11.1%) (62.0% of them are naturalized citizens)
Major facilities with environmental interests located in this zip code:
SHADY ACRES RV TRAILER PARK (19370 S TAMIAMI TRL in FORT MYERS, FL)
STATE MASTER (FDM) - CHAZ-FLR000104349, HAZARDOUS WASTE REGULATION PROGRAM (Resource Conservation and Recovery Act (tracking hazardous waste)) Business SIC classification: RECREATIONAL VEHICLE PARKS AND CAMPSITES Business NAICS classification: RV (RECREATIONAL VEHICLE) PARKS AND CAMPGROUNDS. Organizations: PERRINE ENTERPRISES (CONTACT/OWNER)
AMERADA HESS #09333 (15260 MCGREGOR BLVD in FORT MYERS, FL)
STATE MASTER (FDM) - WAFR-FLG910435, INDUSTRIAL WASTEWATER PROGRAM National Pollutant Discharge Elimination System NON-MAJOR (Tracking pollutant discharge elimination systems) - permit Business SIC classification: GASOLINE SERVICE STATIONS Organizations: HANDEX PRACTICAL ENVIRONMENTAL SOLUTIONS, AMERADA HESS CORP (CONTACT/APPLICANT)
ALCO AUTO REPAIR (16257 S TAMIAMI TR in FORT MYERS, FL)
STATE MASTER (FDM) - CHAZ-FLR000012013, HAZARDOUS WASTE REGULATION PROGRAM (Resource Conservation and Recovery Act (tracking hazardous waste)) Business SIC classification: GENERAL AUTOMOTIVE REPAIR SHOPS Business NAICS classification: GENERAL AUTOMOTIVE REPAIR. Organizations: LARRY DAVIS, OWNER (CONTACT/OWNER)
Alternative names: FORT MYERS DIAGNOSTIC
MCGREGOR AUTO & CUSTOM EXHAUST INC (15580 MCGREGOR BLVD in FORT MYERS, FL)
STATE MASTER (FDM) - CHAZ-FLR000036228, HAZARDOUS WASTE REGULATION PROGRAM Small Quantity Generators, between 100 kg and 1000 kg of hazardous waste/month (Resource Conservation and Recovery Act (tracking hazardous waste)) Business SIC classification: GENERAL AUTOMOTIVE REPAIR SHOPS Business NAICS classification: GENERAL AUTOMOTIVE REPAIR. Organizations: HENRY ROSCOE (CONTACT/OWNER)
Alternative names: ROSCOE AUTOMOTIVE INC
MAGIC DRY CLEANERS (8750 GLADIOLUS DRIVE UNIT #13 in FORT MYERS, FL)
AIR MINOR (AIRS/AFS) (Resource Conservation and Recovery Act (tracking hazardous waste)) Business SIC classification: DRYCLEANING PLANTS, EXCEPT RUG CLEANING; LAUNDRY AND GARMENT SERVICES Organizations: JERRY WOLSKI (CONTACT/OWNER)
Alternative names: MAGIC DRY CLEANERS & SHIRT LAUNDRY, MAGIC DRY CLEANERS INC
ISLAND EXPRESS (16401 TAMIAMI TR in FORT MYERS, FL)
STATE MASTER (FDM) - CHAZ-FLD984224683, HAZARDOUS WASTE REGULATION PROGRAM Small Quantity Generators, between 100 kg and 1000 kg of hazardous waste/month (Resource Conservation and Recovery Act (tracking hazardous waste)) - notification Business SIC classification: GASOLINE SERVICE STATIONS Organizations: CUMBERLAND FARMS #1045, JOYCE SCHULTZ, DEALER (CONTACT/OWNER)
Alternative names: CUMBERLAND FARMS #1045
HEIGHTS ELEMENTARY SCHOOL (15200 ALEXANDRIA COURT in FT. MYERS, FL)
(Geographic Names Information System) (National Center for Education Statistics) - STATE ID-0421 Organizations: LEE COUNTY SCHOOL DISTRICT (SCHOOL DISTRICT)
CIRCLE K #4850 (16768 MCGREGOR BLVD in FORT MYERS, FL)
National Pollutant Discharge Elimination System NON-MAJOR (Tracking pollutant discharge elimination systems) - permit (Resource Conservation and Recovery Act (tracking hazardous waste)) Business SIC classification: GASOLINE SERVICE STATIONS Organizations: STEVE BELIN (CONTACT/OWNER)
SHELTON JAGUAR DEALERSHIP (15875 S TAMIAMI TR in FORT MYERS, FL)
National Pollutant Discharge Elimination System NON-MAJOR (Tracking pollutant discharge elimination systems) - permit (Resource Conservation and Recovery Act (tracking hazardous waste)) Organizations: SHELLMEYER INC (CONTACT/OWNER)
Alternative names: SHELLMYER INC
ALICO COMMERCE CENTER (7800 DREW CIRCLE in FORT MYERS, FL)
National Pollutant Discharge Elimination System NON-MAJOR (Tracking pollutant discharge elimination systems) - permit National Pollutant Discharge Elimination System NON-MAJOR (Tracking pollutant discharge elimination systems) - permit Organizations: JAMES KNOTT (CONTACT/OWNER)
Alternative names: NEESE & ASSOCIATES, OMEGA PROTEIN - REEDVILLE
HEALTHPARK MEDICAL CENTER EXPA (9981 HEALTHPARK CIRCLE in FORT MYERS, FL)
National Pollutant Discharge Elimination System NON-MAJOR (Tracking pollutant discharge elimination systems) - permit Small Quantity Generators, between 100 kg and 1000 kg of hazardous waste/month (Resource Conservation and Recovery Act (tracking hazardous waste)) - notification Organizations: RAY ALEXANDER (CONTACT/OWNER)
, BRAD LUCAS (CONTACT/OWNER)
Alternative names: LEE CO MEMORIAL HOSP HEALTHPARK
HERON HOUSE ASSISTED LIVING (9731 COMMERCE CENTER CT in FT MYERS, FL)
National Pollutant Discharge Elimination System NON-MAJOR (Tracking pollutant discharge elimination systems) - permit National Pollutant Discharge Elimination System NON-MAJOR (Tracking pollutant discharge elimination systems) - permit Alternative names: HERON HOUSE ASSISTED LIVING FA, STERLING SENIOR SERVICES
Housing units lacking complete plumbing facilities: 0.1% Housing units lacking complete kitchen facilities: 0.8%
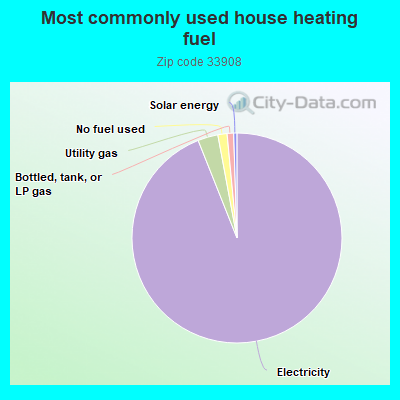
93.5%Electricity
3.1%Utility gas
1.4%No fuel used
1.0%Bottled, tank, or LP gas
0.5%Solar energy
Population in 1990: 17,050. Population change in the 1990s: +7,970 (+46.7%).
Place of birth for U.S.-born residents:
This state: 6,348
Northeast: 10,786
Midwest: 13,218
South: 3,706
West: 1,169
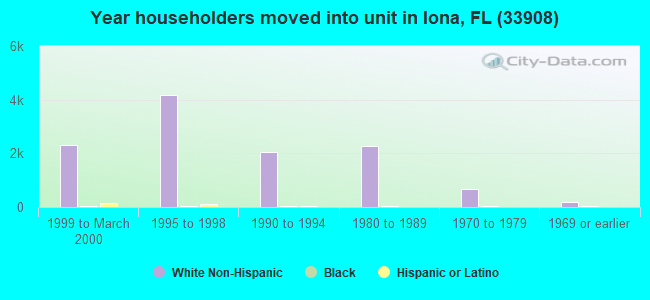
47% of the 33908 zip code residents lived in the same house 5 years ago. Out of people who lived in different houses, 45% lived in this county. Out of people who lived in different counties, 50% lived in Florida.
89% of the 33908 zip code residents lived in the same house 1 year ago. Out of people who lived in different houses, 41% moved from this county. Out of people who lived in different houses, 7% moved from different county within same state. Out of people who lived in different houses, 48% moved from different state. Out of people who lived in different houses, 8% moved from abroad.
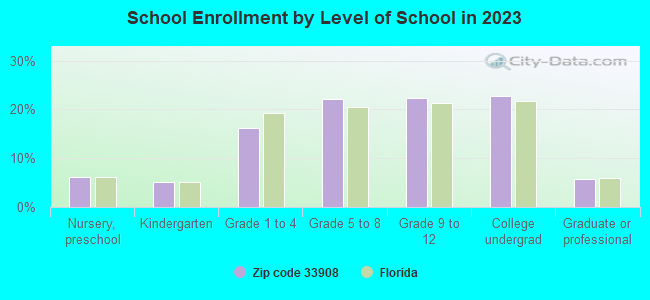
Private vs. public school enrollment:
Students in private schools in grades 1 to 8 (elementary and middle school): 208
Here:
15.4%
Florida:
15.8%
Students in private schools in grades 9 to 12 (high school): 134
Here:
12.7%
Florida:
12.9%
Students in private undergraduate colleges: 173
Here:
19.4%
Florida:
23.6%
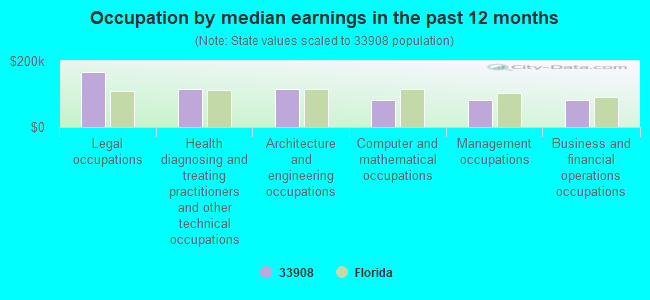
Occupation by median earnings in the past 12 months ($)
167,731Legal occupations
116,385Health diagnosing and treating practitioners and other technical occupations
114,744Architecture and engineering occupations
82,670Computer and mathematical occupations
82,450Management occupations
81,457Business and financial operations occupations
Companies with federal contracts located in this zip code (FORT MYERS, FL):
MCREGOR MOBILE HOMES D/B/A MCGREGOR PARK (16650 MCGREGOR BLVD., SUITE 103; small business) : $74,480 in 2 contractsfrom 2005 to 2006
$99,960 with Federal Emergency Management Agency for Lease or Rental of Facilities -- Parking Facilities Conservation. Signed on 2005-12-22. Effective on 2005-11-25. Completion date: 2006-09-30.
-$25,480, same as above.Signed on 2006-08-15. Effective on 2006-08-14. Completion date: 2006-09-30.
JUDY, PAMELA (19370 S TAMIAMI TRAIL; small business) : $72,925 in 41 contractsfrom 2002 to 2004
Contracts for Recreational Services by Army, U.S. Army Corps of Engineers - civil program financing only Signed by year:2000: $0; 2001: $0; 2002: $18,379; 2003: $18,890; 2004: $35,656; 2005: $0; 2006: $0.
Biggest contracts:
$6,345 with Army for Recreational Services. Taking place in OH. Signed on 2004-06-28. Completion date: 2004-06-30.
$6,345 with U.S. Army Corps of Engineers - civil program financing only for Recreational Services. Taking place in OH. Signed on 2004-06-28. Completion date: 2004-06-30.
$5,824, same as above.Signed on 2003-06-17. Completion date: 2003-06-30.
$5,469, same as above.Signed on 2002-06-24. Completion date: 2002-07-05.
JOSEPH W. WIGGINS (15031-201 PUNTA RASSA ROA; small business)
$70,000 with Navy for Legal Services. Signed on 1999-10-07. Completion date: 2001-09-30.
VOLTECH INSTRUMENTS, INC (11637 KELLY ROAD; small business) : $62,015 in 2 contractsin 2004
$58,500 with Navy for Electrical and Electronic Properties Measuring and Testing Instruments. Taking place in PA. Signed on 2004-12-02. Completion date: 2005-02-01.
$3,515 with NASA for Maintenance, Repair and Rebuilding of Equipment -- Miscellaneous. Signed on 2004-09-24. Effective on 2004-09-30. Completion date: 2004-11-01.
GATEWAY COACHWORKS (6778 DANAH CT; small business) : $61,208 in 2 contractsfrom 2000 to 2002
$31,550 with Air Force for Lease or Rental of Equipment -- Ground Effect Vehicles, Motor Vehicles, Trailers, and Cycles. Signed on 2002-08-23. Completion date: 2003-09-30.
$29,658, same as above.Signed on 2000-02-10. Completion date: 2001-02-10.
BRUNDAGE, L D INC (16450 S TAMIAMI TRL STE 6; small business)
$5,963 with Navy for ADP Central Processing Unit (CPU, Computer), Analog. Signed on 2005-01-19. Completion date: 2005-02-03.
Top industries in this zip code by the number of employees in 2005:
Health Care and Social Assistance: General Medical and Surgical Hospitals (over 1000 employees: 1 establishment)
Health Care and Social Assistance: Continuing Care Retirement Communities (500-999: 1, 250-499: 1)
Accommodation and Food Services: Hotels (except Casino Hotels) and Motels (500-999: 1, 50-99: 1, 20-49: 1, 1-4: 2)
2002 - 2018 National Fire Incident Reporting System (NFIRS) incidents
According to the data from the years 2002 - 2018 the average number of fire incidents per year is 81. The highest number of fires - 167 took place in 2003, and the least - 17 in 2002. The data has a growing trend.
When looking into fire subcategories, the most incidents belonged to: Outside Fires (48.1%), and Structure Fires (33.7%).
Fire incident types reported to NFIRS in Zip Code 33908


 Nearest zip codes: 33914, 33904, 33919, 33931, 33990, 33991.


 According to the data from the years 2002 - 2018 the average number of fire incidents per year is 81. The highest number of fires - 167 took place in 2003, and the least - 17 in 2002. The data has a growing trend.
 When looking into fire subcategories, the most incidents belonged to: Outside Fires (48.1%), and Structure Fires (33.7%).