Estimated zip code population in 2022: 44,510 Zip code population in 2010: 35,848 Zip code population in 2000: 25,709
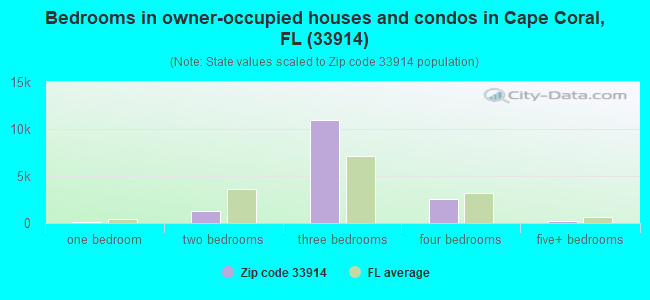
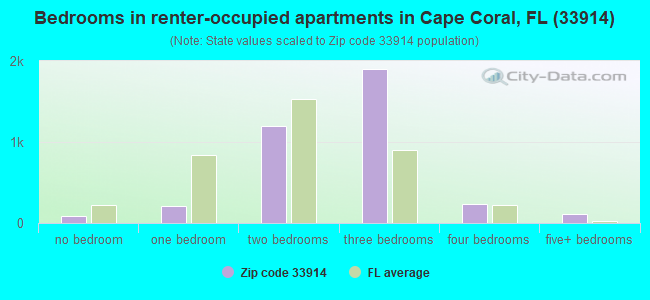
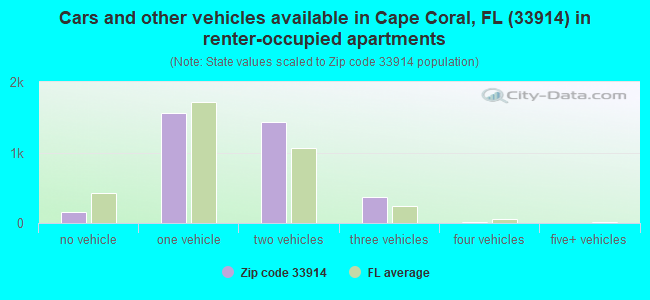
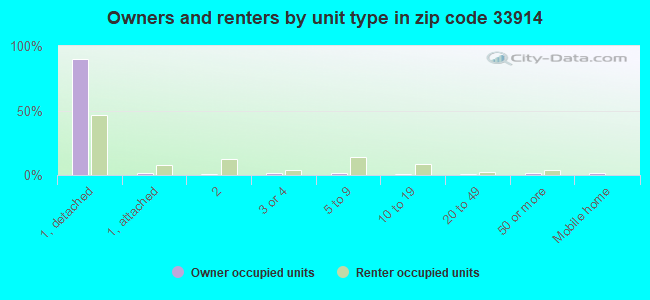
Houses and condos: 23,372 Renter-occupied apartments: 3,539
% of renters here:
19%
State:
33%
March 2022 cost of living index in zip code 33914: 93.9 (less than average, U.S. average is 100)
Land area: 22.2 sq. mi. Water area: 12.9 sq. mi.
Population density: 2,003 people per square mile
(low).
OSM Map
General Map
Google Map
MSN Map
OSM Map
General Map
Google Map
MSN Map
OSM Map
General Map
Google Map
MSN Map
OSM Map
General Map
Google Map
MSN Map
Please wait while loading the map...
Real estate property taxes paid for housing units in 2022:
This zip code:
0.8% ($3,765)
Florida:
0.7% ($2,529)
Median real estate property taxes paid for housing units with mortgages in 2022: $3,752 (0.9%) Median real estate property taxes paid for housing units with no mortgage in 2022: $3,780 (0.8%)
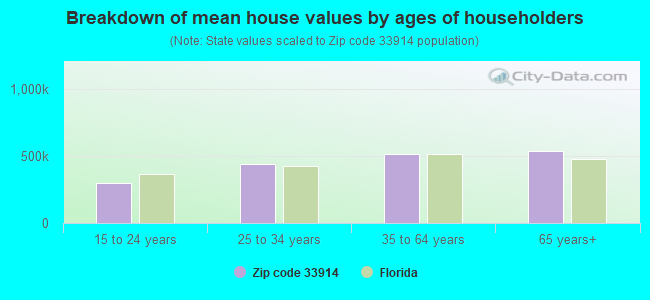
Estimated median house/condo value in 2022: $447,654
33914:
$447,654
Florida:
$354,100
According to our research of Florida and other state lists, there were 20 registered sex offenders living in 33914 zip code as of April 27, 2024. The ratio of all residents to sex offenders in zip code 33914 is 1,869 to 1. The ratio of registered sex offenders to all residents in this zip code is much lower than the state average.
Median resident age:
This zip code:
54.7 years
Florida median age:
42.7 years
Average household size:
This zip code:
2.4 people
Florida:
2.5 people
Averages for the 2020 tax year for zip code 33914, filed in 2021:
Average Adjusted Gross Income (AGI) in 2020: $86,090 (Individual Income Tax Returns)
Here:
$86,090
State:
$82,200
Salary/wage: $60,744 (reported on 71.9% of returns)
Here:
$60,744
State:
$58,347
(% of AGI for various income ranges: 1069.0% for AGIs below $25k, 3400.9% for AGIs $25k-50k, 5834.8% for AGIs $50k-75k, 8308.1% for AGIs $75k-100k, 15105.4% for AGIs $100k-200k, 63749.5% for AGIs over 200k)
Taxable interest for individuals: $3,141 (reported on 33.7% of returns)
This zip code:
$3,141
Florida:
$4,272
(% of AGI for various income ranges: 30.7% for AGIs below $25k, 41.2% for AGIs $25k-50k, 73.7% for AGIs $50k-75k, 120.8% for AGIs $75k-100k, 258.5% for AGIs $100k-200k, 2949.5% for AGIs over 200k)
Ordinary dividends: $9,954 (reported on 24.2% of returns)
Here:
$9,954
State:
$15,863
(% of AGI for various income ranges: 49.6% for AGIs below $25k, 60.5% for AGIs $25k-50k, 164.3% for AGIs $50k-75k, 257.2% for AGIs $75k-100k, 657.7% for AGIs $100k-200k, 6997.4% for AGIs over 200k)
Net capital gain/loss in AGI: +$39,821 (reported on 23.9% of returns)
Here:
+$39,821
State:
+$62,983
(% of AGI for various income ranges: 12.2% for AGIs below $25k, 66.1% for AGIs $25k-50k, 136.3% for AGIs $50k-75k, 308.0% for AGIs $75k-100k, 1177.1% for AGIs $100k-200k, 42531.6% for AGIs over 200k)
Profit/loss from business: +$15,735 (reported on 20.2% of returns)
Here:
+$15,735
State:
+$9,719
(% of AGI for various income ranges: 231.6% for AGIs below $25k, 250.9% for AGIs $25k-50k, 308.3% for AGIs $50k-75k, 311.6% for AGIs $75k-100k, 602.2% for AGIs $100k-200k, 6670.0% for AGIs over 200k)
Taxable individual retirement arrangement distribution: $27,075 (reported on 13.6% of returns)
33914:
$27,075
Florida:
$24,823
(% of AGI for various income ranges: 75.2% for AGIs below $25k, 142.3% for AGIs $25k-50k, 337.4% for AGIs $50k-75k, 741.2% for AGIs $75k-100k, 1614.3% for AGIs $100k-200k, 5927.4% for AGIs over 200k)
Self-employed (Keogh) retirement plans: $24,050 (reported on 0.4% of returns)
33914:
$24,050
Florida:
$29,694
(% of AGI for various income ranges: 5.2% for AGIs $25k-50k, 33.4% for AGIs $100k-200k, 359.8% for AGIs over 200k)
Total itemized deductions: $33,223 (reported on 9.6% of returns)
Here:
$33,223
State:
$45,393
(% of AGI for various income ranges: 77.0% for AGIs below $25k, 158.1% for AGIs $25k-50k, 376.9% for AGIs $50k-75k, 560.7% for AGIs $75k-100k, 1042.7% for AGIs $100k-200k, 6122.3% for AGIs over 200k)
Charity contributions: $8,200 (reported on 7.4% of returns)
Here:
$8,200
State:
$20,178
(% of AGI for various income ranges: 2.8% for AGIs below $25k, 13.9% for AGIs $25k-50k, 38.9% for AGIs $50k-75k, 65.7% for AGIs $75k-100k, 179.1% for AGIs $100k-200k, 1846.0% for AGIs over 200k)
Taxes paid: $7,477 (reported on 9.4% of returns)
33914:
$7,477
State:
$6,967
(% of AGI for various income ranges: 16.3% for AGIs below $25k, 35.2% for AGIs $25k-50k, 89.8% for AGIs $50k-75k, 128.3% for AGIs $75k-100k, 258.9% for AGIs $100k-200k, 1199.5% for AGIs over 200k)
Earned income credit: $2,102 (reported on 13.7% of returns)
Here:
$2,102
State:
$2,306
(% of AGI for various income ranges: 88.9% for AGIs below $25k, 59.1% for AGIs $25k-50k, 0.6% for AGIs $50k-75k)
Percentage of individuals using paid preparers for their 2020 taxes: 92.9%
Here:
93%
State:
92%
(% for various income ranges: 91.5% for AGIs below $25k, 93.5% for AGIs $25k-50k, 94.1% for AGIs $50k-75k, 92.9% for AGIs $75k-100k, 93.5% for AGIs $100k-200k, 92.8% for AGIs over 200k)
Averages for the 2012 tax year for zip code 33914, filed in 2013:
Average Adjusted Gross Income (AGI) in 2012: $66,261 (Individual Income Tax Returns)
Here:
$66,261
State:
$60,316
Salary/wage: $45,392 (reported on 75.9% of returns)
Here:
$45,392
State:
$45,277
(% of AGI for various income ranges: 69.1% for AGIs below $25k, 72.9% for AGIs $25k-50k, 64.1% for AGIs $50k-75k, 61.4% for AGIs $75k-100k, 58.3% for AGIs $100k-200k, 27.0% for AGIs over 200k)
Taxable interest for individuals: $2,787 (reported on 34.2% of returns)
This zip code:
$2,787
Florida:
$3,587
(% of AGI for various income ranges: 1.4% for AGIs below $25k, 1.1% for AGIs $25k-50k, 1.1% for AGIs $50k-75k, 1.2% for AGIs $75k-100k, 1.5% for AGIs $100k-200k, 1.8% for AGIs over 200k)
Ordinary dividends: $8,643 (reported on 23.3% of returns)
Here:
$8,643
State:
$12,831
(% of AGI for various income ranges: 3.1% for AGIs below $25k, 1.7% for AGIs $25k-50k, 2.1% for AGIs $50k-75k, 1.8% for AGIs $75k-100k, 2.9% for AGIs $100k-200k, 4.5% for AGIs over 200k)
Net capital gain/loss in AGI: +$32,344 (reported on 20.4% of returns)
Here:
+$32,344
State:
+$33,493
(% of AGI for various income ranges: 0.2% for AGIs $25k-50k, 0.7% for AGIs $50k-75k, 1.4% for AGIs $75k-100k, 2.5% for AGIs $100k-200k, 28.2% for AGIs over 200k)
Profit/loss from business: +$11,854 (reported on 17.6% of returns)
Here:
+$11,854
State:
+$10,012
(% of AGI for various income ranges: 11.0% for AGIs below $25k, 3.6% for AGIs $25k-50k, 2.1% for AGIs $50k-75k, 2.5% for AGIs $75k-100k, 3.0% for AGIs $100k-200k, 2.0% for AGIs over 200k)
Taxable individual retirement arrangement distribution: $20,120 (reported on 14.5% of returns)
33914:
$20,120
Florida:
$21,544
(% of AGI for various income ranges: 4.2% for AGIs below $25k, 3.7% for AGIs $25k-50k, 4.6% for AGIs $50k-75k, 5.3% for AGIs $75k-100k, 6.7% for AGIs $100k-200k, 2.7% for AGIs over 200k)
Self-employment retirement plans: $16,012 (reported on 0.5% of returns)
33914:
$16,012
Florida:
$20,611
Total itemized deductions: $24,360 (19% of AGI, reported on 32.7% of returns)
Here:
$24,360
State:
$25,533
Here:
19.2% of AGI
State:
18.0% of AGI
(% of AGI for various income ranges: 13.8% for AGIs below $25k, 12.6% for AGIs $25k-50k, 14.0% for AGIs $50k-75k, 13.1% for AGIs $75k-100k, 14.1% for AGIs $100k-200k, 8.7% for AGIs over 200k)
Charity contributions: $3,083 (reported on 26.1% of returns)
Here:
$3,083
State:
$5,698
(% of AGI for various income ranges: 0.6% for AGIs below $25k, 0.9% for AGIs $25k-50k, 1.2% for AGIs $50k-75k, 1.3% for AGIs $75k-100k, 1.6% for AGIs $100k-200k, 1.1% for AGIs over 200k)
Taxes paid: $7,824 (reported on 32.2% of returns)
33914:
$7,824
State:
$6,203
(% of AGI for various income ranges: 3.3% for AGIs below $25k, 2.9% for AGIs $25k-50k, 3.3% for AGIs $50k-75k, 3.6% for AGIs $75k-100k, 4.2% for AGIs $100k-200k, 4.2% for AGIs over 200k)
Earned income credit: $2,136 (reported on 17.9% of returns)
Here:
$2,136
State:
$2,372
(% of AGI for various income ranges: 6.2% for AGIs below $25k, 1.0% for AGIs $25k-50k)
Percentage of individuals using paid preparers for their 2012 taxes: 53.7%
Here:
54%
State:
54%
(% for various income ranges: 48.9% for AGIs below $25k, 50.4% for AGIs $25k-50k, 56.5% for AGIs $50k-75k, 56.7% for AGIs $75k-100k, 62.6% for AGIs $100k-200k, 83.1% for AGIs over 200k)
Averages for the 2004 tax year for zip code 33914, filed in 2005:
Average Adjusted Gross Income (AGI) in 2004: $55,152 (Individual Income Tax Returns)
Here:
$55,152
State:
$50,523
Salary/wage: $40,943 (reported on 80.6% of returns)
Here:
$40,943
State:
$39,563
(% of AGI for various income ranges: 224.2% for AGIs below $10k, 72.7% for AGIs $10k-25k, 75.1% for AGIs $25k-50k, 72.0% for AGIs $50k-75k, 68.8% for AGIs $75k-100k, 42.3% for AGIs over 100k)
Taxable interest for individuals: $2,288 (reported on 48.3% of returns)
This zip code:
$2,288
Florida:
$3,211
(% of AGI for various income ranges: 17.1% for AGIs below $10k, 2.3% for AGIs $10k-25k, 1.7% for AGIs $25k-50k, 1.6% for AGIs $50k-75k, 1.6% for AGIs $75k-100k, 2.1% for AGIs over 100k)
Taxable dividends: $4,277 (reported on 26.1% of returns)
Here:
$4,277
State:
$6,129
(% of AGI for various income ranges: 11.8% for AGIs below $10k, 1.9% for AGIs $10k-25k, 1.3% for AGIs $25k-50k, 1.2% for AGIs $50k-75k, 1.4% for AGIs $75k-100k, 2.7% for AGIs over 100k)
Net capital gain/loss: +$23,835 (reported on 25.4% of returns)
Here:
+$23,835
State:
+$27,205
(% of AGI for various income ranges: 10.9% for AGIs below $10k, 0.7% for AGIs $10k-25k, 1.3% for AGIs $25k-50k, 2.7% for AGIs $50k-75k, 3.9% for AGIs $75k-100k, 21.8% for AGIs over 100k)
Profit/loss from business: +$15,065 (reported on 18.1% of returns)
Here:
+$15,065
State:
+$10,634
(% of AGI for various income ranges: 11.8% for AGIs below $10k, 7.6% for AGIs $10k-25k, 4.8% for AGIs $25k-50k, 3.2% for AGIs $50k-75k, 3.2% for AGIs $75k-100k, 5.7% for AGIs over 100k)
IRA payment deduction: $3,290 (reported on 3.8% of returns)
33914:
$3,290
Florida:
$3,082
(% of AGI for various income ranges: 0.8% for AGIs below $10k, 0.3% for AGIs $10k-25k, 0.4% for AGIs $25k-50k, 0.3% for AGIs $50k-75k, 0.3% for AGIs $75k-100k, 0.1% for AGIs over 100k)
Self-employed pension: $15,661 (reported on 0.7% of returns)
Here:
$15,661
Florida:
$15,857
(% of AGI for various income ranges: 0.1% for AGIs $25k-50k, 0.1% for AGIs $50k-75k, 0.1% for AGIs $75k-100k, 0.4% for AGIs over 100k)
Total itemized deductions: $20,088 (24% of AGI, reported on 45.6% of returns)
Here:
$20,088
State:
$20,370
Here:
24.1% of AGI
State:
20.7% of AGI
(% of AGI for various income ranges: 77.4% for AGIs below $10k, 21.5% for AGIs $10k-25k, 21.9% for AGIs $25k-50k, 19.2% for AGIs $50k-75k, 18.2% for AGIs $75k-100k, 11.6% for AGIs over 100k)
Charity contributions deductions: $2,410 (3% of AGI, reported on 37.4% of returns)
Here:
$2,410
State:
$4,064
Here:
2.7% of AGI
State:
3.8% of AGI
(% of AGI for various income ranges: 2.4% for AGIs below $10k, 1.3% for AGIs $10k-25k, 1.6% for AGIs $25k-50k, 1.7% for AGIs $50k-75k, 1.7% for AGIs $75k-100k, 1.7% for AGIs over 100k)
Total tax: $9,003 (reported on 77.2% of returns)
33914:
$9,003
State:
$9,431
(% of AGI for various income ranges: 8.5% for AGIs below $10k, 4.2% for AGIs $10k-25k, 6.4% for AGIs $25k-50k, 8.4% for AGIs $50k-75k, 10.0% for AGIs $75k-100k, 18.8% for AGIs over 100k)
Earned income credit: $1,705 (reported on 12.9% of returns)
Here:
$1,705
State:
$1,808
Percentage of individuals using paid preparers for their 2004 taxes: 60.0%
Here:
60%
State:
60%
(% for various income ranges: 51.7% for AGIs below $10k, 60.0% for AGIs $10k-25k, 59.7% for AGIs $25k-50k, 60.2% for AGIs $50k-75k, 60.3% for AGIs $75k-100k, 72.6% for AGIs over 100k)
Likely homosexual households (counted as self-reported same-sex unmarried-partner households)
Lesbian couples: 0.0% of all households
Gay men: 0.1% of all households
Household received Food Stamps/SNAP in the past 12 months: 784 Household did not receive Food Stamps/SNAP in the past 12 months: 18,027
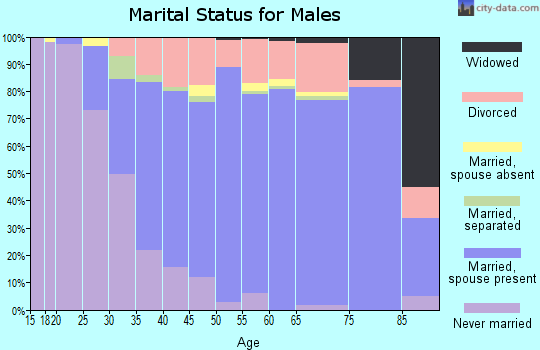
Women who had a birth in the past 12 months: 279 (250 now married, 38 unmarried) Women who did not have a birth in the past 12 months: 7,047 (3,613 now married, 3,437 unmarried)
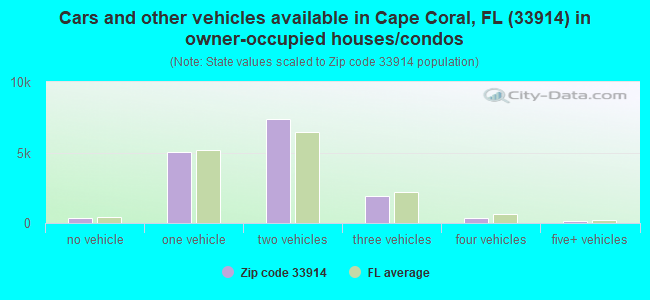
Housing units in zip code 33914 with a mortgage: 9,447 (615 second mortgage, 512 both second mortgage and home equity loan) Houses without a mortgage: 290
Median monthly owner costs for units with a mortgage: $1,991 Median monthly owner costs for units without a mortgage: $759
Residents with income below the poverty level in 2022:
This zip code:
7.3%
Whole state:
12.7%
Residents with income below 50% of the poverty level in 2022:
This zip code:
3.7%
Whole state:
6.6%
Median number of rooms in houses and condos:
Here:
6.0
State:
5.9
Median number of rooms in apartments:
Here:
4.9
State:
4.2
Notable locations in this zip code not listed on our city pages
Notable locations in zip code 33914: Gulf Points Square (A), Boulevard Plaza (B), Cape Coral Fire Department Station 6 (C), Lee County Emergency Medical Services (D), Cape Coral Fire Department Station 9 (E), Cape Coral - Lee County Public Library (F). Display/hide their locations on the map
Churches in zip code 33914 include: Evangelical Presbyterian Church (A), Christ the Servant Church of the Brethren (B), Abiding Love Lutheran Church (C), Cape Coral Christian Reformed Church (D), Cape Coral Lutheran Brethren Church (E). Display/hide their locations on the map
4,098 married couples with children.
660 single-parent households (420 men, 240 women).
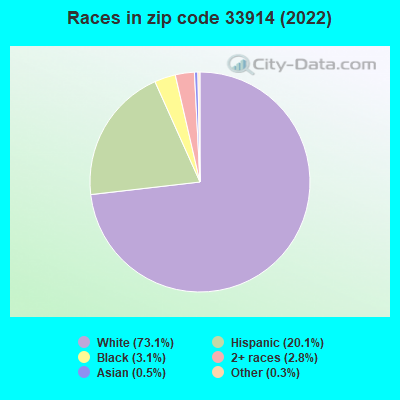
79.9% of residents of 33914 zip code speak English at home.
16.5% of residents speak Spanish at home (39% very well, 25% well, 23% not well, 12% not at all).
3.5% of residents speak other Indo-European language at home (80% very well, 9% well, 11% not well).
0.2% of residents speak Asian or Pacific Island language at home (73% very well, 19% well, 8% not well).
0.1% of residents speak other language at home (50% very well, 50% well).
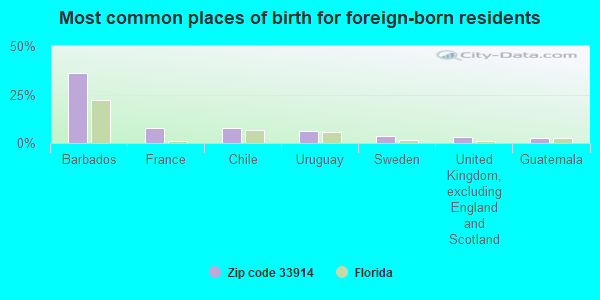
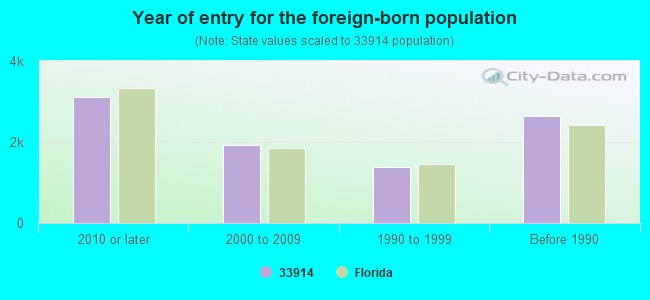
Foreign born population: 7,616 (17.1%) (67.4% of them are naturalized citizens)
National Pollutant Discharge Elimination System NON-MAJOR (Tracking pollutant discharge elimination systems) - permit National Pollutant Discharge Elimination System NON-MAJOR (Tracking pollutant discharge elimination systems) - permit Organizations: BOB RUSSELL (CONTACT/OWNER)
GULF ELEMENTARY SCHOOL (3400 S.W. 17TH PLACE in CAPE CORAL, FL)
(Geographic Names Information System) (National Center for Education Statistics) - STATE ID-0672 Organizations: LEE COUNTY SCHOOL DISTRICT (SCHOOL DISTRICT)
GULF MIDDLE SCHOOL (1809 S.W. 36TH TERRACE in CAPE CORAL, FL)
(Geographic Names Information System) (National Center for Education Statistics) - STATE ID-0671 Organizations: LEE COUNTY SCHOOL DISTRICT (SCHOOL DISTRICT)
PELICAN ELEMENTARY SCHOOL (3525 S.W. 3RD AVENUE in CAPE CORAL, FL)
(Geographic Names Information System) (National Center for Education Statistics) - STATE ID-0641 Organizations: LEE COUNTY SCHOOL DISTRICT (SCHOOL DISTRICT)
CIRCLE K #1735 (3704 SKYLINE BLVD in CAPE CORAL, FL)
National Pollutant Discharge Elimination System NON-MAJOR (Tracking pollutant discharge elimination systems) - permit (Resource Conservation and Recovery Act (tracking hazardous waste)) Organizations: STEVE BELIN, COMPLIANCE MGR (CONTACT/OWNER)
, DARYL GOTTILLA (CONTACT/OWNER)
CIRCLE K #4729 (2505 SANTA BARBARA in CAPE CORAL, FL)
National Pollutant Discharge Elimination System NON-MAJOR (Tracking pollutant discharge elimination systems) - permit (Resource Conservation and Recovery Act (tracking hazardous waste)) Business SIC classification: GASOLINE SERVICE STATIONS Organizations: STEVE BELIN, COMPLIANCE MGR (CONTACT/OWNER)
, LEE CLARK (CONTACT/OWNER)
Alternative names: CIRCLE K STORE #4729
A YOUNG'S MONTESSORI (3217 CHIQUITA BLVD in CAPE CORAL, FL)
National Pollutant Discharge Elimination System NON-MAJOR (Tracking pollutant discharge elimination systems) - permit National Pollutant Discharge Elimination System NON-MAJOR (Tracking pollutant discharge elimination systems) - permit Alternative names: A YOUNG CHILDREN'S MONTESSORI, GREENBRIAR GENERAL CONTRACTING
PORTO VISTA (1500 SW 50TH STREET-1524 SW 50 in CAPE CORAL, FL)
National Pollutant Discharge Elimination System NON-MAJOR (Tracking pollutant discharge elimination systems) - permit Organizations: ROBERT KEILING (CONTACT/OWNER)
AMSOUTH BANK - CAPE CORAL (1522 CAPE CORAL PKWY. in CAPE CORAL, FL)
National Pollutant Discharge Elimination System NON-MAJOR (Tracking pollutant discharge elimination systems) - permit Organizations: GREGORY HARRIS (CONTACT/OWNER)
MARINA VILLAGE II HARBOUR MAST (6041 SILVER KIING BLVD in CAPE CORAL, FL)
National Pollutant Discharge Elimination System NON-MAJOR (Tracking pollutant discharge elimination systems) - permit Organizations: JAMES CRUMBIE (CONTACT/OWNER)
BLOCK 5889 SINGLE FAMILY SUBDI (2811 SW 20TH AVE./CAPE CORAL U in CAPE CORAL, FL)
National Pollutant Discharge Elimination System NON-MAJOR (Tracking pollutant discharge elimination systems) - permit Organizations: BRIAN HANG (CONTACT/OWNER)
Housing units lacking complete plumbing facilities: 0.3% Housing units lacking complete kitchen facilities: 0.1%
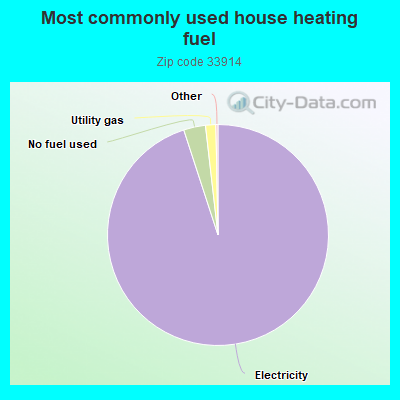
95.0%Electricity
3.2%No fuel used
1.5%Utility gas
Population in 1990: 15,782. Population change in the 1990s: +9,927 (+62.9%).
Place of birth for U.S.-born residents:
This state: 7,149
Northeast: 12,382
Midwest: 10,836
South: 3,540
West: 1,601
45% of the 33914 zip code residents lived in the same house 5 years ago. Out of people who lived in different houses, 46% lived in this county. Out of people who lived in different counties, 50% lived in Florida.
88% of the 33914 zip code residents lived in the same house 1 year ago. Out of people who lived in different houses, 23% moved from this county. Out of people who lived in different houses, 7% moved from different county within same state. Out of people who lived in different houses, 57% moved from different state. Out of people who lived in different houses, 24% moved from abroad.
Private vs. public school enrollment:
Students in private schools in grades 1 to 8 (elementary and middle school): 515
Here:
23.8%
Florida:
15.8%
Students in private schools in grades 9 to 12 (high school): 111
Here:
7.8%
Florida:
12.9%
Students in private undergraduate colleges: 86
Here:
8.9%
Florida:
23.6%
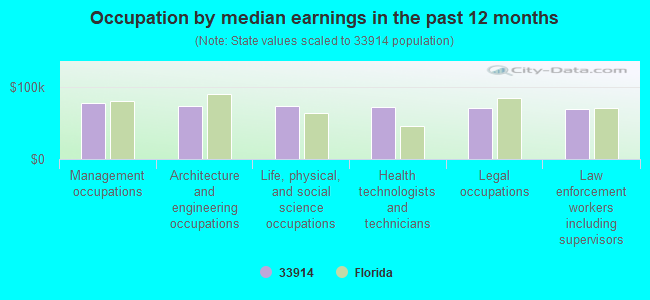
Occupation by median earnings in the past 12 months ($)
76,970Management occupations
73,079Architecture and engineering occupations
72,927Life, physical, and social science occupations
72,002Health technologists and technicians
71,101Legal occupations
68,863Law enforcement workers including supervisors
Companies with federal contracts located in this zip code:
GAUGLER DAVID L (2655 SW 31st Lane in Cape Coral, FL; small business) : $95,178 in 7 contractsfrom 2005 to 2006
Contracts for Personal Services Contracts by Departmental Offices Signed by year:2000: $0; 2001: $0; 2002: $0; 2003: $0; 2004: $0; 2005: $35,823; 2006: $59,355.
Biggest contracts:
$41,475 with Departmental Offices for Personal Services Contracts. Taking place in DC. Signed on 2006-06-14. Completion date: 2010-06-14.
$17,760, same as above.Signed on 2006-03-21. Completion date: 2010-06-14.
$14,511, same as above.Signed on 2005-06-14. Completion date: 2010-06-14.
$14,208, same as above.Signed on 2005-07-29. Completion date: 2010-06-14.
AMERICAN SHRINKWRAP COMPANY IN (4506 SW 5TH AVENUE in CAPE CORAL, FL; small business) : $6,981 in 2 contractsfrom 2003 to 2005
$3,600 with Navy for Electrical Insulators and Insulating Materials. Signed on 2005-02-18. Completion date: 2005-03-02.
$3,381 with Army for Plastics Fabricated Materials. Taking place in NJ. Signed on 2003-03-11. Completion date: 2003-04-11.
Top industries in this zip code by the number of employees in 2005:
2002 - 2018 National Fire Incident Reporting System (NFIRS) incidents
According to the data from the years 2002 - 2018 the average number of fire incidents per year is 65. The highest number of fires - 95 took place in 2006, and the least - 38 in 2015. The data has a dropping trend.
When looking into fire subcategories, the most incidents belonged to: Outside Fires (46.6%), and Structure Fires (27.5%).
Fire incident types reported to NFIRS in Zip Code 33914


 Nearest zip codes: 33908, 33991, 33904, 33990, 33957, 33919.
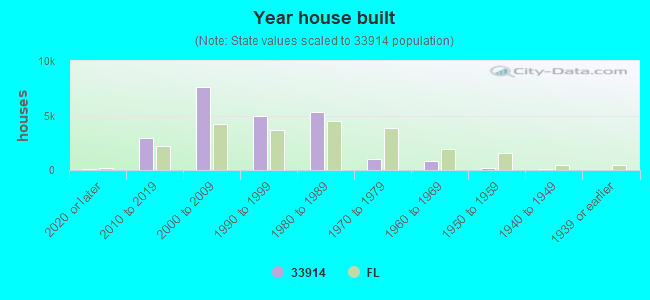


 According to the data from the years 2002 - 2018 the average number of fire incidents per year is 65. The highest number of fires - 95 took place in 2006, and the least - 38 in 2015. The data has a dropping trend.
 When looking into fire subcategories, the most incidents belonged to: Outside Fires (46.6%), and Structure Fires (27.5%).