Estimated zip code population in 2022: 27,285 Zip code population in 2010: 18,994 Zip code population in 2000: 16,418
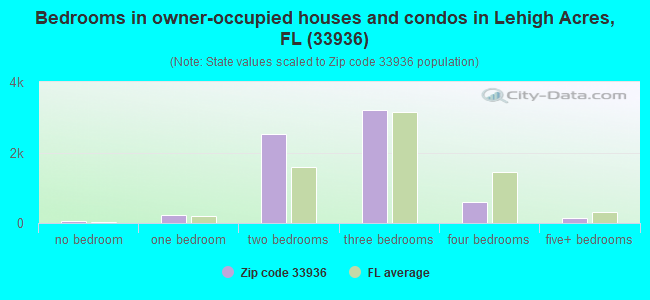
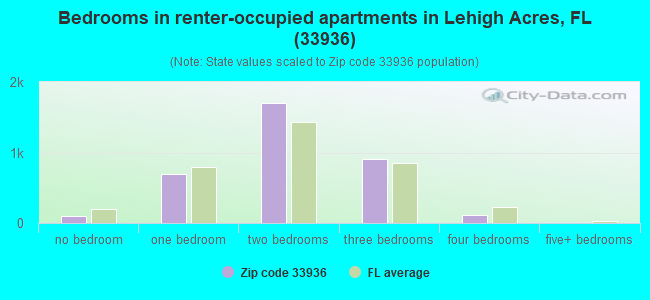
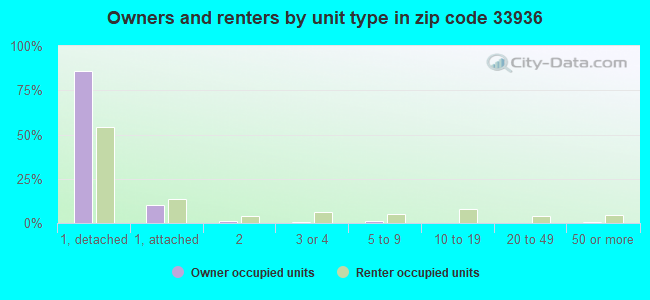
Houses and condos: 11,052 Renter-occupied apartments: 3,531
% of renters here:
34%
State:
33%
March 2022 cost of living index in zip code 33936: 91.8 (less than average, U.S. average is 100)
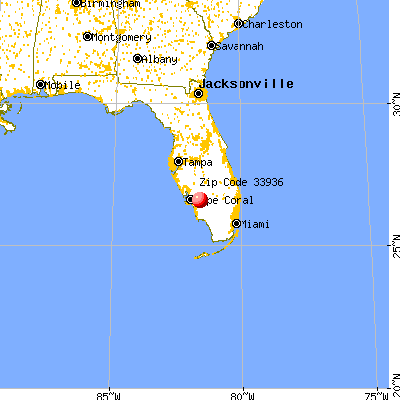
Land area: 19.7 sq. mi. Water area: 0.2 sq. mi.
Population density: 1,384 people per square mile
(low).
OSM Map
General Map
Google Map
MSN Map
OSM Map
General Map
Google Map
MSN Map
OSM Map
General Map
Google Map
MSN Map
OSM Map
General Map
Google Map
MSN Map
Please wait while loading the map...
Real estate property taxes paid for housing units in 2022:
This zip code:
0.6% ($1,426)
Florida:
0.7% ($2,529)
Median real estate property taxes paid for housing units with mortgages in 2022: $1,578 (0.7%) Median real estate property taxes paid for housing units with no mortgage in 2022: $1,232 (0.6%)
Averages for the 2020 tax year for zip code 33936, filed in 2021:
Average Adjusted Gross Income (AGI) in 2020: $37,217 (Individual Income Tax Returns)
Here:
$37,217
State:
$82,200
Salary/wage: $34,473 (reported on 78.8% of returns)
Here:
$34,473
State:
$58,347
(% of AGI for various income ranges: 1130.9% for AGIs below $25k, 3611.9% for AGIs $25k-50k, 6415.3% for AGIs $50k-75k, 9459.3% for AGIs $75k-100k, 13986.8% for AGIs $100k-200k)
Taxable interest for individuals: $838 (reported on 14.9% of returns)
This zip code:
$838
Florida:
$4,272
(% of AGI for various income ranges: 6.8% for AGIs below $25k, 11.5% for AGIs $25k-50k, 23.9% for AGIs $50k-75k, 37.5% for AGIs $75k-100k, 125.4% for AGIs $100k-200k)
Ordinary dividends: $2,640 (reported on 7.2% of returns)
Here:
$2,640
State:
$15,863
(% of AGI for various income ranges: 8.7% for AGIs below $25k, 15.1% for AGIs $25k-50k, 42.1% for AGIs $50k-75k, 59.1% for AGIs $75k-100k, 191.8% for AGIs $100k-200k)
Net capital gain/loss in AGI: +$7,915 (reported on 7.1% of returns)
Here:
+$7,915
State:
+$62,983
(% of AGI for various income ranges: 2.8% for AGIs below $25k, 17.3% for AGIs $25k-50k, 59.4% for AGIs $50k-75k, 264.1% for AGIs $75k-100k, 590.4% for AGIs $100k-200k)
Profit/loss from business: +$6,599 (reported on 21.6% of returns)
Here:
+$6,599
State:
+$9,719
(% of AGI for various income ranges: 207.5% for AGIs below $25k, 130.8% for AGIs $25k-50k, 135.1% for AGIs $50k-75k, 232.0% for AGIs $75k-100k, 606.4% for AGIs $100k-200k)
Taxable individual retirement arrangement distribution: $14,320 (reported on 5.5% of returns)
33936:
$14,320
Florida:
$24,823
(% of AGI for various income ranges: 31.9% for AGIs below $25k, 48.7% for AGIs $25k-50k, 124.4% for AGIs $50k-75k, 330.9% for AGIs $75k-100k, 1278.2% for AGIs $100k-200k)
Total itemized deductions: $29,400 (reported on 2.2% of returns)
Here:
$29,400
State:
$45,393
(% of AGI for various income ranges: 17.3% for AGIs below $25k, 62.1% for AGIs $25k-50k, 180.6% for AGIs $50k-75k, 127.0% for AGIs $75k-100k, 796.4% for AGIs $100k-200k)
Charity contributions: $9,512 (reported on 1.5% of returns)
Here:
$9,512
State:
$20,178
(% of AGI for various income ranges: 11.5% for AGIs $25k-50k, 39.8% for AGIs $50k-75k, 296.8% for AGIs $100k-200k)
Taxes paid: $4,800 (reported on 2.0% of returns)
33936:
$4,800
State:
$6,967
(% of AGI for various income ranges: 3.5% for AGIs below $25k, 10.9% for AGIs $25k-50k, 21.2% for AGIs $50k-75k, 25.0% for AGIs $75k-100k, 103.6% for AGIs $100k-200k)
Earned income credit: $2,376 (reported on 28.5% of returns)
Here:
$2,376
State:
$2,306
(% of AGI for various income ranges: 134.1% for AGIs below $25k, 79.7% for AGIs $25k-50k, 1.7% for AGIs $50k-75k)
Percentage of individuals using paid preparers for their 2020 taxes: 92.2%
Here:
92%
State:
92%
(% for various income ranges: 90.9% for AGIs below $25k, 93.6% for AGIs $25k-50k, 92.5% for AGIs $50k-75k, 92.4% for AGIs $75k-100k, 91.3% for AGIs $100k-200k, 100.0% for AGIs over 200k)
Averages for the 2012 tax year for zip code 33936, filed in 2013:
Average Adjusted Gross Income (AGI) in 2012: $31,645 (Individual Income Tax Returns)
Here:
$31,645
State:
$60,316
Salary/wage: $28,274 (reported on 78.0% of returns)
Here:
$28,274
State:
$45,277
(% of AGI for various income ranges: 70.0% for AGIs below $25k, 76.8% for AGIs $25k-50k, 72.0% for AGIs $50k-75k, 66.4% for AGIs $75k-100k, 70.0% for AGIs $100k-200k)
Taxable interest for individuals: $1,204 (reported on 21.4% of returns)
This zip code:
$1,204
Florida:
$3,587
(% of AGI for various income ranges: 0.9% for AGIs below $25k, 0.6% for AGIs $25k-50k, 0.6% for AGIs $50k-75k, 1.2% for AGIs $75k-100k, 1.1% for AGIs $100k-200k, 1.2% for AGIs over 200k)
Ordinary dividends: $3,073 (reported on 12.3% of returns)
Here:
$3,073
State:
$12,831
(% of AGI for various income ranges: 1.6% for AGIs below $25k, 0.9% for AGIs $25k-50k, 0.7% for AGIs $50k-75k, 1.7% for AGIs $75k-100k, 1.8% for AGIs $100k-200k)
Net capital gain/loss in AGI: +$4,279 (reported on 8.3% of returns)
Here:
+$4,279
State:
+$33,493
(% of AGI for various income ranges: 0.2% for AGIs $25k-50k, 0.7% for AGIs $50k-75k, 1.1% for AGIs $75k-100k, 7.0% for AGIs $100k-200k)
Profit/loss from business: +$7,467 (reported on 15.2% of returns)
Here:
+$7,467
State:
+$10,012
(% of AGI for various income ranges: 10.0% for AGIs below $25k, 2.3% for AGIs $25k-50k, 1.1% for AGIs $50k-75k, 2.0% for AGIs $75k-100k, 1.6% for AGIs $100k-200k)
Taxable individual retirement arrangement distribution: $9,780 (reported on 8.9% of returns)
33936:
$9,780
Florida:
$21,544
(% of AGI for various income ranges: 2.4% for AGIs below $25k, 2.1% for AGIs $25k-50k, 3.0% for AGIs $50k-75k, 2.5% for AGIs $75k-100k, 5.9% for AGIs $100k-200k)
Total itemized deductions: $16,661 (29% of AGI, reported on 13.6% of returns)
Here:
$16,661
State:
$25,533
Here:
29.1% of AGI
State:
18.0% of AGI
(% of AGI for various income ranges: 5.1% for AGIs below $25k, 7.7% for AGIs $25k-50k, 8.0% for AGIs $50k-75k, 7.2% for AGIs $75k-100k, 8.0% for AGIs $100k-200k, 7.9% for AGIs over 200k)
Charity contributions: $3,300 (reported on 9.7% of returns)
Here:
$3,300
State:
$5,698
(% of AGI for various income ranges: 0.5% for AGIs below $25k, 0.9% for AGIs $25k-50k, 1.3% for AGIs $50k-75k, 1.5% for AGIs $75k-100k, 1.7% for AGIs $100k-200k)
Taxes paid: $2,244 (reported on 13.2% of returns)
33936:
$2,244
State:
$6,203
(% of AGI for various income ranges: 0.5% for AGIs below $25k, 0.9% for AGIs $25k-50k, 1.1% for AGIs $50k-75k, 1.0% for AGIs $75k-100k, 1.4% for AGIs $100k-200k, 1.5% for AGIs over 200k)
Earned income credit: $2,455 (reported on 31.4% of returns)
Here:
$2,455
State:
$2,372
(% of AGI for various income ranges: 9.1% for AGIs below $25k, 1.4% for AGIs $25k-50k)
Percentage of individuals using paid preparers for their 2012 taxes: 48.3%
Here:
48%
State:
54%
(% for various income ranges: 46.6% for AGIs below $25k, 48.7% for AGIs $25k-50k, 51.1% for AGIs $50k-75k, 51.3% for AGIs $75k-100k, 60.0% for AGIs $100k-200k, 66.7% for AGIs over 200k)
Averages for the 2004 tax year for zip code 33936, filed in 2005:
Average Adjusted Gross Income (AGI) in 2004: $32,621 (Individual Income Tax Returns)
Here:
$32,621
State:
$50,523
Salary/wage: $30,222 (reported on 83.6% of returns)
Here:
$30,222
State:
$39,563
(% of AGI for various income ranges: 102.4% for AGIs below $10k, 77.1% for AGIs $10k-25k, 82.7% for AGIs $25k-50k, 81.5% for AGIs $50k-75k, 77.8% for AGIs $75k-100k, 51.7% for AGIs over 100k)
Taxable interest for individuals: $1,537 (reported on 33.1% of returns)
This zip code:
$1,537
Florida:
$3,211
(% of AGI for various income ranges: 4.4% for AGIs below $10k, 1.8% for AGIs $10k-25k, 1.2% for AGIs $25k-50k, 1.3% for AGIs $50k-75k, 1.0% for AGIs $75k-100k, 2.7% for AGIs over 100k)
Taxable dividends: $1,945 (reported on 14.6% of returns)
Here:
$1,945
State:
$6,129
(% of AGI for various income ranges: 3.8% for AGIs below $10k, 1.1% for AGIs $10k-25k, 0.6% for AGIs $25k-50k, 0.6% for AGIs $50k-75k, 1.0% for AGIs $75k-100k, 1.1% for AGIs over 100k)
Net capital gain/loss: +$9,060 (reported on 12.5% of returns)
Here:
+$9,060
State:
+$27,205
(% of AGI for various income ranges: -1.5% for AGIs below $10k, 0.5% for AGIs $10k-25k, 1.2% for AGIs $25k-50k, 1.5% for AGIs $50k-75k, 3.5% for AGIs $75k-100k, 18.0% for AGIs over 100k)
Profit/loss from business: +$6,709 (reported on 12.4% of returns)
Here:
+$6,709
State:
+$10,634
(% of AGI for various income ranges: 7.1% for AGIs below $10k, 4.6% for AGIs $10k-25k, 1.7% for AGIs $25k-50k, 1.3% for AGIs $50k-75k, 1.4% for AGIs $75k-100k, 4.5% for AGIs over 100k)
IRA payment deduction: $2,697 (reported on 1.8% of returns)
33936:
$2,697
Florida:
$3,082
(% of AGI for various income ranges: 0.1% for AGIs $10k-25k, 0.2% for AGIs $25k-50k, 0.2% for AGIs $50k-75k, 0.1% for AGIs $75k-100k, 0.1% for AGIs over 100k)
Total itemized deductions: $14,548 (29% of AGI, reported on 25.9% of returns)
Here:
$14,548
State:
$20,370
Here:
29.1% of AGI
State:
20.7% of AGI
(% of AGI for various income ranges: 16.8% for AGIs below $10k, 10.8% for AGIs $10k-25k, 12.8% for AGIs $25k-50k, 11.1% for AGIs $50k-75k, 11.4% for AGIs $75k-100k, 9.5% for AGIs over 100k)
Charity contributions deductions: $2,605 (5% of AGI, reported on 19.9% of returns)
Here:
$2,605
State:
$4,064
Here:
4.9% of AGI
State:
3.8% of AGI
(% of AGI for various income ranges: 0.8% for AGIs below $10k, 1.0% for AGIs $10k-25k, 1.5% for AGIs $25k-50k, 1.7% for AGIs $50k-75k, 1.6% for AGIs $75k-100k, 2.5% for AGIs over 100k)
Total tax: $3,612 (reported on 70.1% of returns)
33936:
$3,612
State:
$9,431
(% of AGI for various income ranges: 3.3% for AGIs below $10k, 3.7% for AGIs $10k-25k, 5.8% for AGIs $25k-50k, 8.0% for AGIs $50k-75k, 10.4% for AGIs $75k-100k, 16.4% for AGIs over 100k)
Earned income credit: $1,819 (reported on 22.2% of returns)
Here:
$1,819
State:
$1,808
Percentage of individuals using paid preparers for their 2004 taxes: 60.0%
Here:
60%
State:
60%
(% for various income ranges: 56.3% for AGIs below $10k, 61.9% for AGIs $10k-25k, 60.1% for AGIs $25k-50k, 59.4% for AGIs $50k-75k, 57.2% for AGIs $75k-100k, 69.0% for AGIs over 100k)
Likely homosexual households (counted as self-reported same-sex unmarried-partner households)
Lesbian couples: 0.3% of all households
Gay men: 0.2% of all households
Household received Food Stamps/SNAP in the past 12 months: 2,334 Household did not receive Food Stamps/SNAP in the past 12 months: 7,901
Women who had a birth in the past 12 months: 271 (87 now married, 171 unmarried) Women who did not have a birth in the past 12 months: 6,130 (2,199 now married, 3,929 unmarried)
Housing units in zip code 33936 with a mortgage: 3,836 (171 second mortgage, 8 home equity loan, 130 both second mortgage and home equity loan) Houses without a mortgage: 31
Median monthly owner costs for units with a mortgage: $1,194 Median monthly owner costs for units without a mortgage: $390
Residents with income below the poverty level in 2022:
This zip code:
21.6%
Whole state:
12.7%
Residents with income below 50% of the poverty level in 2022:
This zip code:
11.2%
Whole state:
6.6%
Median number of rooms in houses and condos:
Here:
5.3
State:
5.9
Median number of rooms in apartments:
Here:
4.4
State:
4.2
Notable locations in this zip code not listed on our city pages
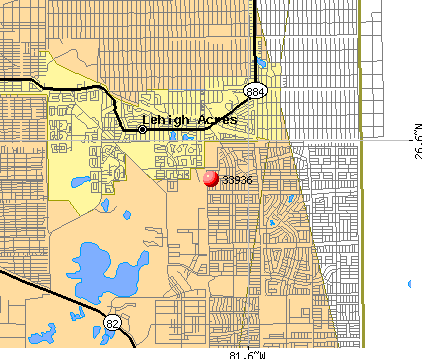
Notable locations in zip code 33936: Las Colinas Golf Course (A), Lakewood Country Club (B), Lehigh Acres Fire Control and Rescue District Station 101 (C), Lehigh Acres Fire Control and Rescue District Station 102 (D), Caloosahatchee Forestry Center (E), Lee County Sheriff's Office Bravo East District (F). Display/hide their locations on the map
Churches in zip code 33936 include: Temple Emanuel (A), Richmond Avenue Baptist Church of Lehigh (B), Lehigh Acres Church of the Nazarene (C), Lehigh Acres Christian Church (D), First Church of Christ Scientist (E), First Baptist Church of Lehigh (F), Faith Lutheran Church (G), Christ United Methodist Church of Lehigh Acres (H), Covenant Presbyterian Church (I). Display/hide their locations on the map
2,548 married couples with children.
2,117 single-parent households (345 men, 1,772 women).
59.2% of residents of 33936 zip code speak English at home.
36.2% of residents speak Spanish at home (47% very well, 20% well, 22% not well, 11% not at all).
4.2% of residents speak other Indo-European language at home (80% very well, 10% well, 11% not well).
0.3% of residents speak Asian or Pacific Island language at home (70% very well, 30% well).
0.3% of residents speak other language at home (68% very well, 21% not well, 11% not at all).
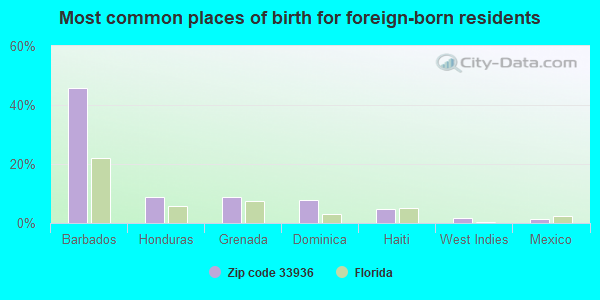
Foreign born population: 7,168 (26.3%) (56.7% of them are naturalized citizens)
This zip code:
26.3%
Whole state:
21.7%
46%Barbados
9%Honduras
9%Grenada
8%Dominica
5%Haiti
2%West Indies
2%Mexico
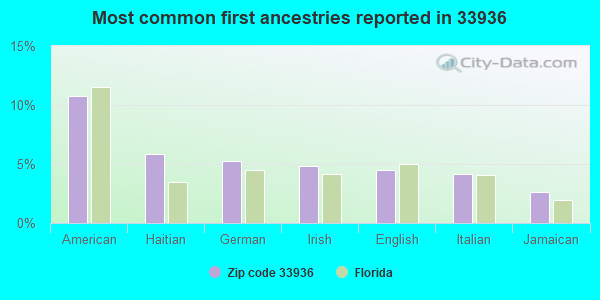
11%American
6%Haitian
5%German
5%Irish
4%English
4%Italian
3%Jamaican
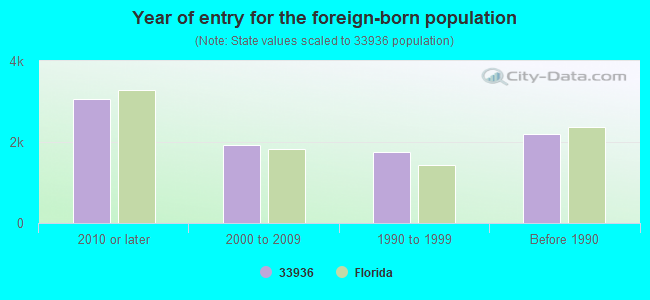
Year of entry for the foreign-born population
3,0532010 or later
1,9162000 to 2009
1,7491990 to 1999
2,196Before 1990
Major facilities with environmental interests located in this zip code:
LEHIGH ACRES WWTP (500 CONSTRUCTION LANE in LEHIGH ACRES, FL)
STATE MASTER (FDM) - WAFR-FLA014565, DOMESTIC WASTEWATER PROGRAM, WAFR-FLR05F646, NPDES STORMWATER PROGRAM, WAFR-FLR05F789, WAFR-FLR05F646, NPDES STORMWATER PERMIT, WAFR-FLR05F789, National Pollutant Discharge Elimination System NON-MAJOR (Tracking pollutant discharge elimination systems) - permit Business SIC classification: SEWERAGE SYSTEMS Organizations: FLORIDA WATER SERVICES CORPORATION, FLORIDA GOVERNMENTAL UTILITY AUTHORITY, URS, PBS & J, H & H L.D.S., INC., FLORIDA GOVERNEMNTAL UTILITY AUTHORITY (CONTACT/APPLICANT)
, FLORIDA WATER SERVICES CORP/PARK MANOR WWTF (CONTACT/APPLICANT)
, CHARLOTTE COUNTY UTILITIES (CONTACT/APPLICANT)
, FLORIDA WATER SERVICES CORP. (P.O. BOX 609520) (CONTACT/APPLICANT)
, HARTMAN & ASSOCIATES, INC. (CONTACT/APPLICANT)
, FLORIDA GOVERNMENTAL UTILITY AUTHORITY (CONTACT/APPLICANT)
, URS (CONTACT/APPLICANT)
, FGUA (CONTACT/APPLICANT)
, LEHIIGH ACRES (CONTACT/APPLICANT)
, CHARLES SWEAT (CONTACT/OWNER)
, FLORIDA WATER SERVICES CORP/PARK MANOR WWTF (CONTACT/PERMIT)
, FGUA (CONTACT/PERMIT)
Alternative names: LEHIGH ACRES UTILITIES INC
HESS STATION (1351 HOMESTEAD RD N in LEHIGH ACRES, FL)
STATE MASTER (FDM) - CHAZ-FLD984223461, HAZARDOUS WASTE REGULATION PROGRAM National Pollutant Discharge Elimination System NON-MAJOR (Tracking pollutant discharge elimination systems) - permit Business SIC classification: GASOLINE SERVICE STATIONS Organizations: SUPERAMERICA OF FLORIDA #8010, MIKE MATRI (CONTACT/OWNER)
Alternative names: HESS STATION #09473, SUPERAMERICA OF FLORIDA #8010
LEHIGH ELEMENTARY SCHOOL (200 SCHOOLWAY COURT in LEHIGH ACRES, FL)
(Geographic Names Information System) (National Center for Education Statistics) - STATE ID-0301 Organizations: LEE COUNTY SCHOOL DISTRICT (SCHOOL DISTRICT)
LEHIGH ACRES MIDDLE SCHOOL (104 ARTHUR AVENUE in LEHIGH ACRES, FL)
(Geographic Names Information System) (National Center for Education Statistics) - STATE ID-0691 Organizations: LEE COUNTY SCHOOL DISTRICT (SCHOOL DISTRICT)
MIRROR LAKES ELEMENTARY SCHOOL (525 CHARWOOD AVENUE SOUTH in LEHIGH ACRES, FL)
(National Center for Education Statistics) - STATE ID-0371 Organizations: LEE COUNTY SCHOOL DISTRICT (SCHOOL DISTRICT)
LEHIGH PARK (SWDS1, NO.1) (LEHIGH PARK FIELD in LEHIGH ACRES, FL)
(Integrated Compliance Information System) - ICIS-04-1997-0422, FORMAL ENFORCEMENT ACTION Business SIC classification: CRUDE PETROLEUM AND NATURAL GAS
LEHIGH POOL SERVICE, INC. (801 WEST LEELAND HEIGHTS BLVD. in LEHIGH ACRES, FL)
LEHIGH CLEANERS AND TAILOR SHOP (25 NORTH HOMESTEAD ROAD in LEHIGH ACRES, FL)
AIR MINOR (AIRS/AFS) (Resource Conservation and Recovery Act (tracking hazardous waste)) Business SIC classification: DRYCLEANING PLANTS, EXCEPT RUG CLEANING Organizations: TONY & ELSIE JORDAN (CONTACT/OWNER)
7-ELEVEN STORE #26053 (530 JOEL BLVD in LEHIGH ACRES, FL)
National Pollutant Discharge Elimination System NON-MAJOR (Tracking pollutant discharge elimination systems) - permit Organizations: WILLO SMITH (CONTACT/OWNER)
Alternative names: AMOCO #178
LEHIGH MOBIL (1361 LEE BOULEVARD in LEHIGH ACRES, FL)
National Pollutant Discharge Elimination System NON-MAJOR (Tracking pollutant discharge elimination systems) - permit Small Quantity Generators, between 100 kg and 1000 kg of hazardous waste/month (Resource Conservation and Recovery Act (tracking hazardous waste)) - notification Business SIC classification: GASOLINE SERVICE STATIONS Organizations: THOMAS DRAKE (CONTACT/OWNER)
Alternative names: C/O AUTHUR K. KNUDSEN, FR., LEHIGH ACRES/EXXON
LEHIGH ACRES MEMBER SERVICE FA (226 BETH STACEY BOULEVARD in LEHIGH ACRES, FL)
National Pollutant Discharge Elimination System NON-MAJOR (Tracking pollutant discharge elimination systems) - permit Organizations: EARL BRENDLE (CONTACT/OWNER)
LEHIGH ACRES TOWNHOMES (1434 ALWYNNE DR N in LEHIGH ACRES, FL)
National Pollutant Discharge Elimination System NON-MAJOR (Tracking pollutant discharge elimination systems) - permit Organizations: JOHN HALL (CONTACT/OWNER)
Housing units lacking complete plumbing facilities: 0.9% Housing units lacking complete kitchen facilities: 1.1%
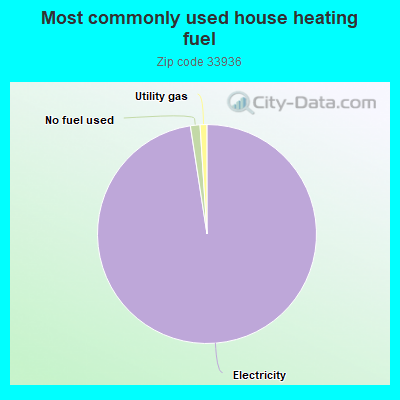
96.8%Electricity
1.4%No fuel used
1.0%Utility gas
Population in 1990: 10,851. Population change in the 1990s: +5,567 (+51.3%).
Place of birth for U.S.-born residents:
This state: 8,154
Northeast: 4,245
Midwest: 3,359
South: 2,086
West: 521
50% of the 33936 zip code residents lived in the same house 5 years ago. Out of people who lived in different houses, 52% lived in this county. Out of people who lived in different counties, 50% lived in Florida.
89% of the 33936 zip code residents lived in the same house 1 year ago. Out of people who lived in different houses, 52% moved from this county. Out of people who lived in different houses, 15% moved from different county within same state. Out of people who lived in different houses, 12% moved from different state. Out of people who lived in different houses, 20% moved from abroad.
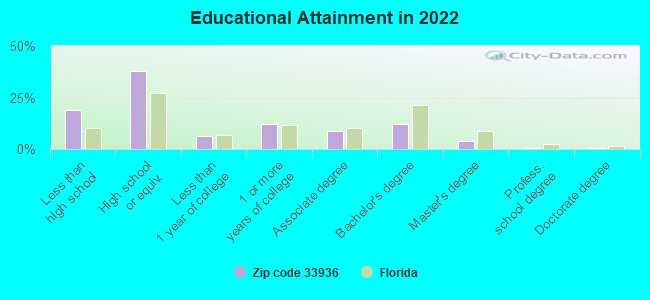
Private vs. public school enrollment:
Students in private schools in grades 1 to 8 (elementary and middle school): 300
Here:
10.5%
Florida:
15.8%
Students in private schools in grades 9 to 12 (high school): 10
Here:
0.9%
Florida:
12.9%
Students in private undergraduate colleges: 226
Here:
22.3%
Florida:
23.6%
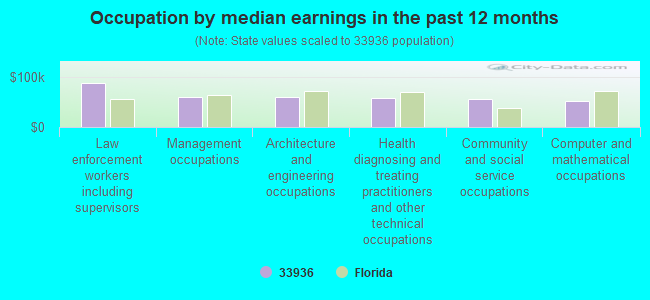
Occupation by median earnings in the past 12 months ($)
88,224Law enforcement workers including supervisors
59,767Management occupations
59,640Architecture and engineering occupations
58,114Health diagnosing and treating practitioners and other technical occupations
56,184Community and social service occupations
52,743Computer and mathematical occupations
Companies with federal contracts located in this zip code:
INNOVAMED USA INC (1103 E LEELAND HEIGHTS BLV in LEHIGH ACRES, FL; small business)
$16,980 with Air Force for Medical and Surgical Instruments, Equipment, and Supplies. Signed on 2006-07-05. Completion date: 2006-07-17.
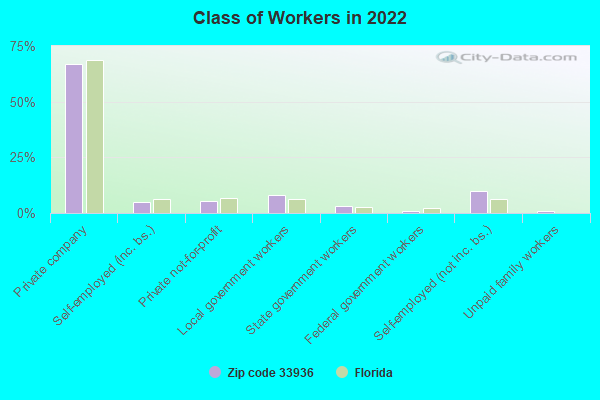
Top industries in this zip code by the number of employees in 2005:
Health Care and Social Assistance: General Medical and Surgical Hospitals (250-499 employees: 1 establishment)
Health Care and Social Assistance: Child Day Care Services (100-249: 1, 20-49: 1, 1-4: 1)
2002 - 2018 National Fire Incident Reporting System (NFIRS) incidents
According to the data from the years 2002 - 2018 the average number of fire incidents per year is 93. The highest number of fires - 193 took place in 2008, and the least - 15 in 2014. The data has a dropping trend.
When looking into fire subcategories, the most incidents belonged to: Outside Fires (56.5%), and Structure Fires (24.4%).
Fire incident types reported to NFIRS in Zip Code 33936


 Nearest zip codes: 33972, 33974, 33976, 33971, 33920, 33973.


 According to the data from the years 2002 - 2018 the average number of fire incidents per year is 93. The highest number of fires - 193 took place in 2008, and the least - 15 in 2014. The data has a dropping trend.
 When looking into fire subcategories, the most incidents belonged to: Outside Fires (56.5%), and Structure Fires (24.4%).