Estimated zip code population in 2022: 7,454 Zip code population in 2010: 4,947 Zip code population in 2000: 4,710
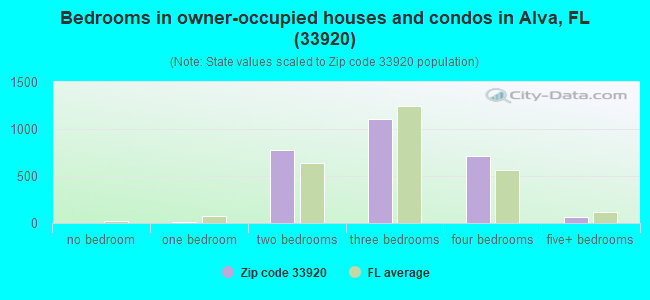
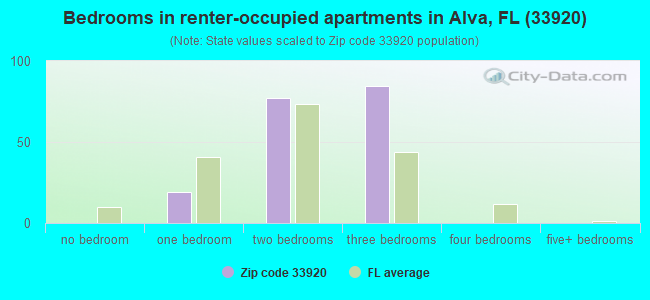
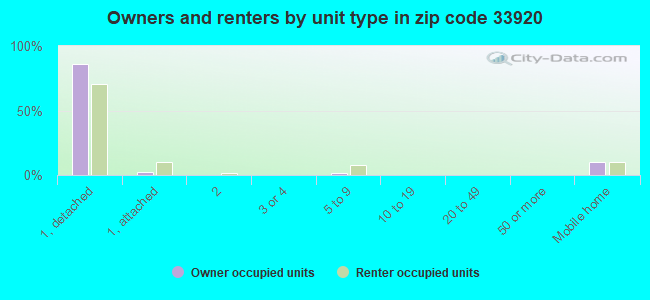
Houses and condos: 3,124 Renter-occupied apartments: 184
% of renters here:
6%
State:
33%
March 2022 cost of living index in zip code 33920: 83.3 (low, U.S. average is 100)
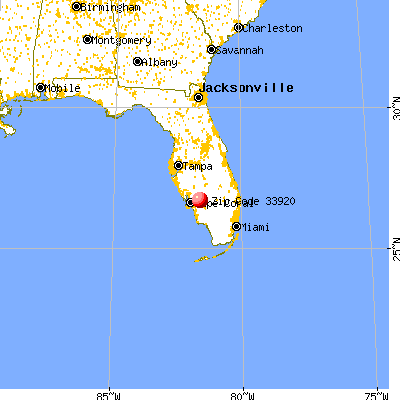
Land area: 61.6 sq. mi. Water area: 1.7 sq. mi.
Population density: 121 people per square mile
(very low).
OSM Map
General Map
Google Map
MSN Map
OSM Map
General Map
Google Map
MSN Map
OSM Map
General Map
Google Map
MSN Map
OSM Map
General Map
Google Map
MSN Map
Please wait while loading the map...
Real estate property taxes paid for housing units in 2022:
This zip code:
0.7% ($2,555)
Florida:
0.7% ($2,529)
Median real estate property taxes paid for housing units with mortgages in 2022: $3,161 (0.7%) Median real estate property taxes paid for housing units with no mortgage in 2022: $2,038 (0.7%)
Averages for the 2020 tax year for zip code 33920, filed in 2021:
Average Adjusted Gross Income (AGI) in 2020: $110,589 (Individual Income Tax Returns)
Here:
$110,589
State:
$82,200
Salary/wage: $64,349 (reported on 74.1% of returns)
Here:
$64,349
State:
$58,347
(% of AGI for various income ranges: 1124.9% for AGIs below $25k, 3544.6% for AGIs $25k-50k, 6030.9% for AGIs $50k-75k, 8602.5% for AGIs $75k-100k, 15620.6% for AGIs $100k-200k, 67328.6% for AGIs over 200k)
Taxable interest for individuals: $2,786 (reported on 38.2% of returns)
This zip code:
$2,786
Florida:
$4,272
(% of AGI for various income ranges: 34.2% for AGIs below $25k, 47.9% for AGIs $25k-50k, 105.1% for AGIs $50k-75k, 126.2% for AGIs $75k-100k, 244.3% for AGIs $100k-200k, 2552.9% for AGIs over 200k)
Ordinary dividends: $8,694 (reported on 24.2% of returns)
Here:
$8,694
State:
$15,863
(% of AGI for various income ranges: 42.3% for AGIs below $25k, 98.0% for AGIs $25k-50k, 129.4% for AGIs $50k-75k, 187.9% for AGIs $75k-100k, 576.0% for AGIs $100k-200k, 5432.9% for AGIs over 200k)
Net capital gain/loss in AGI: +$33,098 (reported on 24.0% of returns)
Here:
+$33,098
State:
+$62,983
(% of AGI for various income ranges: 8.4% for AGIs below $25k, 79.8% for AGIs $25k-50k, 115.4% for AGIs $50k-75k, 352.9% for AGIs $75k-100k, 1219.1% for AGIs $100k-200k, 32058.6% for AGIs over 200k)
Profit/loss from business: +$11,975 (reported on 15.9% of returns)
Here:
+$11,975
State:
+$9,719
(% of AGI for various income ranges: 169.7% for AGIs below $25k, 130.9% for AGIs $25k-50k, 139.7% for AGIs $50k-75k, 205.4% for AGIs $75k-100k, 464.0% for AGIs $100k-200k, 3308.6% for AGIs over 200k)
Taxable individual retirement arrangement distribution: $25,185 (reported on 15.0% of returns)
33920:
$25,185
Florida:
$24,823
(% of AGI for various income ranges: 107.7% for AGIs below $25k, 202.0% for AGIs $25k-50k, 324.6% for AGIs $50k-75k, 602.9% for AGIs $75k-100k, 1424.6% for AGIs $100k-200k, 5938.6% for AGIs over 200k)
Total itemized deductions: $37,358 (reported on 8.6% of returns)
Here:
$37,358
State:
$45,393
(% of AGI for various income ranges: 200.7% for AGIs $25k-50k, 435.1% for AGIs $50k-75k, 511.2% for AGIs $75k-100k, 792.9% for AGIs $100k-200k, 7045.7% for AGIs over 200k)
Charity contributions: $14,248 (reported on 6.4% of returns)
Here:
$14,248
State:
$20,178
(% of AGI for various income ranges: 8.0% for AGIs below $25k, 47.4% for AGIs $50k-75k, 80.8% for AGIs $75k-100k, 136.9% for AGIs $100k-200k, 3404.3% for AGIs over 200k)
Taxes paid: $6,503 (reported on 8.4% of returns)
33920:
$6,503
State:
$6,967
(% of AGI for various income ranges: 30.5% for AGIs $25k-50k, 67.4% for AGIs $50k-75k, 72.5% for AGIs $75k-100k, 174.6% for AGIs $100k-200k, 1084.3% for AGIs over 200k)
Earned income credit: $2,013 (reported on 11.1% of returns)
Here:
$2,013
State:
$2,306
(% of AGI for various income ranges: 73.5% for AGIs below $25k, 53.2% for AGIs $25k-50k)
Percentage of individuals using paid preparers for their 2020 taxes: 91.9%
Here:
92%
State:
92%
(% for various income ranges: 92.9% for AGIs below $25k, 90.7% for AGIs $25k-50k, 90.4% for AGIs $50k-75k, 92.1% for AGIs $75k-100k, 92.5% for AGIs $100k-200k, 92.9% for AGIs over 200k)
Averages for the 2012 tax year for zip code 33920, filed in 2013:
Average Adjusted Gross Income (AGI) in 2012: $69,781 (Individual Income Tax Returns)
Here:
$69,781
State:
$60,316
Salary/wage: $49,297 (reported on 77.1% of returns)
Here:
$49,297
State:
$45,277
(% of AGI for various income ranges: 68.9% for AGIs below $25k, 72.3% for AGIs $25k-50k, 67.5% for AGIs $50k-75k, 68.6% for AGIs $75k-100k, 64.6% for AGIs $100k-200k, 28.2% for AGIs over 200k)
Taxable interest for individuals: $3,460 (reported on 39.4% of returns)
This zip code:
$3,460
Florida:
$3,587
(% of AGI for various income ranges: 2.3% for AGIs below $25k, 1.4% for AGIs $25k-50k, 1.4% for AGIs $50k-75k, 1.7% for AGIs $75k-100k, 1.4% for AGIs $100k-200k, 2.8% for AGIs over 200k)
Ordinary dividends: $10,486 (reported on 24.6% of returns)
Here:
$10,486
State:
$12,831
(% of AGI for various income ranges: 3.0% for AGIs below $25k, 1.9% for AGIs $25k-50k, 2.3% for AGIs $50k-75k, 2.4% for AGIs $75k-100k, 2.8% for AGIs $100k-200k, 6.0% for AGIs over 200k)
Net capital gain/loss in AGI: +$16,344 (reported on 21.2% of returns)
Here:
+$16,344
State:
+$33,493
(% of AGI for various income ranges: 2.0% for AGIs $75k-100k, 1.4% for AGIs $100k-200k, 13.2% for AGIs over 200k)
Profit/loss from business: +$9,320 (reported on 17.4% of returns)
Here:
+$9,320
State:
+$10,012
(% of AGI for various income ranges: 6.0% for AGIs below $25k, 2.7% for AGIs $25k-50k, 1.9% for AGIs $50k-75k, 3.3% for AGIs $75k-100k, 0.5% for AGIs $100k-200k, 2.6% for AGIs over 200k)
Taxable individual retirement arrangement distribution: $18,088 (reported on 13.6% of returns)
33920:
$18,088
Florida:
$21,544
(% of AGI for various income ranges: 4.7% for AGIs below $25k, 3.9% for AGIs $25k-50k, 4.7% for AGIs $50k-75k, 4.2% for AGIs $75k-100k, 6.8% for AGIs $100k-200k)
Total itemized deductions: $23,556 (18% of AGI, reported on 31.8% of returns)
Here:
$23,556
State:
$25,533
Here:
18.1% of AGI
State:
18.0% of AGI
(% of AGI for various income ranges: 14.9% for AGIs below $25k, 12.1% for AGIs $25k-50k, 13.3% for AGIs $50k-75k, 12.2% for AGIs $75k-100k, 11.7% for AGIs $100k-200k, 7.2% for AGIs over 200k)
Charity contributions: $5,009 (reported on 24.2% of returns)
Here:
$5,009
State:
$5,698
(% of AGI for various income ranges: 1.0% for AGIs below $25k, 1.1% for AGIs $25k-50k, 1.8% for AGIs $50k-75k, 1.7% for AGIs $75k-100k, 1.7% for AGIs $100k-200k, 2.1% for AGIs over 200k)
Taxes paid: $5,564 (reported on 30.5% of returns)
33920:
$5,564
State:
$6,203
(% of AGI for various income ranges: 2.6% for AGIs below $25k, 2.2% for AGIs $25k-50k, 2.6% for AGIs $50k-75k, 2.1% for AGIs $75k-100k, 2.9% for AGIs $100k-200k, 2.2% for AGIs over 200k)
Earned income credit: $2,172 (reported on 15.3% of returns)
Here:
$2,172
State:
$2,372
(% of AGI for various income ranges: 5.4% for AGIs below $25k, 1.0% for AGIs $25k-50k)
Percentage of individuals using paid preparers for their 2012 taxes: 57.2%
Here:
57%
State:
54%
(% for various income ranges: 52.3% for AGIs below $25k, 52.8% for AGIs $25k-50k, 59.4% for AGIs $50k-75k, 65.2% for AGIs $75k-100k, 63.3% for AGIs $100k-200k, 80.0% for AGIs over 200k)
Averages for the 2004 tax year for zip code 33920, filed in 2005:
Average Adjusted Gross Income (AGI) in 2004: $63,120 (Individual Income Tax Returns)
Here:
$63,120
State:
$50,523
Salary/wage: $46,856 (reported on 80.3% of returns)
Here:
$46,856
State:
$39,563
(% of AGI for various income ranges: 203.1% for AGIs below $10k, 71.8% for AGIs $10k-25k, 76.5% for AGIs $25k-50k, 76.3% for AGIs $50k-75k, 76.5% for AGIs $75k-100k, 44.3% for AGIs over 100k)
Taxable interest for individuals: $3,176 (reported on 48.4% of returns)
This zip code:
$3,176
Florida:
$3,211
(% of AGI for various income ranges: 11.9% for AGIs below $10k, 2.7% for AGIs $10k-25k, 1.8% for AGIs $25k-50k, 2.4% for AGIs $50k-75k, 1.4% for AGIs $75k-100k, 2.7% for AGIs over 100k)
Taxable dividends: $3,779 (reported on 25.0% of returns)
Here:
$3,779
State:
$6,129
(% of AGI for various income ranges: 12.7% for AGIs below $10k, 1.6% for AGIs $10k-25k, 1.8% for AGIs $25k-50k, 1.3% for AGIs $50k-75k, 0.4% for AGIs $75k-100k, 1.6% for AGIs over 100k)
Net capital gain/loss: +$30,890 (reported on 23.4% of returns)
Here:
+$30,890
State:
+$27,205
(% of AGI for various income ranges: 2.2% for AGIs below $10k, 0.6% for AGIs $10k-25k, 1.0% for AGIs $25k-50k, 1.4% for AGIs $50k-75k, 6.2% for AGIs $75k-100k, 19.0% for AGIs over 100k)
Profit/loss from business: +$25,593 (reported on 17.7% of returns)
Here:
+$25,593
State:
+$10,634
(% of AGI for various income ranges: 17.5% for AGIs below $10k, 6.4% for AGIs $10k-25k, 3.8% for AGIs $25k-50k, 3.6% for AGIs $50k-75k, 3.5% for AGIs $75k-100k, 9.7% for AGIs over 100k)
IRA payment deduction: $3,683 (reported on 4.4% of returns)
33920:
$3,683
Florida:
$3,082
(% of AGI for various income ranges: 0.3% for AGIs $10k-25k, 0.5% for AGIs $25k-50k, 0.2% for AGIs $50k-75k, 0.3% for AGIs $75k-100k, 0.2% for AGIs over 100k)
Total itemized deductions: $20,074 (19% of AGI, reported on 34.8% of returns)
Here:
$20,074
State:
$20,370
Here:
18.8% of AGI
State:
20.7% of AGI
(% of AGI for various income ranges: 49.4% for AGIs below $10k, 11.0% for AGIs $10k-25k, 12.7% for AGIs $25k-50k, 13.4% for AGIs $50k-75k, 14.5% for AGIs $75k-100k, 8.8% for AGIs over 100k)
Charity contributions deductions: $4,074 (3% of AGI, reported on 27.9% of returns)
Here:
$4,074
State:
$4,064
Here:
3.5% of AGI
State:
3.8% of AGI
(% of AGI for various income ranges: 1.9% for AGIs below $10k, 1.0% for AGIs $10k-25k, 1.2% for AGIs $25k-50k, 1.7% for AGIs $50k-75k, 1.7% for AGIs $75k-100k, 2.1% for AGIs over 100k)
Total tax: $12,246 (reported on 76.1% of returns)
33920:
$12,246
State:
$9,431
(% of AGI for various income ranges: 7.6% for AGIs below $10k, 4.0% for AGIs $10k-25k, 6.5% for AGIs $25k-50k, 8.7% for AGIs $50k-75k, 10.3% for AGIs $75k-100k, 20.6% for AGIs over 100k)
Earned income credit: $1,761 (reported on 13.8% of returns)
Here:
$1,761
State:
$1,808
Percentage of individuals using paid preparers for their 2004 taxes: 63.7%
Here:
64%
State:
60%
(% for various income ranges: 59.7% for AGIs below $10k, 62.9% for AGIs $10k-25k, 60.2% for AGIs $25k-50k, 62.3% for AGIs $50k-75k, 59.9% for AGIs $75k-100k, 80.4% for AGIs over 100k)
Likely homosexual households (counted as self-reported same-sex unmarried-partner households)
Lesbian couples: 0.2% of all households
Gay men: 0.0% of all households
Household received Food Stamps/SNAP in the past 12 months: 45 Household did not receive Food Stamps/SNAP in the past 12 months: 2,809
Women who had a birth in the past 12 months: 36 (38 now married, 0 unmarried) Women who did not have a birth in the past 12 months: 1,384 (734 now married, 651 unmarried)
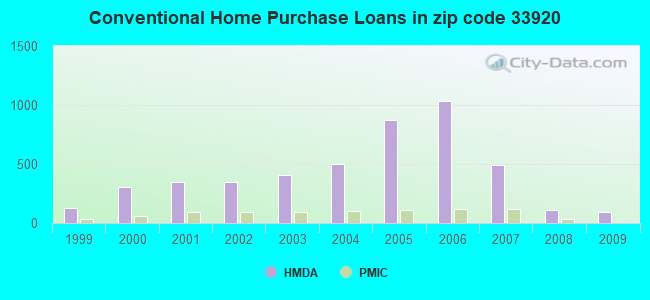
Housing units in zip code 33920 with a mortgage: 1,467 (157 second mortgage, 116 both second mortgage and home equity loan) Median monthly owner costs for units with a mortgage: $1,935 Median monthly owner costs for units without a mortgage: $509
Residents with income below the poverty level in 2022:
This zip code:
5.1%
Whole state:
12.7%
Residents with income below 50% of the poverty level in 2022:
This zip code:
2.5%
Whole state:
6.6%
Median number of rooms in houses and condos:
Here:
5.9
State:
5.9
Median number of rooms in apartments:
Here:
4.9
State:
4.2
Notable locations in this zip code not listed on our city pages
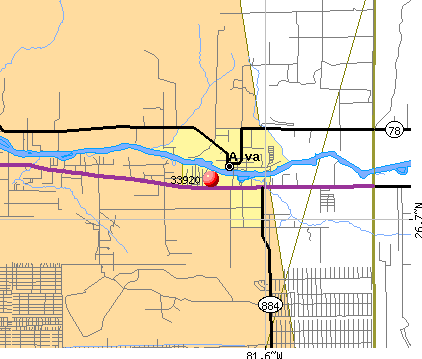
Churches in zip code 33920 include: Olga Baptist Church (A), Upper Room House of Prayer Pentecostal Church (B), First Baptist Church of Alva (C), Alva United Methodist Church (D). Display/hide their locations on the map
Streams, rivers, and creeks: Trout Creek (A), Telegraph Creek (B), Spanish Creek (C), Cypress Creek (D), Owl Creek (E), Otter Creek (F), Stricklin Gully (G), Bedman Creek (H), Hickey Creek (I). Display/hide their locations on the map
In group quarters: 33 (-1 institutionalized population)
Size of family households: 1,298 2-persons, 260 3-persons, 333 4-persons, 156 5-persons, 112 6-persons, 33 7-or-more-persons
Size of nonfamily households: 514 1-person, 110 2-persons, 16 3-persons
1,208 married couples with children.
273 single-parent households (221 men, 52 women).
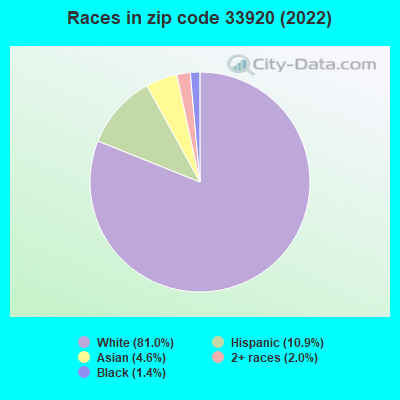
89.5% of residents of 33920 zip code speak English at home.
4.6% of residents speak Spanish at home (74% very well, 12% well, 4% not well, 10% not at all).
2.1% of residents speak other Indo-European language at home (65% very well, 26% well, 10% not well).
3.5% of residents speak Asian or Pacific Island language at home (40% well, 60% not well).
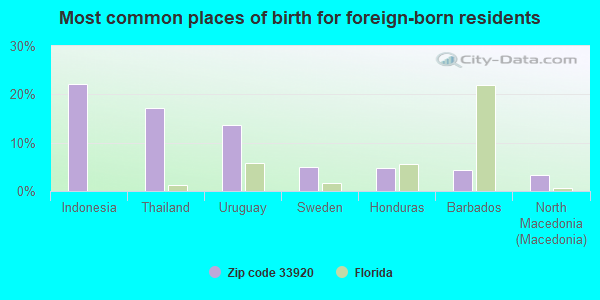
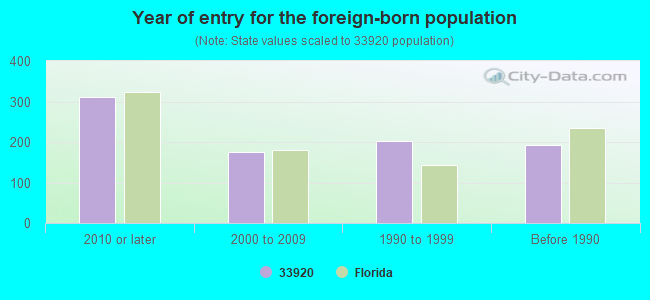
Foreign born population: 772 (10.4%) (50.3% of them are naturalized citizens)
This zip code:
10.4%
Whole state:
21.7%
22%Indonesia
17%Thailand
14%Uruguay
5%Sweden
5%Honduras
4%Barbados
3%North Macedonia (Macedonia)
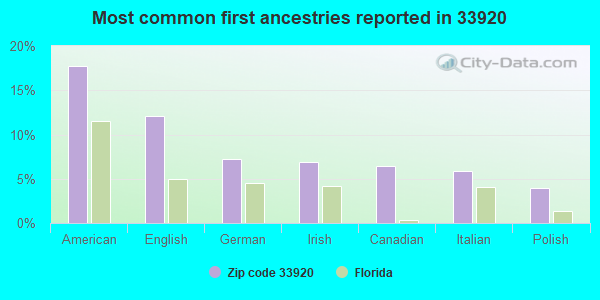
18%American
12%English
7%German
7%Irish
6%Canadian
6%Italian
4%Polish
Year of entry for the foreign-born population
3102010 or later
1762000 to 2009
2021990 to 1999
192Before 1990
Major facilities with environmental interests located in this zip code:
OLGA REVERSE OSMOSIS WTP DEMINERALIZATION CONCENTRATE DISPOS (1450 WERNER DR in ALVA, FL)
STATE MASTER (FDM) - CHAZ-FLR000068015, HAZARDOUS WASTE REGULATION PROGRAM (Resource Conservation and Recovery Act (tracking hazardous waste)) Business SIC classification: WATER SUPPLY Organizations: 5360170 LEE COUNTY UTILITIES OLGA WTP, LEE CO (CONTACT/OWNER)
, LEE COUNTY (CONTACT/OWNER)
Alternative names: 5360170 LEE CO UTILITIES OLGA WTP, 5360170-LEE COUNTY UTILITIES/OLGA WTP
JACK M BERRY INC (3655 STATE RD. 80 WEST in ALVA, FL)
AIR MAJOR (AIRS/AFS) COMPLIANCE ACTIVITY (Tracking inspections of insecticide, fungicide, and rodenticide, and toxic substances) CRITERIA AND HAZARDOUS AIR POLLUTANT INVENTORY (Inventory of air pollution sources) National Pollutant Discharge Elimination System NON-MAJOR (Tracking pollutant discharge elimination systems) - permit Small Quantity Generators, between 100 kg and 1000 kg of hazardous waste/month (Resource Conservation and Recovery Act (tracking hazardous waste)) TRI REPORTER (Tracking of toxic chemicals releasing facilities) Business SIC classification: FROZEN FRUITS, FRUIT JUICES, AND VEGETABLES Business NAICS classification: FROZEN FRUIT, JUICE, AND VEGETABLE MANUFACTURING. Organizations: WILLIAM BUSH (CONTACT/OWNER)
, GENE DODSON, DIR (CONTACT/OWNER)
Alternative names: BERRY CITRUS PRODUCTS, INC, BERRYS CITRUS INC, RALPH LOPEZ
ALVA ELEMENTARY SCHOOL (17500 CHURCH AVENUE in ALVA, FL)
(Geographic Names Information System) (National Center for Education Statistics) - STATE ID-0092 Organizations: LEE COUNTY SCHOOL DISTRICT (SCHOOL DISTRICT)
ALVA MIDDLE SCHOOL (21219 NORTH RIVER RD. in ALVA, FL)
(Geographic Names Information System) (National Center for Education Statistics) - STATE ID-0091 Organizations: LEE COUNTY SCHOOL DISTRICT (SCHOOL DISTRICT)
HAWKS HAVEN BOULEVARD (PALM BCH BLVD in ALVA, FL)
National Pollutant Discharge Elimination System NON-MAJOR (Tracking pollutant discharge elimination systems) - permit Organizations: GRADY MIARS (CONTACT/OWNER)
National Pollutant Discharge Elimination System NON-MAJOR (Tracking pollutant discharge elimination systems) - permit Organizations: GRADY MIARS (CONTACT/OWNER)
HAWKS HAVEN SINGLE FAMILY PHAS (PALM BCH BLVD in ALVA, FL)
National Pollutant Discharge Elimination System NON-MAJOR (Tracking pollutant discharge elimination systems) - permit Organizations: GRADY MIARS (CONTACT/OWNER)
SERENGETI (17310 N. RIVER RD. in ALVA, FL)
National Pollutant Discharge Elimination System NON-MAJOR (Tracking pollutant discharge elimination systems) - permit Organizations: JOHN HALL (CONTACT/OWNER)
HAMPTON LAKES AT RIVER HALL PH (PALM BEACH BLVD in ALVA, FL)
National Pollutant Discharge Elimination System NON-MAJOR (Tracking pollutant discharge elimination systems) - permit Organizations: GRADY MIARS (CONTACT/OWNER)
HICKEY'S CREEKSIDE (17450 PALM BEACH BLVD in ALVA, FL)
National Pollutant Discharge Elimination System NON-MAJOR (Tracking pollutant discharge elimination systems) - permit Organizations: EDWARD OLAH (CONTACT/OWNER)
JACK M BERRY INC (4605 CONGEN RD W in ALVA, FL)
(Resource Conservation and Recovery Act (tracking hazardous waste))
OAK PARK VILLAGE COOPERATIVE INC (21961 EAST PEARL ST in ALVA, FL)
(Resource Conservation and Recovery Act (tracking hazardous waste)) Organizations: OAK PARK VILLAGE CO-OP INC (CONTACT/OWNER)
OWL CREEK BOATWORKS & STORAGE INC (18251 OWL CREEK DR in ALVA, FL)
(Resource Conservation and Recovery Act (tracking hazardous waste)) Organizations: W T FULTON (CONTACT/OWNER)
Housing units lacking complete plumbing facilities: 1.2% Housing units lacking complete kitchen facilities: 0.6%
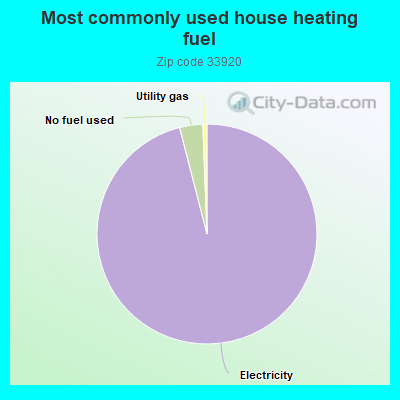
96.1%Electricity
3.4%No fuel used
0.6%Utility gas
Population in 1990: 3,044. Population change in the 1990s: +1,666 (+54.7%).
Place of birth for U.S.-born residents:
This state: 3,141
Northeast: 1,242
Midwest: 1,605
South: 418
West: 126
60% of the 33920 zip code residents lived in the same house 5 years ago. Out of people who lived in different houses, 68% lived in this county. Out of people who lived in different counties, 50% lived in Florida.
91% of the 33920 zip code residents lived in the same house 1 year ago. Out of people who lived in different houses, 33% moved from this county. Out of people who lived in different houses, 23% moved from different county within same state. Out of people who lived in different houses, 46% moved from different state. Out of people who lived in different houses, 3% moved from abroad.
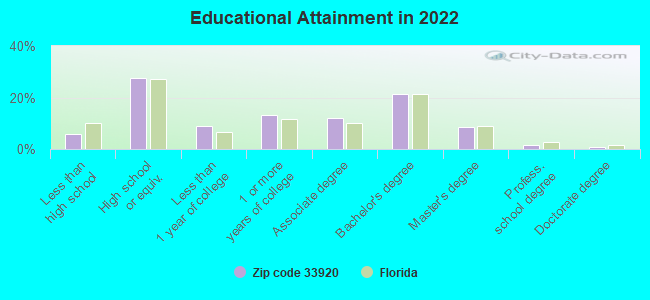
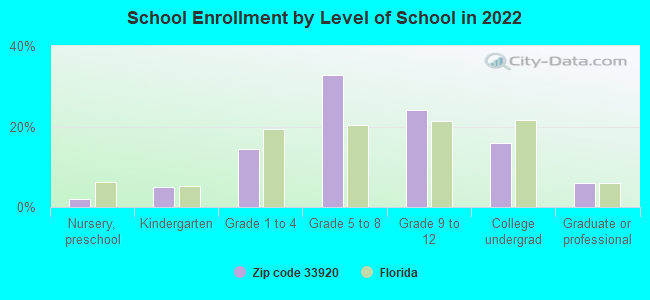
Private vs. public school enrollment:
Students in private schools in grades 1 to 8 (elementary and middle school): 79
Here:
9.5%
Florida:
15.8%
Students in private schools in grades 9 to 12 (high school): 108
Here:
24.8%
Florida:
12.9%
Students in private undergraduate colleges: 35
Here:
12.4%
Florida:
23.6%
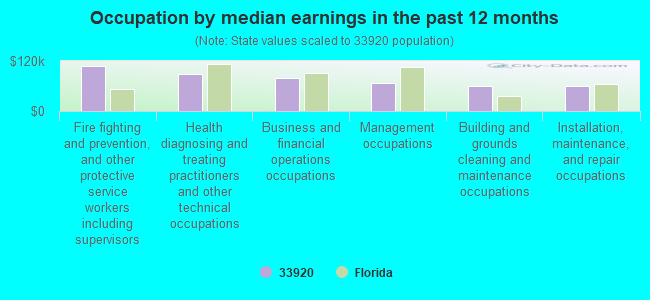
Occupation by median earnings in the past 12 months ($)
107,332Fire fighting and prevention, and other protective service workers including supervisors
89,479Health diagnosing and treating practitioners and other technical occupations
79,659Business and financial operations occupations
66,235Management occupations
61,064Building and grounds cleaning and maintenance occupations
60,701Installation, maintenance, and repair occupations
Companies with federal contracts located in this zip code:
CHARLES ABERNATHY (1650 S FRANKLIN LOCK RD in ALVA, FL; small business) : $44,000 in 5 contractsfrom 2004 to 2005
Contracts for Other Housekeeping Services by Army, U.S. Army Corps of Engineers - civil program financing only Signed by year:2000: $0; 2001: $0; 2002: $0; 2003: $0; 2004: $4,400; 2005: $39,600; 2006: $0.
Biggest contracts:
$17,600 with Army for Other Housekeeping Services. Signed on 2005-03-03. Completion date: 2005-09-30.
$17,600 with U.S. Army Corps of Engineers - civil program financing only for Other Housekeeping Services. Signed on 2005-03-03. Completion date: 2005-09-30.
$4,400, same as above.Signed on 2005-01-13. Completion date: 2005-09-30.
$2,200, same as above.Signed on 2004-11-05. Completion date: 2005-09-30.
DORIS M MITCHELL (1991 BROWN ROAD in ALVA, FL; small business) : $23,160 in 4 contractsfrom 2000 to 2001
$11,772 with U.S. Army Corps of Engineers - civil program financing only for Guard Services. Signed on 2001-10-18. Completion date: 2002-09-30.
$11,388, same as above.Signed on 2000-10-18. Completion date: 2001-09-30.
$0, same as above.Signed on 2001-10-18. Completion date: 2002-09-30.
$0, same as above.Signed on 2000-10-18. Completion date: 2001-09-30.
PRO MED INSTRUMENTS INC (1899 SAWYER LN in ALVA, FL)
$16,116 with Navy for Medical and Surgical Instruments, Equipment, and Supplies. Signed on 2006-02-16. Completion date: 2006-02-17.
Top industries in this zip code by the number of employees in 2005:
2003 - 2018 National Fire Incident Reporting System (NFIRS) incidents
According to the data from the years 2003 - 2018 the average number of fire incidents per year is 42. The highest number of fires - 64 took place in 2006, and the least - 7 in 2004. The data has a growing trend.
When looking into fire subcategories, the most incidents belonged to: Outside Fires (76.6%), and Mobile Property/Vehicle Fires (11.7%).
Fire incident types reported to NFIRS in Zip Code 33920


 Nearest zip codes: 33972, 33971, 33936, 33905, 33976, 33973.
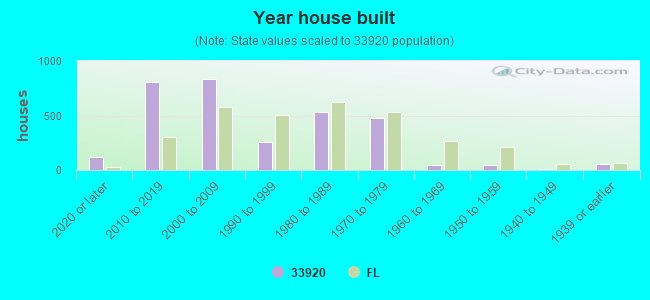


 According to the data from the years 2003 - 2018 the average number of fire incidents per year is 42. The highest number of fires - 64 took place in 2006, and the least - 7 in 2004. The data has a growing trend.
 When looking into fire subcategories, the most incidents belonged to: Outside Fires (76.6%), and Mobile Property/Vehicle Fires (11.7%).