Estimated zip code population in 2022: 47,072 Zip code population in 2010: 37,315 Zip code population in 2000: 25,133
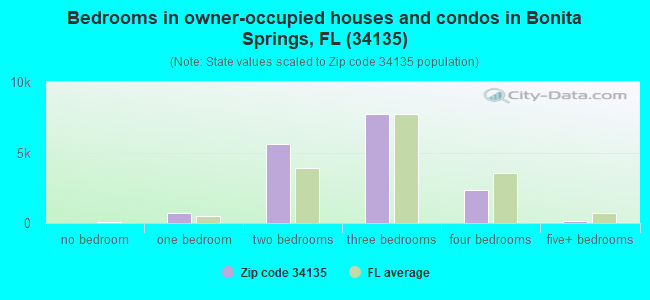
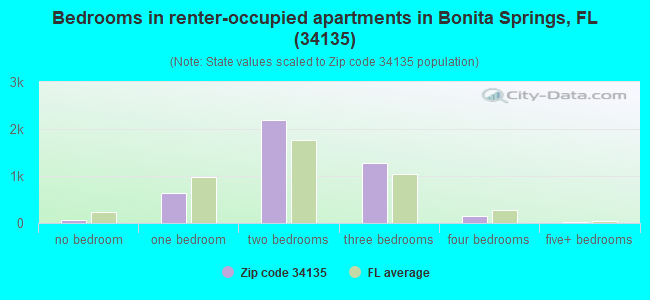
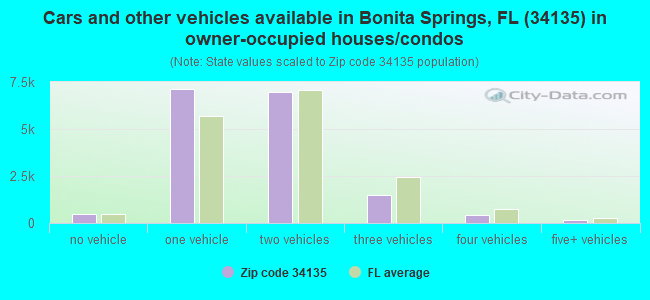
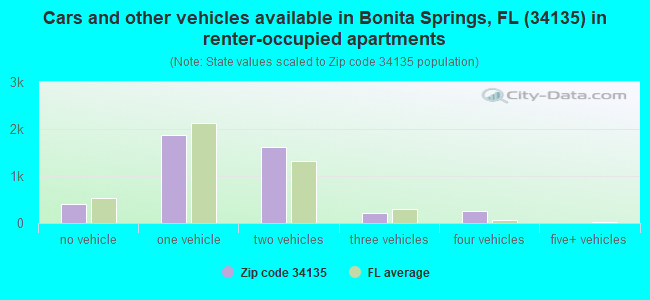
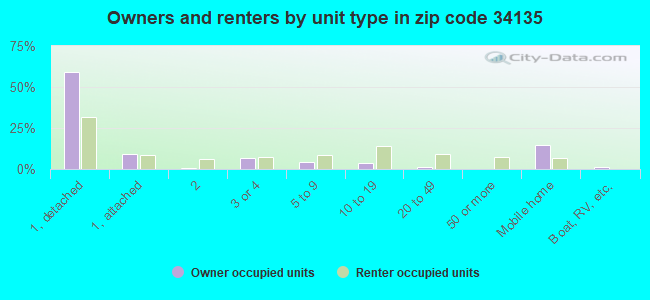
Houses and condos: 30,805 Renter-occupied apartments: 4,356
% of renters here:
21%
State:
33%
March 2022 cost of living index in zip code 34135: 93.7 (less than average, U.S. average is 100)
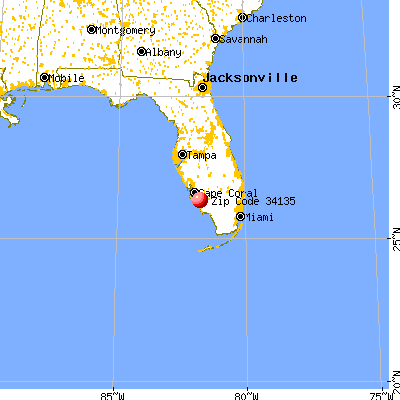
Land area: 36.6 sq. mi. Water area: 1.3 sq. mi.
Population density: 1,286 people per square mile
(low).
OSM Map
General Map
Google Map
MSN Map
OSM Map
General Map
Google Map
MSN Map
OSM Map
General Map
Google Map
MSN Map
OSM Map
General Map
Google Map
MSN Map
Please wait while loading the map...
Real estate property taxes paid for housing units in 2022:
This zip code:
0.8% ($3,622)
Florida:
0.7% ($2,529)
Median real estate property taxes paid for housing units with mortgages in 2022: $3,661 (0.7%) Median real estate property taxes paid for housing units with no mortgage in 2022: $3,578 (0.8%)
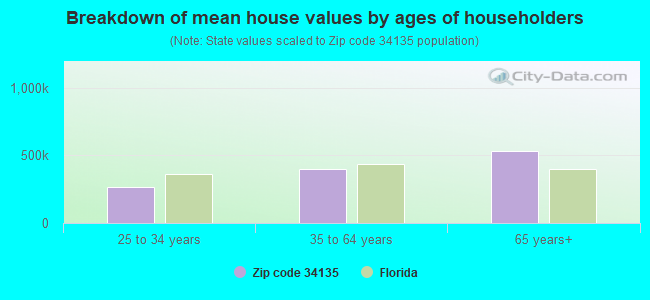
Estimated median house/condo value in 2022: $461,227
34135:
$461,227
Florida:
$354,100
According to our research of Florida and other state lists, there were 25 registered sex offenders living in 34135 zip code as of April 27, 2024. The ratio of all residents to sex offenders in zip code 34135 is 1,728 to 1. The ratio of registered sex offenders to all residents in this zip code is much lower than the state average.
Median resident age:
This zip code:
57.4 years
Florida median age:
42.7 years
Average household size:
This zip code:
2.3 people
Florida:
2.5 people
Averages for the 2020 tax year for zip code 34135, filed in 2021:
Average Adjusted Gross Income (AGI) in 2020: $111,809 (Individual Income Tax Returns)
Here:
$111,809
State:
$82,200
Salary/wage: $64,888 (reported on 66.1% of returns)
Here:
$64,888
State:
$58,347
(% of AGI for various income ranges: 1257.0% for AGIs below $25k, 3600.4% for AGIs $25k-50k, 6015.7% for AGIs $50k-75k, 7481.3% for AGIs $75k-100k, 11469.5% for AGIs $100k-200k, 78367.0% for AGIs over 200k)
Taxable interest for individuals: $4,187 (reported on 43.0% of returns)
This zip code:
$4,187
Florida:
$4,272
(% of AGI for various income ranges: 37.9% for AGIs below $25k, 50.4% for AGIs $25k-50k, 121.4% for AGIs $50k-75k, 227.6% for AGIs $75k-100k, 489.0% for AGIs $100k-200k, 4835.0% for AGIs over 200k)
Ordinary dividends: $18,645 (reported on 36.3% of returns)
Here:
$18,645
State:
$15,863
(% of AGI for various income ranges: 75.4% for AGIs below $25k, 129.6% for AGIs $25k-50k, 301.9% for AGIs $50k-75k, 711.9% for AGIs $75k-100k, 1680.0% for AGIs $100k-200k, 20699.4% for AGIs over 200k)
Net capital gain/loss in AGI: +$47,690 (reported on 35.0% of returns)
Here:
+$47,690
State:
+$62,983
(% of AGI for various income ranges: 30.7% for AGIs below $25k, 61.0% for AGIs $25k-50k, 266.9% for AGIs $50k-75k, 577.2% for AGIs $75k-100k, 1921.8% for AGIs $100k-200k, 67161.2% for AGIs over 200k)
Profit/loss from business: +$17,026 (reported on 17.3% of returns)
Here:
+$17,026
State:
+$9,719
(% of AGI for various income ranges: 184.4% for AGIs below $25k, 195.6% for AGIs $25k-50k, 229.3% for AGIs $50k-75k, 346.2% for AGIs $75k-100k, 844.2% for AGIs $100k-200k, 5923.0% for AGIs over 200k)
Taxable individual retirement arrangement distribution: $37,277 (reported on 21.9% of returns)
34135:
$37,277
Florida:
$24,823
(% of AGI for various income ranges: 113.6% for AGIs below $25k, 236.8% for AGIs $25k-50k, 581.7% for AGIs $50k-75k, 1448.7% for AGIs $75k-100k, 3463.2% for AGIs $100k-200k, 16562.2% for AGIs over 200k)
Self-employed (Keogh) retirement plans: $26,043 (reported on 0.9% of returns)
34135:
$26,043
Florida:
$29,694
(% of AGI for various income ranges: 19.6% for AGIs $50k-75k, 65.7% for AGIs $100k-200k, 768.2% for AGIs over 200k)
Total itemized deductions: $41,170 (reported on 12.6% of returns)
Here:
$41,170
State:
$45,393
(% of AGI for various income ranges: 106.4% for AGIs below $25k, 206.9% for AGIs $25k-50k, 517.1% for AGIs $50k-75k, 820.2% for AGIs $75k-100k, 1491.1% for AGIs $100k-200k, 12073.8% for AGIs over 200k)
Charity contributions: $16,836 (reported on 10.8% of returns)
Here:
$16,836
State:
$20,178
(% of AGI for various income ranges: 6.8% for AGIs below $25k, 18.0% for AGIs $25k-50k, 62.4% for AGIs $50k-75k, 126.0% for AGIs $75k-100k, 306.3% for AGIs $100k-200k, 6528.2% for AGIs over 200k)
Taxes paid: $7,470 (reported on 12.4% of returns)
34135:
$7,470
State:
$6,967
(% of AGI for various income ranges: 19.8% for AGIs below $25k, 35.6% for AGIs $25k-50k, 94.7% for AGIs $50k-75k, 186.1% for AGIs $75k-100k, 351.7% for AGIs $100k-200k, 1756.4% for AGIs over 200k)
Earned income credit: $2,256 (reported on 10.3% of returns)
Here:
$2,256
State:
$2,306
(% of AGI for various income ranges: 87.2% for AGIs below $25k, 55.8% for AGIs $25k-50k, 1.0% for AGIs $50k-75k)
Percentage of individuals using paid preparers for their 2020 taxes: 90.3%
Here:
90%
State:
92%
(% for various income ranges: 87.6% for AGIs below $25k, 89.6% for AGIs $25k-50k, 91.1% for AGIs $50k-75k, 92.0% for AGIs $75k-100k, 92.3% for AGIs $100k-200k, 92.5% for AGIs over 200k)
Averages for the 2012 tax year for zip code 34135, filed in 2013:
Average Adjusted Gross Income (AGI) in 2012: $95,610 (Individual Income Tax Returns)
Here:
$95,610
State:
$60,316
Salary/wage: $54,603 (reported on 70.2% of returns)
Here:
$54,603
State:
$45,277
(% of AGI for various income ranges: 72.5% for AGIs below $25k, 70.1% for AGIs $25k-50k, 55.1% for AGIs $50k-75k, 44.5% for AGIs $75k-100k, 35.8% for AGIs $100k-200k, 30.4% for AGIs over 200k)
Taxable interest for individuals: $4,545 (reported on 41.2% of returns)
This zip code:
$4,545
Florida:
$3,587
(% of AGI for various income ranges: 1.9% for AGIs below $25k, 1.2% for AGIs $25k-50k, 1.4% for AGIs $50k-75k, 1.9% for AGIs $75k-100k, 2.1% for AGIs $100k-200k, 2.1% for AGIs over 200k)
Ordinary dividends: $17,184 (reported on 32.5% of returns)
Here:
$17,184
State:
$12,831
(% of AGI for various income ranges: 3.1% for AGIs below $25k, 2.4% for AGIs $25k-50k, 3.6% for AGIs $50k-75k, 4.6% for AGIs $75k-100k, 6.6% for AGIs $100k-200k, 7.0% for AGIs over 200k)
Net capital gain/loss in AGI: +$51,714 (reported on 29.5% of returns)
Here:
+$51,714
State:
+$33,493
(% of AGI for various income ranges: 0.6% for AGIs $25k-50k, 0.8% for AGIs $50k-75k, 1.4% for AGIs $75k-100k, 3.9% for AGIs $100k-200k, 29.0% for AGIs over 200k)
Profit/loss from business: +$19,750 (reported on 16.5% of returns)
Here:
+$19,750
State:
+$10,012
(% of AGI for various income ranges: 8.4% for AGIs below $25k, 3.2% for AGIs $25k-50k, 3.0% for AGIs $50k-75k, 2.7% for AGIs $75k-100k, 3.0% for AGIs $100k-200k, 3.3% for AGIs over 200k)
Taxable individual retirement arrangement distribution: $34,987 (reported on 22.5% of returns)
34135:
$34,987
Florida:
$21,544
(% of AGI for various income ranges: 5.3% for AGIs below $25k, 5.0% for AGIs $25k-50k, 7.1% for AGIs $50k-75k, 9.8% for AGIs $75k-100k, 13.3% for AGIs $100k-200k, 7.3% for AGIs over 200k)
Self-employment retirement plans: $23,794 (reported on 1.0% of returns)
34135:
$23,794
Florida:
$20,611
(% of AGI for various income ranges: 0.3% for AGIs $50k-75k, 0.3% for AGIs $100k-200k, 0.3% for AGIs over 200k)
Total itemized deductions: $30,478 (15% of AGI, reported on 35.7% of returns)
Here:
$30,478
State:
$25,533
Here:
15.2% of AGI
State:
18.0% of AGI
(% of AGI for various income ranges: 14.0% for AGIs below $25k, 11.8% for AGIs $25k-50k, 13.6% for AGIs $50k-75k, 15.0% for AGIs $75k-100k, 15.6% for AGIs $100k-200k, 8.6% for AGIs over 200k)
Charity contributions: $5,846 (reported on 30.7% of returns)
Here:
$5,846
State:
$5,698
(% of AGI for various income ranges: 0.8% for AGIs below $25k, 1.1% for AGIs $25k-50k, 1.4% for AGIs $50k-75k, 1.9% for AGIs $75k-100k, 2.2% for AGIs $100k-200k, 2.1% for AGIs over 200k)
Taxes paid: $11,195 (reported on 35.0% of returns)
34135:
$11,195
State:
$6,203
(% of AGI for various income ranges: 2.8% for AGIs below $25k, 2.5% for AGIs $25k-50k, 3.3% for AGIs $50k-75k, 4.3% for AGIs $75k-100k, 5.4% for AGIs $100k-200k, 4.1% for AGIs over 200k)
Earned income credit: $2,238 (reported on 12.7% of returns)
Here:
$2,238
State:
$2,372
(% of AGI for various income ranges: 4.6% for AGIs below $25k, 0.8% for AGIs $25k-50k)
Percentage of individuals using paid preparers for their 2012 taxes: 58.5%
Here:
59%
State:
54%
(% for various income ranges: 53.0% for AGIs below $25k, 55.6% for AGIs $25k-50k, 58.8% for AGIs $50k-75k, 60.3% for AGIs $75k-100k, 65.4% for AGIs $100k-200k, 83.8% for AGIs over 200k)
Averages for the 2004 tax year for zip code 34135, filed in 2005:
Average Adjusted Gross Income (AGI) in 2004: $73,994 (Individual Income Tax Returns)
Here:
$73,994
State:
$50,523
Salary/wage: $49,110 (reported on 73.7% of returns)
Here:
$49,110
State:
$39,563
(% of AGI for various income ranges: 69.3% for AGIs $10k-25k, 70.7% for AGIs $25k-50k, 59.3% for AGIs $50k-75k, 49.0% for AGIs $75k-100k, 38.8% for AGIs over 100k)
Taxable interest for individuals: $4,191 (reported on 52.0% of returns)
This zip code:
$4,191
Florida:
$3,211
(% of AGI for various income ranges: 3.9% for AGIs $10k-25k, 2.4% for AGIs $25k-50k, 2.6% for AGIs $50k-75k, 3.6% for AGIs $75k-100k, 2.7% for AGIs over 100k)
Taxable dividends: $8,355 (reported on 36.0% of returns)
Here:
$8,355
State:
$6,129
(% of AGI for various income ranges: 2.9% for AGIs $10k-25k, 2.4% for AGIs $25k-50k, 2.7% for AGIs $50k-75k, 3.7% for AGIs $75k-100k, 4.6% for AGIs over 100k)
Net capital gain/loss: +$31,011 (reported on 33.2% of returns)
Here:
+$31,011
State:
+$27,205
(% of AGI for various income ranges: 0.4% for AGIs $10k-25k, 1.2% for AGIs $25k-50k, 2.0% for AGIs $50k-75k, 3.7% for AGIs $75k-100k, 21.4% for AGIs over 100k)
Profit/loss from business: +$15,824 (reported on 15.3% of returns)
Here:
+$15,824
State:
+$10,634
(% of AGI for various income ranges: 6.4% for AGIs $10k-25k, 4.1% for AGIs $25k-50k, 2.9% for AGIs $50k-75k, 3.2% for AGIs $75k-100k, 2.6% for AGIs over 100k)
IRA payment deduction: $3,363 (reported on 3.3% of returns)
34135:
$3,363
Florida:
$3,082
(% of AGI for various income ranges: 0.2% for AGIs $10k-25k, 0.3% for AGIs $25k-50k, 0.2% for AGIs $50k-75k, 0.2% for AGIs $75k-100k, 0.1% for AGIs over 100k)
Self-employed pension: $20,807 (reported on 1.2% of returns)
Here:
$20,807
Florida:
$15,857
(% of AGI for various income ranges: 0.1% for AGIs $10k-25k, 0.1% for AGIs $25k-50k, 0.1% for AGIs $50k-75k, 0.2% for AGIs $75k-100k, 0.4% for AGIs over 100k)
Total itemized deductions: $23,404 (18% of AGI, reported on 42.4% of returns)
Here:
$23,404
State:
$20,370
Here:
18.2% of AGI
State:
20.7% of AGI
(% of AGI for various income ranges: 15.5% for AGIs $10k-25k, 20.4% for AGIs $25k-50k, 18.0% for AGIs $50k-75k, 17.0% for AGIs $75k-100k, 9.8% for AGIs over 100k)
Charity contributions deductions: $3,621 (3% of AGI, reported on 36.2% of returns)
Here:
$3,621
State:
$4,064
Here:
2.6% of AGI
State:
3.8% of AGI
(% of AGI for various income ranges: 1.2% for AGIs $10k-25k, 1.5% for AGIs $25k-50k, 2.0% for AGIs $50k-75k, 2.2% for AGIs $75k-100k, 1.8% for AGIs over 100k)
Total tax: $15,762 (reported on 78.6% of returns)
34135:
$15,762
State:
$9,431
(% of AGI for various income ranges: 4.1% for AGIs $10k-25k, 7.1% for AGIs $25k-50k, 9.3% for AGIs $50k-75k, 10.9% for AGIs $75k-100k, 22.0% for AGIs over 100k)
Earned income credit: $1,629 (reported on 10.4% of returns)
Here:
$1,629
State:
$1,808
Percentage of individuals using paid preparers for their 2004 taxes: 62.0%
Here:
62%
State:
60%
(% for various income ranges: 55.3% for AGIs below $10k, 59.5% for AGIs $10k-25k, 58.6% for AGIs $25k-50k, 62.6% for AGIs $50k-75k, 65.9% for AGIs $75k-100k, 77.9% for AGIs over 100k)
Likely homosexual households (counted as self-reported same-sex unmarried-partner households)
Lesbian couples: 0.0% of all households
Gay men: 0.2% of all households
Household received Food Stamps/SNAP in the past 12 months: 1,051 Household did not receive Food Stamps/SNAP in the past 12 months: 19,981
Women who had a birth in the past 12 months: 287 (199 now married, 88 unmarried) Women who did not have a birth in the past 12 months: 6,400 (3,024 now married, 3,378 unmarried)
Housing units in zip code 34135 with a mortgage: 7,318 (561 second mortgage, 497 both second mortgage and home equity loan) Houses without a mortgage: 173
Median monthly owner costs for units with a mortgage: $2,079 Median monthly owner costs for units without a mortgage: $720
Residents with income below the poverty level in 2022:
This zip code:
8.4%
Whole state:
12.7%
Residents with income below 50% of the poverty level in 2022:
This zip code:
4.4%
Whole state:
6.6%
Median number of rooms in houses and condos:
Here:
5.4
State:
5.9
Median number of rooms in apartments:
Here:
4.4
State:
4.2
Notable locations in this zip code not listed on our city pages
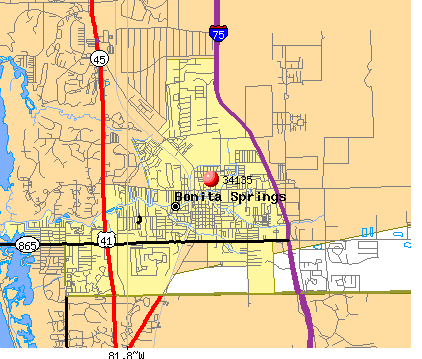
Notable locations in zip code 34135: Boca Lago Golf Course (A), Boca Grove Plantation Golf Course (B), Boca Greens Country Club (C), Boca Dunes Golf and Country Club (D), Boca del Mar Country Club (E), Bluffs Golf Course (F), Blue Heron Pines Golf Course (G), Black Bear Golf Club (H), Bonita Springs Fire Control and Rescue District Station 1 (I), Bonita Springs Fire Control and Rescue District Station 3 (J), Bonita Springs Fire Control and Rescue District Station 4 (K), Lee County Emergency Medical Services Station 13 (L), Lee County Emergency Medical Services Station 6 (M), Lee County Sheriff's Office Delta South District (N), Lee County Sheriff's Office Bonita Community Policing Annex (O), Bonita Spring Historical Society (P), Bonita Springs Public Library (Q), Bonita Community Center (R). Display/hide their locations on the map
Churches in zip code 34135 include: Saint Marys Episcopal Church (A), Living Water Community Church (B), Hope Lutheran Church (C), Harvest Church (D), Community Apostolic Church (E), Bonita Springs Seventh Day Adventist Church (F), Anchor Christian Church (G), Lighthouse Fellowship Chapel (H), Seventh Day Adventist Church of Bonita Springs (I). Display/hide their locations on the map
4,409 married couples with children.
1,125 single-parent households (350 men, 775 women).
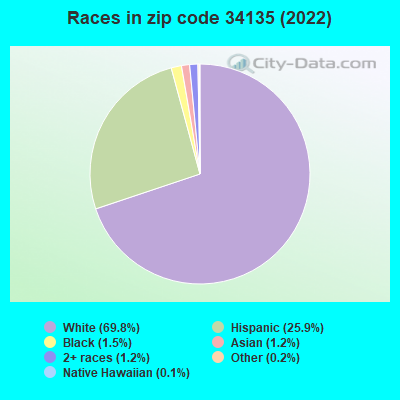
75.0% of residents of 34135 zip code speak English at home.
21.2% of residents speak Spanish at home (47% very well, 12% well, 16% not well, 25% not at all).
3.7% of residents speak other Indo-European language at home (65% very well, 17% well, 6% not well, 13% not at all).
1.0% of residents speak Asian or Pacific Island language at home (61% very well, 33% well, 6% not well).
0.2% of residents speak other language at home (52% very well, 48% well).
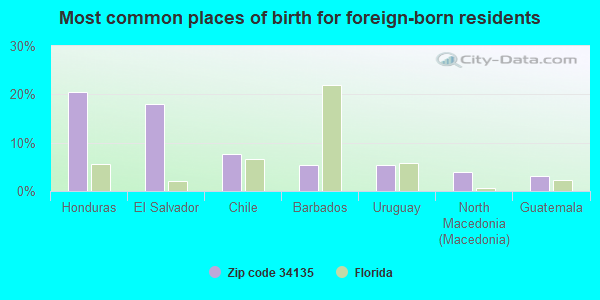
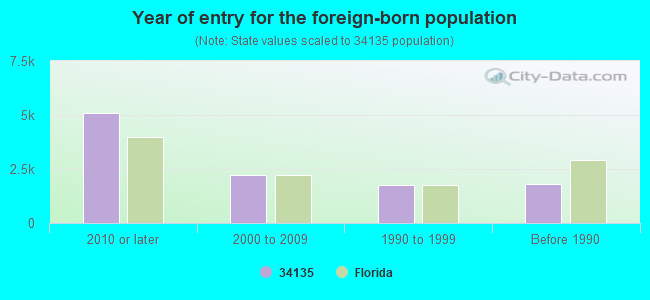
Foreign born population: 10,108 (21.5%) (35.5% of them are naturalized citizens)
Major facilities with environmental interests located in this zip code:
OTT WELDING (24241 PRODUCTION CIR in BONITA SPGS, FL)
STATE MASTER (FDM) - WAFR-FLR05F851, NPDES STORMWATER PROGRAM, NPDES STORMWATER PERMIT National Pollutant Discharge Elimination System NON-MAJOR (Tracking pollutant discharge elimination systems) - permit Business SIC classification: FABRICATED STRUCTURAL METAL Organizations: PB DULIN CORP OF FLA INC DBA OTT WELDING (CONTACT/APPLICANT)
, PATRICK DULIN (CONTACT/OWNER)
Alternative names: PB DULIN CORP OF FLA, INC DBA, PB DULIN CORP OF FLA, INC DBA
SPRING CREEK ELEMENTARY SCHOOL (25571 ELEMENTARY WAY in BONITA SPRINGS, FL)
(Geographic Names Information System) (National Center for Education Statistics) - STATE ID-0681 Organizations: LEE COUNTY SCHOOL DISTRICT (SCHOOL DISTRICT)
CIRCLE K #7312 (10530 ROSEMARY DR in BONITA SPRINGS, FL)
National Pollutant Discharge Elimination System NON-MAJOR (Tracking pollutant discharge elimination systems) - permit (Resource Conservation and Recovery Act (tracking hazardous waste)) Business SIC classification: GASOLINE SERVICE STATIONS Organizations: STEVE BELIN, COMPLIANCE MGR (CONTACT/OWNER)
MEADOWBROOK OF BONITA SPRINGS (COCONUT RD in BONITA SPRINGS, FL)
National Pollutant Discharge Elimination System NON-MAJOR (Tracking pollutant discharge elimination systems) - permit National Pollutant Discharge Elimination System NON-MAJOR (Tracking pollutant discharge elimination systems) - permit Alternative names: JOHN C MALPELI JR
SAN REMO AT PALMIRA (APPROX. 2.5 MILES EAST OF I-75 in BONITA SPRINGS, FL)
National Pollutant Discharge Elimination System NON-MAJOR (Tracking pollutant discharge elimination systems) - permit Organizations: MICHAEL ROSEN (CONTACT/OWNER)
AMSOUTH BANK BONITA SPRINGS (12759 BONITA BCH RD SE in BONITA SPGS, FL)
National Pollutant Discharge Elimination System NON-MAJOR (Tracking pollutant discharge elimination systems) - permit Organizations: GREGORY HARRIS (CONTACT/OWNER)
PARKLANDS WEST (1.7 +- MILES EAST OF I-75 ONBO in BONITA SPRINGS, FL)
National Pollutant Discharge Elimination System NON-MAJOR (Tracking pollutant discharge elimination systems) - permit Organizations: DAVID UNDERHILL (CONTACT/OWNER)
NEVADA STREET DRAINAGE AREA IM (NEVADA ST. in BONITA SPRINGS, FL)
National Pollutant Discharge Elimination System NON-MAJOR (Tracking pollutant discharge elimination systems) - permit Organizations: DARYL WALK (CONTACT/OWNER)
MATHESON AVENUE SIDEWALK IMPRO (MATHESON AVE in BONITA SPGS, FL)
National Pollutant Discharge Elimination System NON-MAJOR (Tracking pollutant discharge elimination systems) - permit Organizations: DARYL WALK (CONTACT/OWNER)
HAWTHORNE (RIVER ROCK BLVD/YORKSTONE DR in BONITA SPGS, FL)
National Pollutant Discharge Elimination System NON-MAJOR (Tracking pollutant discharge elimination systems) - permit Organizations: THOMAS WEGWERT (CONTACT/OWNER)
National Pollutant Discharge Elimination System NON-MAJOR (Tracking pollutant discharge elimination systems) - permit Organizations: JAYSON KMIEC (CONTACT/OWNER)
PENNSYLVANIA AVENUE SIDEWALK I (PENNSYLVANIA AVENUE in BONITA SPRINGS, FL)
National Pollutant Discharge Elimination System NON-MAJOR (Tracking pollutant discharge elimination systems) - permit Organizations: DARYL WALK (CONTACT/OWNER)
Housing units lacking complete plumbing facilities: 0.1% Housing units lacking complete kitchen facilities: 0.8%
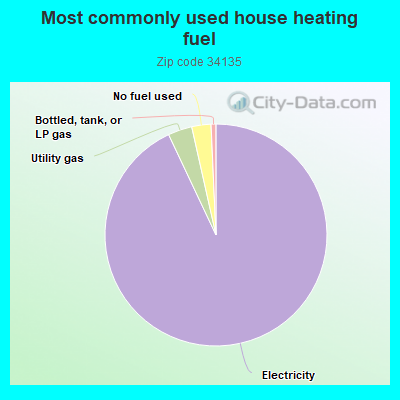
92.8%Electricity
3.5%Utility gas
2.8%No fuel used
0.7%Bottled, tank, or LP gas
Place of birth for U.S.-born residents:
This state: 7,285
Northeast: 12,316
Midwest: 12,278
South: 3,648
West: 1,089
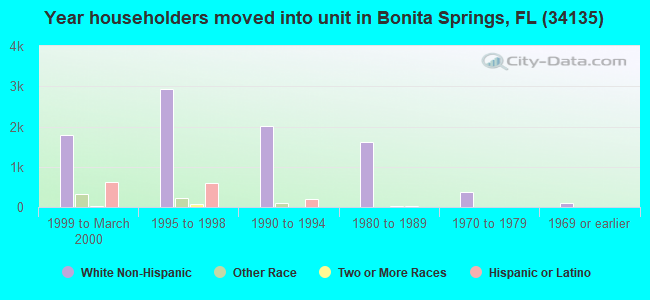
49% of the 34135 zip code residents lived in the same house 5 years ago. Out of people who lived in different houses, 35% lived in this county. Out of people who lived in different counties, 50% lived in Florida.
86% of the 34135 zip code residents lived in the same house 1 year ago. Out of people who lived in different houses, 31% moved from this county. Out of people who lived in different houses, 12% moved from different county within same state. Out of people who lived in different houses, 51% moved from different state. Out of people who lived in different houses, 11% moved from abroad.
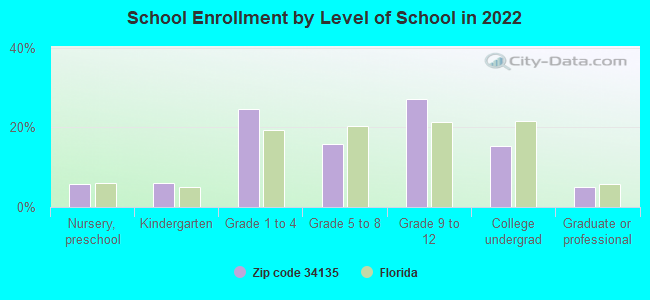
Private vs. public school enrollment:
Students in private schools in grades 1 to 8 (elementary and middle school): 315
Here:
12.4%
Florida:
15.8%
Students in private schools in grades 9 to 12 (high school): 120
Here:
7.1%
Florida:
12.9%
Students in private undergraduate colleges: 160
Here:
16.7%
Florida:
23.6%
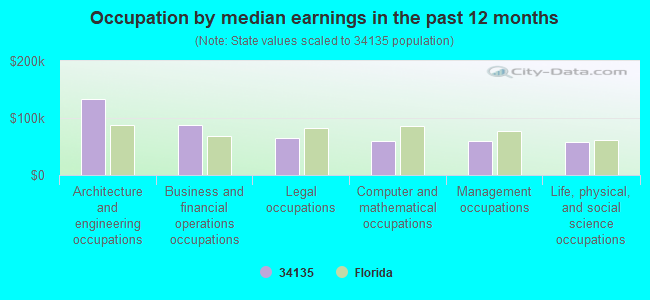
Occupation by median earnings in the past 12 months ($)
134,201Architecture and engineering occupations
88,017Business and financial operations occupations
64,335Legal occupations
59,802Computer and mathematical occupations
59,167Management occupations
58,071Life, physical, and social science occupations
Companies with federal contracts located in this zip code:
THOMAS C & BEVERLY A SHERMAN (12325 CASALS LANE in BONITA SPRINGS, FL; small business) : $2,288 in 2 contractsin 2002
$2,068 with U.S. Army Corps of Engineers - civil program financing only for Facilities Operations Support Services. Taking place in MA. Signed on 2002-01-11. Completion date: 2002-07-13.
$220, same as above.Signed on 2002-06-25. Completion date: 2002-07-13.
Top industries in this zip code by the number of employees in 2005:
2002 - 2018 National Fire Incident Reporting System (NFIRS) incidents
Based on the data from the years 2002 - 2018 the average number of fire incidents per year is 114. The highest number of reported fire incidents - 169 took place in 2007, and the least - 65 in 2004. The data has a declining trend.
When looking into fire subcategories, the most incidents belonged to: Outside Fires (53.0%), and Structure Fires (24.1%).
Fire incident types reported to NFIRS in Zip Code 34135


 Nearest zip codes: 34110, 33928, 34134, 34119, 33965, 34109.


 Based on the data from the years 2002 - 2018 the average number of fire incidents per year is 114. The highest number of reported fire incidents - 169 took place in 2007, and the least - 65 in 2004. The data has a declining trend.
 When looking into fire subcategories, the most incidents belonged to: Outside Fires (53.0%), and Structure Fires (24.1%).