Estimated zip code population in 2022: 34,990 Zip code population in 2010: 31,268 Zip code population in 2000: 34,025
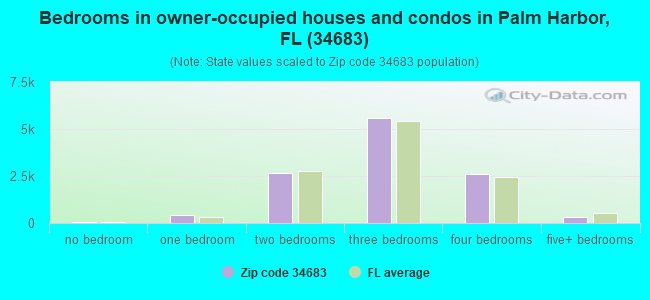
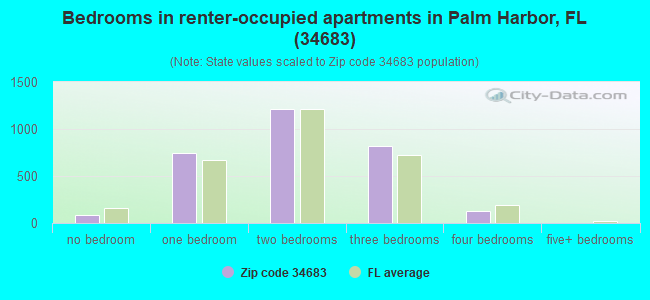
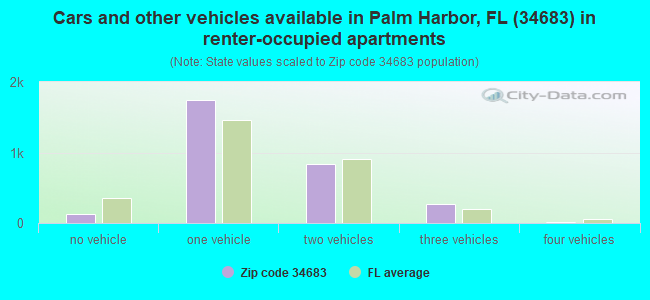
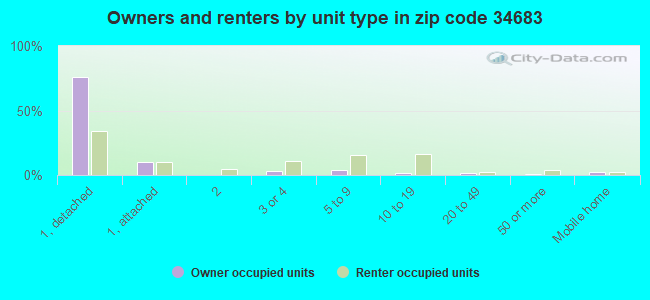
Houses and condos: 16,139 Renter-occupied apartments: 2,990
% of renters here:
20%
State:
33%
March 2022 cost of living index in zip code 34683: 99.1 (near average, U.S. average is 100)
Land area: 10.5 sq. mi. Water area: 1.4 sq. mi.
Population density: 3,320 people per square mile
(average).
OSM Map
General Map
Google Map
MSN Map
OSM Map
General Map
Google Map
MSN Map
OSM Map
General Map
Google Map
MSN Map
OSM Map
General Map
Google Map
MSN Map
Please wait while loading the map...
Real estate property taxes paid for housing units in 2022:
This zip code:
0.7% ($2,943)
Florida:
0.7% ($2,529)
Median real estate property taxes paid for housing units with mortgages in 2022: $3,112 (0.7%) Median real estate property taxes paid for housing units with no mortgage in 2022: $2,566 (0.6%)
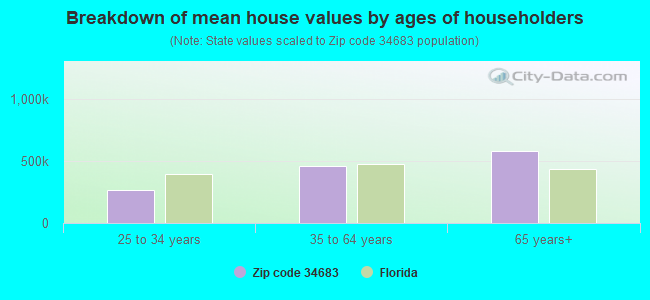
Estimated median house/condo value in 2022: $451,896
34683:
$451,896
Florida:
$354,100
According to our research of Florida and other state lists, there were 18 registered sex offenders living in 34683 zip code as of April 26, 2024. The ratio of all residents to sex offenders in zip code 34683 is 1,820 to 1. The ratio of registered sex offenders to all residents in this zip code is much lower than the state average.
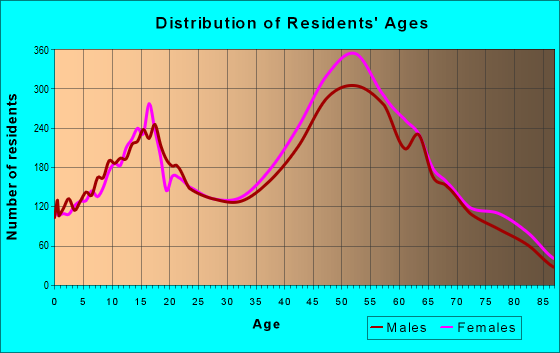
Median resident age:
This zip code:
47.8 years
Florida median age:
42.7 years
Average household size:
This zip code:
2.4 people
Florida:
2.5 people
Averages for the 2020 tax year for zip code 34683, filed in 2021:
Average Adjusted Gross Income (AGI) in 2020: $99,346 (Individual Income Tax Returns)
Here:
$99,346
State:
$82,200
Salary/wage: $75,060 (reported on 79.0% of returns)
Here:
$75,060
State:
$58,347
(% of AGI for various income ranges: 1218.7% for AGIs below $25k, 3619.7% for AGIs $25k-50k, 6392.5% for AGIs $50k-75k, 9547.4% for AGIs $75k-100k, 18583.1% for AGIs $100k-200k, 75377.7% for AGIs over 200k)
Taxable interest for individuals: $2,519 (reported on 34.3% of returns)
This zip code:
$2,519
Florida:
$4,272
(% of AGI for various income ranges: 29.9% for AGIs below $25k, 37.2% for AGIs $25k-50k, 73.5% for AGIs $50k-75k, 105.0% for AGIs $75k-100k, 155.3% for AGIs $100k-200k, 1709.5% for AGIs over 200k)
Ordinary dividends: $8,224 (reported on 27.7% of returns)
Here:
$8,224
State:
$15,863
(% of AGI for various income ranges: 52.8% for AGIs below $25k, 74.3% for AGIs $25k-50k, 160.1% for AGIs $50k-75k, 271.5% for AGIs $75k-100k, 434.8% for AGIs $100k-200k, 4860.5% for AGIs over 200k)
Net capital gain/loss in AGI: +$37,589 (reported on 25.9% of returns)
Here:
+$37,589
State:
+$62,983
(% of AGI for various income ranges: 22.4% for AGIs below $25k, 63.3% for AGIs $25k-50k, 133.2% for AGIs $50k-75k, 338.7% for AGIs $75k-100k, 684.2% for AGIs $100k-200k, 32011.8% for AGIs over 200k)
Profit/loss from business: +$13,941 (reported on 16.6% of returns)
Here:
+$13,941
State:
+$9,719
(% of AGI for various income ranges: 165.6% for AGIs below $25k, 162.3% for AGIs $25k-50k, 196.3% for AGIs $50k-75k, 292.2% for AGIs $75k-100k, 649.1% for AGIs $100k-200k, 2672.0% for AGIs over 200k)
Taxable individual retirement arrangement distribution: $22,391 (reported on 12.1% of returns)
34683:
$22,391
Florida:
$24,823
(% of AGI for various income ranges: 80.9% for AGIs below $25k, 170.9% for AGIs $25k-50k, 298.5% for AGIs $50k-75k, 531.0% for AGIs $75k-100k, 906.6% for AGIs $100k-200k, 2733.4% for AGIs over 200k)
Self-employed (Keogh) retirement plans: $25,789 (reported on 0.5% of returns)
34683:
$25,789
Florida:
$29,694
(% of AGI for various income ranges: 36.4% for AGIs $100k-200k, 383.4% for AGIs over 200k)
Total itemized deductions: $40,513 (reported on 8.8% of returns)
Here:
$40,513
State:
$45,393
(% of AGI for various income ranges: 77.3% for AGIs below $25k, 120.8% for AGIs $25k-50k, 257.6% for AGIs $50k-75k, 444.4% for AGIs $75k-100k, 743.6% for AGIs $100k-200k, 7345.9% for AGIs over 200k)
Charity contributions: $14,973 (reported on 7.1% of returns)
Here:
$14,973
State:
$20,178
(% of AGI for various income ranges: 5.4% for AGIs below $25k, 14.7% for AGIs $25k-50k, 34.4% for AGIs $50k-75k, 87.5% for AGIs $75k-100k, 154.5% for AGIs $100k-200k, 2927.3% for AGIs over 200k)
Taxes paid: $7,106 (reported on 8.7% of returns)
34683:
$7,106
State:
$6,967
(% of AGI for various income ranges: 10.5% for AGIs below $25k, 22.1% for AGIs $25k-50k, 53.2% for AGIs $50k-75k, 97.5% for AGIs $75k-100k, 170.3% for AGIs $100k-200k, 1040.9% for AGIs over 200k)
Earned income credit: $1,812 (reported on 9.8% of returns)
Here:
$1,812
State:
$2,306
(% of AGI for various income ranges: 60.6% for AGIs below $25k, 41.9% for AGIs $25k-50k, 0.8% for AGIs $50k-75k)
Percentage of individuals using paid preparers for their 2020 taxes: 91.9%
Here:
92%
State:
92%
(% for various income ranges: 90.4% for AGIs below $25k, 92.5% for AGIs $25k-50k, 91.8% for AGIs $50k-75k, 91.9% for AGIs $75k-100k, 92.6% for AGIs $100k-200k, 93.7% for AGIs over 200k)
Averages for the 2012 tax year for zip code 34683, filed in 2013:
Average Adjusted Gross Income (AGI) in 2012: $67,779 (Individual Income Tax Returns)
Here:
$67,779
State:
$60,316
Salary/wage: $56,872 (reported on 81.3% of returns)
Here:
$56,872
State:
$45,277
(% of AGI for various income ranges: 72.0% for AGIs below $25k, 76.4% for AGIs $25k-50k, 72.8% for AGIs $50k-75k, 74.6% for AGIs $75k-100k, 76.2% for AGIs $100k-200k, 51.8% for AGIs over 200k)
Taxable interest for individuals: $2,110 (reported on 37.4% of returns)
This zip code:
$2,110
Florida:
$3,587
(% of AGI for various income ranges: 2.0% for AGIs below $25k, 1.2% for AGIs $25k-50k, 0.9% for AGIs $50k-75k, 1.0% for AGIs $75k-100k, 0.9% for AGIs $100k-200k, 1.5% for AGIs over 200k)
Ordinary dividends: $5,781 (reported on 25.8% of returns)
Here:
$5,781
State:
$12,831
(% of AGI for various income ranges: 3.9% for AGIs below $25k, 1.8% for AGIs $25k-50k, 1.7% for AGIs $50k-75k, 1.6% for AGIs $75k-100k, 1.7% for AGIs $100k-200k, 3.0% for AGIs over 200k)
Net capital gain/loss in AGI: +$11,567 (reported on 20.2% of returns)
Here:
+$11,567
State:
+$33,493
(% of AGI for various income ranges: 0.3% for AGIs $25k-50k, 0.4% for AGIs $50k-75k, 0.4% for AGIs $75k-100k, 1.3% for AGIs $100k-200k, 10.1% for AGIs over 200k)
Profit/loss from business: +$13,693 (reported on 15.7% of returns)
Here:
+$13,693
State:
+$10,012
(% of AGI for various income ranges: 8.4% for AGIs below $25k, 3.8% for AGIs $25k-50k, 2.3% for AGIs $50k-75k, 2.6% for AGIs $75k-100k, 2.5% for AGIs $100k-200k, 3.0% for AGIs over 200k)
Taxable individual retirement arrangement distribution: $16,515 (reported on 12.1% of returns)
34683:
$16,515
Florida:
$21,544
(% of AGI for various income ranges: 4.0% for AGIs below $25k, 3.3% for AGIs $25k-50k, 3.5% for AGIs $50k-75k, 3.4% for AGIs $75k-100k, 3.4% for AGIs $100k-200k, 1.8% for AGIs over 200k)
Self-employment retirement plans: $17,743 (reported on 0.5% of returns)
34683:
$17,743
Florida:
$20,611
Total itemized deductions: $21,774 (17% of AGI, reported on 31.3% of returns)
Here:
$21,774
State:
$25,533
Here:
17.1% of AGI
State:
18.0% of AGI
(% of AGI for various income ranges: 11.6% for AGIs below $25k, 10.6% for AGIs $25k-50k, 11.6% for AGIs $50k-75k, 11.4% for AGIs $75k-100k, 10.9% for AGIs $100k-200k, 7.5% for AGIs over 200k)
Charity contributions: $3,575 (reported on 26.0% of returns)
Here:
$3,575
State:
$5,698
(% of AGI for various income ranges: 0.8% for AGIs below $25k, 1.0% for AGIs $25k-50k, 1.2% for AGIs $50k-75k, 1.4% for AGIs $75k-100k, 1.6% for AGIs $100k-200k, 1.5% for AGIs over 200k)
Taxes paid: $5,377 (reported on 30.6% of returns)
34683:
$5,377
State:
$6,203
(% of AGI for various income ranges: 2.0% for AGIs below $25k, 1.9% for AGIs $25k-50k, 2.3% for AGIs $50k-75k, 2.5% for AGIs $75k-100k, 2.7% for AGIs $100k-200k, 2.5% for AGIs over 200k)
Earned income credit: $1,856 (reported on 11.9% of returns)
Here:
$1,856
State:
$2,372
(% of AGI for various income ranges: 3.9% for AGIs below $25k, 0.7% for AGIs $25k-50k)
Percentage of individuals using paid preparers for their 2012 taxes: 48.5%
Here:
48%
State:
54%
(% for various income ranges: 43.4% for AGIs below $25k, 44.7% for AGIs $25k-50k, 50.9% for AGIs $50k-75k, 50.6% for AGIs $75k-100k, 54.0% for AGIs $100k-200k, 78.8% for AGIs over 200k)
Averages for the 2004 tax year for zip code 34683, filed in 2005:
Average Adjusted Gross Income (AGI) in 2004: $58,362 (Individual Income Tax Returns)
Here:
$58,362
State:
$50,523
Salary/wage: $49,514 (reported on 82.6% of returns)
Here:
$49,514
State:
$39,563
(% of AGI for various income ranges: 142.2% for AGIs below $10k, 71.9% for AGIs $10k-25k, 77.2% for AGIs $25k-50k, 77.2% for AGIs $50k-75k, 81.1% for AGIs $75k-100k, 61.0% for AGIs over 100k)
Taxable interest for individuals: $1,990 (reported on 51.3% of returns)
This zip code:
$1,990
Florida:
$3,211
(% of AGI for various income ranges: 10.0% for AGIs below $10k, 3.5% for AGIs $10k-25k, 2.1% for AGIs $25k-50k, 1.5% for AGIs $50k-75k, 1.5% for AGIs $75k-100k, 1.4% for AGIs over 100k)
Taxable dividends: $2,725 (reported on 31.2% of returns)
Here:
$2,725
State:
$6,129
(% of AGI for various income ranges: 8.3% for AGIs below $10k, 2.0% for AGIs $10k-25k, 1.5% for AGIs $25k-50k, 1.2% for AGIs $50k-75k, 1.2% for AGIs $75k-100k, 1.4% for AGIs over 100k)
Net capital gain/loss: +$11,742 (reported on 27.2% of returns)
Here:
+$11,742
State:
+$27,205
(% of AGI for various income ranges: -2.3% for AGIs below $10k, -1.2% for AGIs $10k-25k, 0.7% for AGIs $25k-50k, 1.2% for AGIs $50k-75k, 2.3% for AGIs $75k-100k, 10.0% for AGIs over 100k)
Profit/loss from business: +$15,719 (reported on 15.7% of returns)
Here:
+$15,719
State:
+$10,634
(% of AGI for various income ranges: 7.3% for AGIs below $10k, 7.6% for AGIs $10k-25k, 4.0% for AGIs $25k-50k, 3.1% for AGIs $50k-75k, 2.1% for AGIs $75k-100k, 4.8% for AGIs over 100k)
IRA payment deduction: $3,205 (reported on 4.2% of returns)
34683:
$3,205
Florida:
$3,082
(% of AGI for various income ranges: 1.0% for AGIs below $10k, 0.4% for AGIs $10k-25k, 0.3% for AGIs $25k-50k, 0.3% for AGIs $50k-75k, 0.3% for AGIs $75k-100k, 0.1% for AGIs over 100k)
Self-employed pension: $14,578 (reported on 0.8% of returns)
Here:
$14,578
Florida:
$15,857
Total itemized deductions: $18,620 (20% of AGI, reported on 40.7% of returns)
Here:
$18,620
State:
$20,370
Here:
19.6% of AGI
State:
20.7% of AGI
(% of AGI for various income ranges: 28.4% for AGIs below $10k, 15.4% for AGIs $10k-25k, 15.7% for AGIs $25k-50k, 17.3% for AGIs $50k-75k, 15.2% for AGIs $75k-100k, 9.6% for AGIs over 100k)
Charity contributions deductions: $2,897 (3% of AGI, reported on 35.4% of returns)
Here:
$2,897
State:
$4,064
Here:
2.9% of AGI
State:
3.8% of AGI
(% of AGI for various income ranges: 1.2% for AGIs below $10k, 1.3% for AGIs $10k-25k, 1.7% for AGIs $25k-50k, 1.8% for AGIs $50k-75k, 1.7% for AGIs $75k-100k, 1.8% for AGIs over 100k)
Total tax: $10,728 (reported on 78.6% of returns)
34683:
$10,728
State:
$9,431
(% of AGI for various income ranges: 4.5% for AGIs below $10k, 4.7% for AGIs $10k-25k, 7.2% for AGIs $25k-50k, 9.0% for AGIs $50k-75k, 10.6% for AGIs $75k-100k, 20.6% for AGIs over 100k)
Earned income credit: $1,508 (reported on 9.3% of returns)
Here:
$1,508
State:
$1,808
Percentage of individuals using paid preparers for their 2004 taxes: 53.7%
Here:
54%
State:
60%
(% for various income ranges: 48.8% for AGIs below $10k, 52.3% for AGIs $10k-25k, 52.9% for AGIs $25k-50k, 54.1% for AGIs $50k-75k, 53.1% for AGIs $75k-100k, 64.4% for AGIs over 100k)
Likely homosexual households (counted as self-reported same-sex unmarried-partner households)
Lesbian couples: 0.3% of all households
Gay men: 0.1% of all households
Household received Food Stamps/SNAP in the past 12 months: 1,047 Household did not receive Food Stamps/SNAP in the past 12 months: 13,574
Women who had a birth in the past 12 months: 171 (163 now married, 14 unmarried) Women who did not have a birth in the past 12 months: 7,181 (3,045 now married, 4,136 unmarried)
Housing units in zip code 34683 with a mortgage: 7,698 (1,067 second mortgage, 1,001 both second mortgage and home equity loan) Houses without a mortgage: 286
Median monthly owner costs for units with a mortgage: $1,935 Median monthly owner costs for units without a mortgage: $674
Residents with income below the poverty level in 2022:
This zip code:
9.3%
Whole state:
12.7%
Residents with income below 50% of the poverty level in 2022:
This zip code:
5.9%
Whole state:
6.6%
Median number of rooms in houses and condos:
Here:
6.0
State:
5.9
Median number of rooms in apartments:
Here:
4.2
State:
4.2
Notable locations in this zip code not listed on our city pages
Notable locations in zip code 34683: Crystal Beach Plaza (A), East Lake Woodlands Plaza (B), The Shops of Palm Harbor (C), The Village at Saint George (D), Point Plaza (E), Palm Harbor Fire and Rescue Station 68 (F), Palm Harbor Fire and Rescue Station 66 (G), Palm Harbor Fire and Rescue Station 67 (H), Palm Harbor Wellness Center (I). Display/hide their locations on the map
Shopping Centers: The Fountains Shopping Center (1), Highland Lakes Shopping Center (2), Seabreeze Shopping Center (3), De Soto Junction Shopping Center (4). Display/hide their locations on the map
Churches in zip code 34683 include: Berea Church (A), Pleasant Valley Church (B), Saint Alfreds Church (C), Christ Church (D), Unity Church of Palm Harbor (E). Display/hide their locations on the map
In group quarters: 65 (-1 institutionalized population)
Size of family households: 5,421 2-persons, 1,708 3-persons, 1,536 4-persons, 648 5-persons, 151 6-persons, 75 7-or-more-persons
Size of nonfamily households: 3,819 1-person, 1,039 2-persons, 158 3-persons
4,264 married couples with children.
1,430 single-parent households (439 men, 991 women).
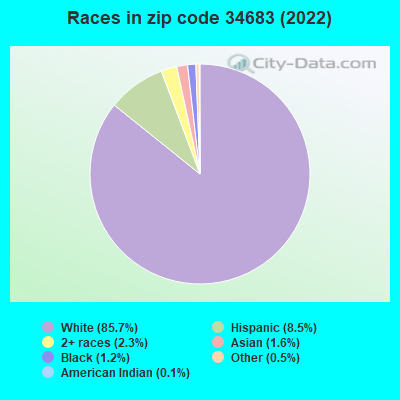
83.9% of residents of 34683 zip code speak English at home.
5.7% of residents speak Spanish at home (62% very well, 28% well, 10% not well).
6.7% of residents speak other Indo-European language at home (69% very well, 18% well, 13% not well).
0.8% of residents speak Asian or Pacific Island language at home (59% very well, 11% well, 30% not well).
2.6% of residents speak other language at home (56% very well, 33% well, 5% not well, 6% not at all).
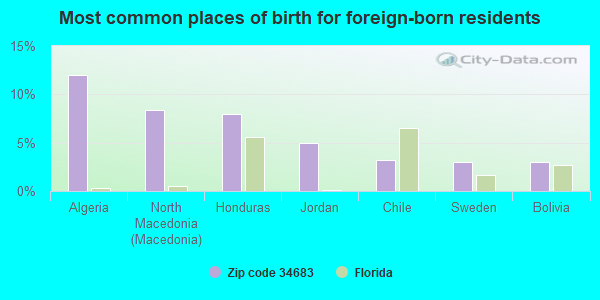
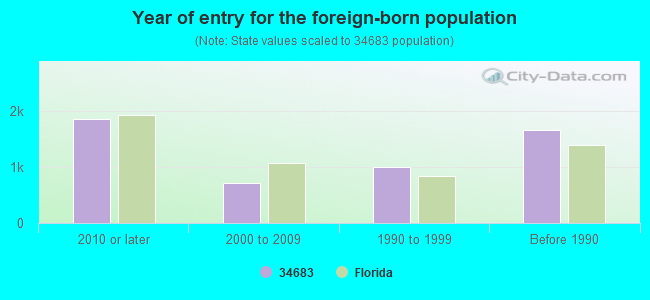
Foreign born population: 4,477 (12.8%) (75.0% of them are naturalized citizens)
Major facilities with environmental interests located in this zip code:
HOME PORT MARINA (4200 BAYSHORE BLVD in PALM HARBOR, FL)
(Integrated Compliance Information System) - ICIS-04-2001-0082, FORMAL ENFORCEMENT ACTION National Pollutant Discharge Elimination System NON-MAJOR (Tracking pollutant discharge elimination systems) - permit Business SIC classification: MARINAS Organizations: T.C. SHOOK (CONTACT/OWNER)
Alternative names: HOMEPORT MARINA
OZONA ELEMENTARY SCHOOL (601 TAMPA ROAD in PALM HARBOR, FL)
(Geographic Names Information System) (National Center for Education Statistics) - STATE ID-3071 Organizations: PINELLAS COUNTY SCHOOL DISTRICT (SCHOOL DISTRICT)
PALM HARBOR ELEMENTARY SCHOOL (415 15TH STREET in PALM HARBOR, FL)
(Geographic Names Information System) (National Center for Education Statistics) - STATE ID-3181 Organizations: PINELLAS COUNTY SCHOOL DISTRICT (SCHOOL DISTRICT)
PALM HARBOR MIDDLE SCHOOL (1800 TAMPA ROAD in PALM HARBOR, FL)
(Geographic Names Information System) (National Center for Education Statistics) - STATE ID-3191 Organizations: PINELLAS COUNTY SCHOOL DISTRICT (SCHOOL DISTRICT)
PALM HARBOR COMMUNITY SCHOOL (1900 OMAHA STREET in PALM HARBOR, FL)
(National Center for Education Statistics) - STATE ID-4682 Organizations: PINELLAS COUNTY SCHOOL DISTRICT (SCHOOL DISTRICT)
PALM HARBOR UNIVERSITY HIGH SCHOOL (1900 OMAHA STREET in PALM HARBOR, FL)
(National Center for Education Statistics) - STATE ID-4681 Organizations: PINELLAS COUNTY SCHOOL DISTRICT (SCHOOL DISTRICT)
ALL NATURAL WATER RESTORATION, INC. (312 CROSSWINDS DRIVE in PALM HARBOR, FL)
7-ELEVEN STORE NO. 25173 (100 PALM HARBOR ROAD in PALM HARBOR, FL)
National Pollutant Discharge Elimination System NON-MAJOR (Tracking pollutant discharge elimination systems) - permit Organizations: WILLO SMITH (CONTACT/OWNER)
Alternative names: 7-ELEVEN STORE NO. 25548
GEORGIA AVE. FROM CR 1 TO US A (SECTION 2; TOWNSHIP 28S; RANGE in PALM HARBOR, FL)
National Pollutant Discharge Elimination System NON-MAJOR (Tracking pollutant discharge elimination systems) - permit Organizations: JAN HERBST (CONTACT/OWNER)
HESS STATION 09429 (2734 ALTERNATE US 19 in PALM HARBOR, FL)
National Pollutant Discharge Elimination System NON-MAJOR (Tracking pollutant discharge elimination systems) - permit Organizations: MIKE MATRI (CONTACT/OWNER)
ISLAND HARBOR MARINA (150 ORANGE ST in PALM HARBOR, FL)
National Pollutant Discharge Elimination System NON-MAJOR (Tracking pollutant discharge elimination systems) - permit Business SIC classification: MARINAS Organizations: DAN BRUERD (CONTACT/OWNER)
KEY WEST CLEANERS (2706 US HWY 19 N ALT RT in PALM HARBOR, FL)
(Resource Conservation and Recovery Act (tracking hazardous waste)) Organizations: MARK LARCO (CONTACT/OWNER)
OZONA TRACE SUBDIVISION (N. OF TAMPA ROAD & EAST OF ORA in PALM HARBOR, FL)
National Pollutant Discharge Elimination System NON-MAJOR (Tracking pollutant discharge elimination systems) - permit Organizations: LARRY LEAHON (CONTACT/OWNER)
Housing units lacking complete plumbing facilities: 0.9% Housing units lacking complete kitchen facilities: 0.3%
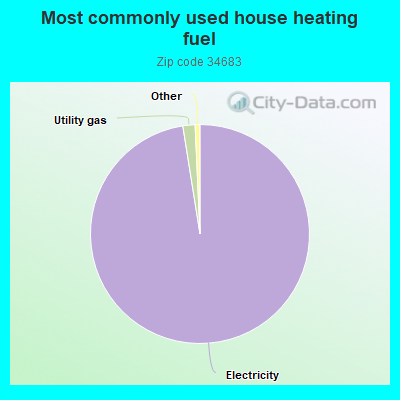
97.5%Electricity
1.8%Utility gas
Population in 1990: 42,350.
Place of birth for U.S.-born residents:
This state: 10,910
Northeast: 8,367
Midwest: 5,347
South: 3,796
West: 1,297
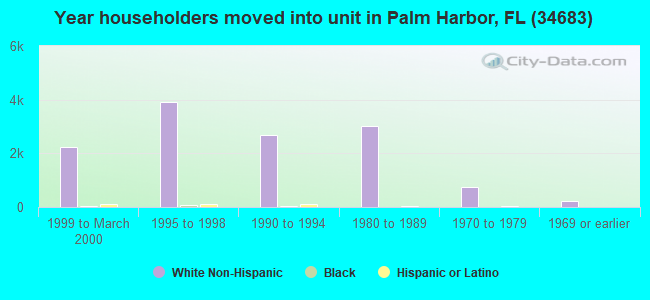
57% of the 34683 zip code residents lived in the same house 5 years ago. Out of people who lived in different houses, 56% lived in this county. Out of people who lived in different counties, 50% lived in Florida.
90% of the 34683 zip code residents lived in the same house 1 year ago. Out of people who lived in different houses, 49% moved from this county. Out of people who lived in different houses, 17% moved from different county within same state. Out of people who lived in different houses, 31% moved from different state. Out of people who lived in different houses, 1% moved from abroad.
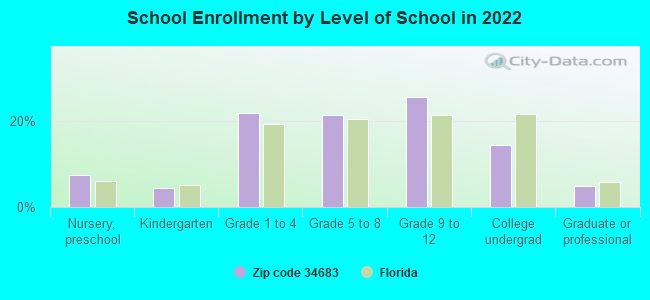
Private vs. public school enrollment:
Students in private schools in grades 1 to 8 (elementary and middle school): 460
Here:
15.8%
Florida:
15.8%
Students in private schools in grades 9 to 12 (high school): 57
Here:
3.3%
Florida:
12.9%
Students in private undergraduate colleges: 205
Here:
21.0%
Florida:
23.6%
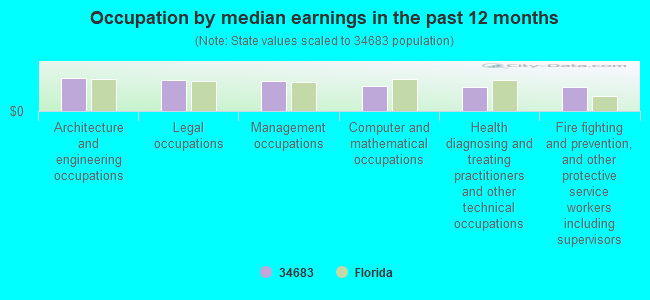
Occupation by median earnings in the past 12 months ($)
107,008Architecture and engineering occupations
99,369Legal occupations
95,668Management occupations
80,959Computer and mathematical occupations
78,158Health diagnosing and treating practitioners and other technical occupations
77,647Fire fighting and prevention, and other protective service workers including supervisors
Companies with federal contracts located in this zip code (PALM HARBOR, FL):
VF-WORKS, INC (4159 CORPORATE COURT; small business)
$175,460 with Army for X-Ray Equipment and Supplies: Medical, Dental, Veterinary. Signed on 2001-04-18. Completion date: 2001-05-17.
LAWRENCE COYLE (1536 POWDER RIDGE COURT; small business) : $41,315 in 4 contractsfrom 2001 to 2006
$14,105 with U.S. Army Corps of Engineers - civil program financing only for Custodial Janitorial Services. Taking place in IA. Signed on 2004-01-30. Completion date: 2005-02-28.
$14,105 with Army for Custodial Janitorial Services. Taking place in IA. Signed on 2004-01-30. Completion date: 2005-02-28.
$6,930 with Army for Facilities Operations Support Services. Taking place in NE. Signed on 2006-02-24. Completion date: 2006-04-20.
$6,175 with U.S. Army Corps of Engineers - civil program financing only for Recreation Site Maintenance Services (non-construction). Taking place in MS. Signed on 2001-03-14. Completion date: 2002-09-15.
GREEN HILLS SOFTWARE INC (2708 ALT 19; small business)
$29,310 with Navy for Other Defense -- Applied Research and Exploratory Development (R&D). Signed on 2000-09-13. Completion date: 2002-09-30.
ISYS CORPORATION (2757 EAST RIDGE DRIVE; small business)
$27,848 with Army for ADP Input/Output and Storage Devices. Taking place in HI. Signed on 2001-09-20. Completion date: 2001-10-19.
FERGUSON CABLING CORPORATION (203 ORANGE ST; small business)
$6,323 with Air Force for Maintenance, Repair or Alteration of Real Property -- Other Non-Building Facilities. Signed on 2006-06-13. Completion date: 2006-06-30.
Top industries in this zip code by the number of employees in 2005:
Administrative and Support and Waste Management and Remediation Services: Facilities Support Services (500-999 employees: 1 establishment)
Other Services (except Public Administration): Religious Organizations (100-249: 1, 50-99: 1, 10-19: 1, 5-9: 3, 1-4: 8)
2002 - 2018 National Fire Incident Reporting System (NFIRS) incidents
According to the data from the years 2002 - 2018 the average number of fires per year is 84. The highest number of fires - 133 took place in 2006, and the least - 47 in 2015. The data has a decreasing trend.
When looking into fire subcategories, the most reports belonged to: Structure Fires (41.2%), and Outside Fires (31.5%).
Fire incident types reported to NFIRS in Zip Code 34683


 Nearest zip codes: 34681, 34684, 34698, 34689, 33761, 34685.
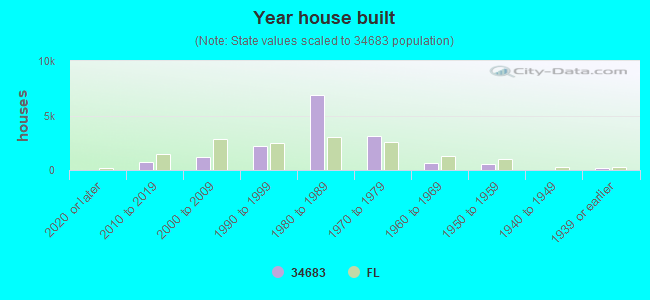


 According to the data from the years 2002 - 2018 the average number of fires per year is 84. The highest number of fires - 133 took place in 2006, and the least - 47 in 2015. The data has a decreasing trend.
 When looking into fire subcategories, the most reports belonged to: Structure Fires (41.2%), and Outside Fires (31.5%).