Estimated zip code population in 2022: 28,385 Zip code population in 2010: 25,847 Zip code population in 2000: 27,429
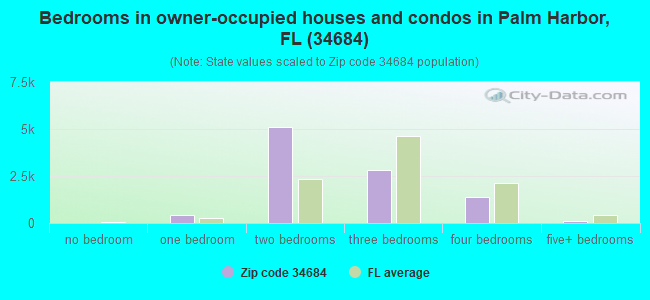
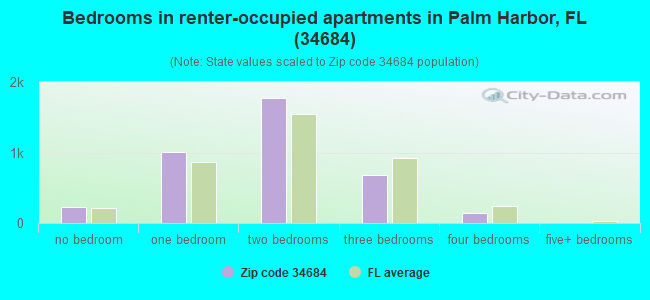
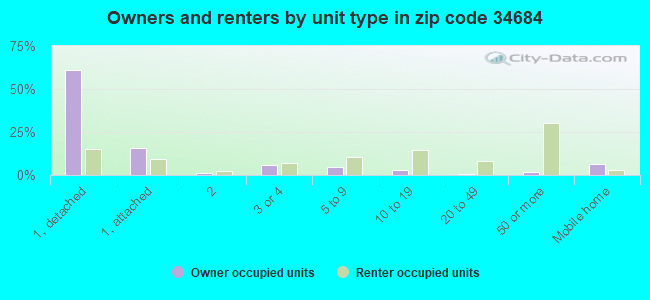
Houses and condos: 14,996 Renter-occupied apartments: 3,801
% of renters here:
28%
State:
33%
March 2022 cost of living index in zip code 34684: 99.5 (near average, U.S. average is 100)
Land area: 6.5 sq. mi. Water area: 1.1 sq. mi.
Population density: 4,334 people per square mile
(average).
OSM Map
General Map
Google Map
MSN Map
OSM Map
General Map
Google Map
MSN Map
OSM Map
General Map
Google Map
MSN Map
OSM Map
General Map
Google Map
MSN Map
Please wait while loading the map...
Real estate property taxes paid for housing units in 2022:
This zip code:
0.7% ($2,189)
Florida:
0.7% ($2,529)
Median real estate property taxes paid for housing units with mortgages in 2022: $2,538 (0.7%) Median real estate property taxes paid for housing units with no mortgage in 2022: $1,839 (0.7%)
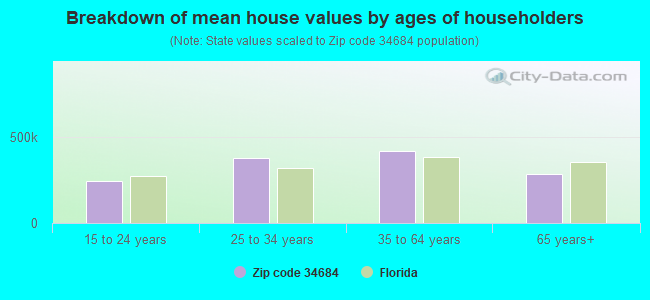
Estimated median house/condo value in 2022: $313,019
34684:
$313,019
Florida:
$354,100
According to our research of Florida and other state lists, there were 30 registered sex offenders living in 34684 zip code as of April 26, 2024. The ratio of all residents to sex offenders in zip code 34684 is 952 to 1. The ratio of registered sex offenders to all residents in this zip code is lower than the state average.
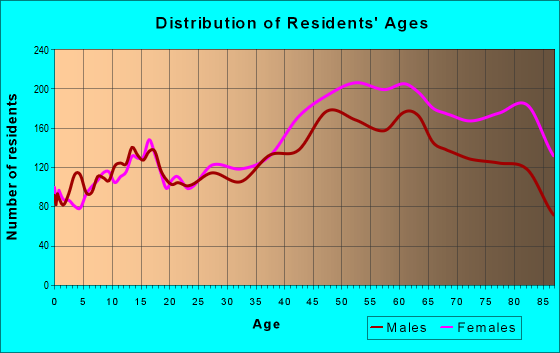
Median resident age:
This zip code:
55.5 years
Florida median age:
42.7 years
Average household size:
This zip code:
2.0 people
Florida:
2.5 people
Averages for the 2020 tax year for zip code 34684, filed in 2021:
Average Adjusted Gross Income (AGI) in 2020: $68,356 (Individual Income Tax Returns)
Here:
$68,356
State:
$82,200
Salary/wage: $58,598 (reported on 69.4% of returns)
Here:
$58,598
State:
$58,347
(% of AGI for various income ranges: 1056.7% for AGIs below $25k, 3235.6% for AGIs $25k-50k, 5883.6% for AGIs $50k-75k, 8602.4% for AGIs $75k-100k, 16386.7% for AGIs $100k-200k, 65734.4% for AGIs over 200k)
Taxable interest for individuals: $2,036 (reported on 35.5% of returns)
This zip code:
$2,036
Florida:
$4,272
(% of AGI for various income ranges: 44.4% for AGIs below $25k, 55.3% for AGIs $25k-50k, 86.2% for AGIs $50k-75k, 135.5% for AGIs $75k-100k, 220.6% for AGIs $100k-200k, 1492.2% for AGIs over 200k)
Ordinary dividends: $8,112 (reported on 27.0% of returns)
Here:
$8,112
State:
$15,863
(% of AGI for various income ranges: 71.5% for AGIs below $25k, 97.5% for AGIs $25k-50k, 201.9% for AGIs $50k-75k, 342.2% for AGIs $75k-100k, 763.8% for AGIs $100k-200k, 6793.9% for AGIs over 200k)
Net capital gain/loss in AGI: +$15,773 (reported on 24.8% of returns)
Here:
+$15,773
State:
+$62,983
(% of AGI for various income ranges: 18.2% for AGIs below $25k, 60.8% for AGIs $25k-50k, 154.9% for AGIs $50k-75k, 281.9% for AGIs $75k-100k, 939.8% for AGIs $100k-200k, 21499.4% for AGIs over 200k)
Profit/loss from business: +$11,722 (reported on 14.5% of returns)
Here:
+$11,722
State:
+$9,719
(% of AGI for various income ranges: 145.9% for AGIs below $25k, 153.8% for AGIs $25k-50k, 136.4% for AGIs $50k-75k, 254.5% for AGIs $75k-100k, 323.6% for AGIs $100k-200k, 4610.0% for AGIs over 200k)
Taxable individual retirement arrangement distribution: $19,556 (reported on 17.3% of returns)
34684:
$19,556
Florida:
$24,823
(% of AGI for various income ranges: 141.9% for AGIs below $25k, 229.6% for AGIs $25k-50k, 379.4% for AGIs $50k-75k, 708.0% for AGIs $75k-100k, 1223.3% for AGIs $100k-200k, 7037.8% for AGIs over 200k)
Self-employed (Keogh) retirement plans: $22,125 (reported on 0.3% of returns)
34684:
$22,125
Florida:
$29,694
(% of AGI for various income ranges: 19.2% for AGIs $50k-75k, 321.1% for AGIs over 200k)
Total itemized deductions: $34,302 (reported on 6.5% of returns)
Here:
$34,302
State:
$45,393
(% of AGI for various income ranges: 66.7% for AGIs below $25k, 130.6% for AGIs $25k-50k, 276.4% for AGIs $50k-75k, 441.2% for AGIs $75k-100k, 823.6% for AGIs $100k-200k, 5102.2% for AGIs over 200k)
Charity contributions: $10,743 (reported on 5.0% of returns)
Here:
$10,743
State:
$20,178
(% of AGI for various income ranges: 6.0% for AGIs below $25k, 16.7% for AGIs $25k-50k, 38.2% for AGIs $50k-75k, 76.6% for AGIs $75k-100k, 184.1% for AGIs $100k-200k, 2113.9% for AGIs over 200k)
Taxes paid: $5,536 (reported on 6.1% of returns)
34684:
$5,536
State:
$6,967
(% of AGI for various income ranges: 7.4% for AGIs below $25k, 15.4% for AGIs $25k-50k, 33.6% for AGIs $50k-75k, 78.2% for AGIs $75k-100k, 134.0% for AGIs $100k-200k, 859.4% for AGIs over 200k)
Earned income credit: $1,790 (reported on 10.2% of returns)
Here:
$1,790
State:
$2,306
(% of AGI for various income ranges: 59.2% for AGIs below $25k, 36.9% for AGIs $25k-50k, 0.8% for AGIs $50k-75k)
Percentage of individuals using paid preparers for their 2020 taxes: 91.6%
Here:
92%
State:
92%
(% for various income ranges: 89.5% for AGIs below $25k, 92.6% for AGIs $25k-50k, 92.0% for AGIs $50k-75k, 92.6% for AGIs $75k-100k, 92.8% for AGIs $100k-200k, 91.8% for AGIs over 200k)
Averages for the 2012 tax year for zip code 34684, filed in 2013:
Average Adjusted Gross Income (AGI) in 2012: $56,102 (Individual Income Tax Returns)
Here:
$56,102
State:
$60,316
Salary/wage: $47,660 (reported on 70.1% of returns)
Here:
$47,660
State:
$45,277
(% of AGI for various income ranges: 57.5% for AGIs below $25k, 67.4% for AGIs $25k-50k, 63.2% for AGIs $50k-75k, 65.5% for AGIs $75k-100k, 67.5% for AGIs $100k-200k, 39.3% for AGIs over 200k)
Taxable interest for individuals: $2,092 (reported on 41.4% of returns)
This zip code:
$2,092
Florida:
$3,587
(% of AGI for various income ranges: 3.2% for AGIs below $25k, 1.5% for AGIs $25k-50k, 1.6% for AGIs $50k-75k, 1.4% for AGIs $75k-100k, 1.3% for AGIs $100k-200k, 1.2% for AGIs over 200k)
Ordinary dividends: $6,733 (reported on 28.1% of returns)
Here:
$6,733
State:
$12,831
(% of AGI for various income ranges: 5.5% for AGIs below $25k, 2.5% for AGIs $25k-50k, 2.5% for AGIs $50k-75k, 2.6% for AGIs $75k-100k, 3.0% for AGIs $100k-200k, 4.8% for AGIs over 200k)
Net capital gain/loss in AGI: +$6,684 (reported on 22.7% of returns)
Here:
+$6,684
State:
+$33,493
(% of AGI for various income ranges: 0.2% for AGIs $25k-50k, 0.7% for AGIs $50k-75k, 0.4% for AGIs $75k-100k, 2.1% for AGIs $100k-200k, 9.7% for AGIs over 200k)
Profit/loss from business: +$10,819 (reported on 12.4% of returns)
Here:
+$10,819
State:
+$10,012
(% of AGI for various income ranges: 6.1% for AGIs below $25k, 1.9% for AGIs $25k-50k, 1.5% for AGIs $50k-75k, 1.4% for AGIs $75k-100k, 1.4% for AGIs $100k-200k, 3.8% for AGIs over 200k)
Taxable individual retirement arrangement distribution: $14,088 (reported on 19.3% of returns)
34684:
$14,088
Florida:
$21,544
(% of AGI for various income ranges: 7.2% for AGIs below $25k, 4.8% for AGIs $25k-50k, 4.6% for AGIs $50k-75k, 4.9% for AGIs $75k-100k, 5.0% for AGIs $100k-200k, 3.9% for AGIs over 200k)
Self-employment retirement plans: $22,300 (reported on 0.1% of returns)
34684:
$22,300
Florida:
$20,611
Total itemized deductions: $20,428 (20% of AGI, reported on 26.1% of returns)
Here:
$20,428
State:
$25,533
Here:
19.7% of AGI
State:
18.0% of AGI
(% of AGI for various income ranges: 11.9% for AGIs below $25k, 9.7% for AGIs $25k-50k, 9.9% for AGIs $50k-75k, 8.8% for AGIs $75k-100k, 9.5% for AGIs $100k-200k, 8.5% for AGIs over 200k)
Charity contributions: $3,986 (reported on 21.5% of returns)
Here:
$3,986
State:
$5,698
(% of AGI for various income ranges: 0.8% for AGIs below $25k, 1.1% for AGIs $25k-50k, 1.3% for AGIs $50k-75k, 1.1% for AGIs $75k-100k, 1.6% for AGIs $100k-200k, 2.6% for AGIs over 200k)
Taxes paid: $4,104 (reported on 25.3% of returns)
34684:
$4,104
State:
$6,203
(% of AGI for various income ranges: 1.5% for AGIs below $25k, 1.5% for AGIs $25k-50k, 1.7% for AGIs $50k-75k, 1.7% for AGIs $75k-100k, 2.3% for AGIs $100k-200k, 2.0% for AGIs over 200k)
Earned income credit: $1,794 (reported on 11.8% of returns)
Here:
$1,794
State:
$2,372
(% of AGI for various income ranges: 3.5% for AGIs below $25k, 0.5% for AGIs $25k-50k)
Percentage of individuals using paid preparers for their 2012 taxes: 47.2%
Here:
47%
State:
54%
(% for various income ranges: 42.0% for AGIs below $25k, 44.6% for AGIs $25k-50k, 50.7% for AGIs $50k-75k, 50.8% for AGIs $75k-100k, 57.4% for AGIs $100k-200k, 78.1% for AGIs over 200k)
Averages for the 2004 tax year for zip code 34684, filed in 2005:
Average Adjusted Gross Income (AGI) in 2004: $47,016 (Individual Income Tax Returns)
Here:
$47,016
State:
$50,523
Salary/wage: $39,805 (reported on 69.6% of returns)
Here:
$39,805
State:
$39,563
(% of AGI for various income ranges: 110.9% for AGIs below $10k, 56.5% for AGIs $10k-25k, 66.3% for AGIs $25k-50k, 65.5% for AGIs $50k-75k, 68.2% for AGIs $75k-100k, 46.3% for AGIs over 100k)
Taxable interest for individuals: $3,363 (reported on 55.4% of returns)
This zip code:
$3,363
Florida:
$3,211
(% of AGI for various income ranges: 15.3% for AGIs below $10k, 6.9% for AGIs $10k-25k, 3.7% for AGIs $25k-50k, 3.2% for AGIs $50k-75k, 2.8% for AGIs $75k-100k, 3.9% for AGIs over 100k)
Taxable dividends: $4,932 (reported on 34.3% of returns)
Here:
$4,932
State:
$6,129
(% of AGI for various income ranges: 13.5% for AGIs below $10k, 4.2% for AGIs $10k-25k, 2.5% for AGIs $25k-50k, 2.6% for AGIs $50k-75k, 2.5% for AGIs $75k-100k, 4.7% for AGIs over 100k)
Net capital gain/loss: +$14,562 (reported on 29.4% of returns)
Here:
+$14,562
State:
+$27,205
(% of AGI for various income ranges: -2.2% for AGIs below $10k, -0.2% for AGIs $10k-25k, 0.7% for AGIs $25k-50k, 1.8% for AGIs $50k-75k, 2.1% for AGIs $75k-100k, 23.7% for AGIs over 100k)
Profit/loss from business: +$9,199 (reported on 12.0% of returns)
Here:
+$9,199
State:
+$10,634
(% of AGI for various income ranges: 9.7% for AGIs below $10k, 4.0% for AGIs $10k-25k, 1.7% for AGIs $25k-50k, 1.9% for AGIs $50k-75k, 1.6% for AGIs $75k-100k, 2.6% for AGIs over 100k)
IRA payment deduction: $3,048 (reported on 3.1% of returns)
34684:
$3,048
Florida:
$3,082
(% of AGI for various income ranges: 0.6% for AGIs below $10k, 0.2% for AGIs $10k-25k, 0.3% for AGIs $25k-50k, 0.2% for AGIs $50k-75k, 0.1% for AGIs $75k-100k, 0.1% for AGIs over 100k)
Self-employed pension: $8,822 (reported on 0.3% of returns)
Here:
$8,822
Florida:
$15,857
(% of AGI for various income ranges: 0.0% for AGIs $10k-25k, 0.1% for AGIs $50k-75k, 0.1% for AGIs over 100k)
Total itemized deductions: $17,371 (22% of AGI, reported on 33.2% of returns)
Here:
$17,371
State:
$20,370
Here:
22.4% of AGI
State:
20.7% of AGI
(% of AGI for various income ranges: 32.3% for AGIs below $10k, 14.3% for AGIs $10k-25k, 12.3% for AGIs $25k-50k, 12.9% for AGIs $50k-75k, 13.2% for AGIs $75k-100k, 10.4% for AGIs over 100k)
Charity contributions deductions: $3,308 (4% of AGI, reported on 28.3% of returns)
Here:
$3,308
State:
$4,064
Here:
4.0% of AGI
State:
3.8% of AGI
(% of AGI for various income ranges: 1.5% for AGIs below $10k, 1.3% for AGIs $10k-25k, 1.3% for AGIs $25k-50k, 1.5% for AGIs $50k-75k, 2.0% for AGIs $75k-100k, 2.9% for AGIs over 100k)
Total tax: $7,060 (reported on 78.4% of returns)
34684:
$7,060
State:
$9,431
(% of AGI for various income ranges: 3.6% for AGIs below $10k, 3.9% for AGIs $10k-25k, 7.4% for AGIs $25k-50k, 9.6% for AGIs $50k-75k, 11.2% for AGIs $75k-100k, 18.1% for AGIs over 100k)
Earned income credit: $1,432 (reported on 9.1% of returns)
Here:
$1,432
State:
$1,808
Percentage of individuals using paid preparers for their 2004 taxes: 54.8%
Here:
55%
State:
60%
(% for various income ranges: 50.6% for AGIs below $10k, 55.5% for AGIs $10k-25k, 52.5% for AGIs $25k-50k, 54.8% for AGIs $50k-75k, 57.7% for AGIs $75k-100k, 67.2% for AGIs over 100k)
Likely homosexual households (counted as self-reported same-sex unmarried-partner households)
Lesbian couples: 0.1% of all households
Gay men: 0.3% of all households
Household received Food Stamps/SNAP in the past 12 months: 596 Household did not receive Food Stamps/SNAP in the past 12 months: 13,199
Women who had a birth in the past 12 months: 118 (113 now married, 10 unmarried) Women who did not have a birth in the past 12 months: 4,722 (1,927 now married, 2,795 unmarried)
Housing units in zip code 34684 with a mortgage: 4,741 (475 second mortgage, 16 home equity loan, 396 both second mortgage and home equity loan) Houses without a mortgage: 106
Median monthly owner costs for units with a mortgage: $1,613 Median monthly owner costs for units without a mortgage: $590
Residents with income below the poverty level in 2022:
This zip code:
10.3%
Whole state:
12.7%
Residents with income below 50% of the poverty level in 2022:
This zip code:
4.6%
Whole state:
6.6%
Median number of rooms in houses and condos:
Here:
5.3
State:
5.9
Median number of rooms in apartments:
Here:
4.0
State:
4.2
Notable locations in this zip code not listed on our city pages
In group quarters: 693 (-1 institutionalized population)
Size of family households: 4,575 2-persons, 1,595 3-persons, 980 4-persons, 319 5-persons, 59 6-persons
Size of nonfamily households: 5,385 1-person, 732 2-persons, 38 3-persons
2,522 married couples with children.
1,443 single-parent households (157 men, 1,286 women).
85.9% of residents of 34684 zip code speak English at home.
4.6% of residents speak Spanish at home (63% very well, 23% well, 9% not well, 4% not at all).
5.9% of residents speak other Indo-European language at home (58% very well, 34% well, 5% not well, 4% not at all).
2.7% of residents speak Asian or Pacific Island language at home (70% very well, 14% well, 15% not well, 1% not at all).
1.3% of residents speak other language at home (58% very well, 33% well, 9% not well).
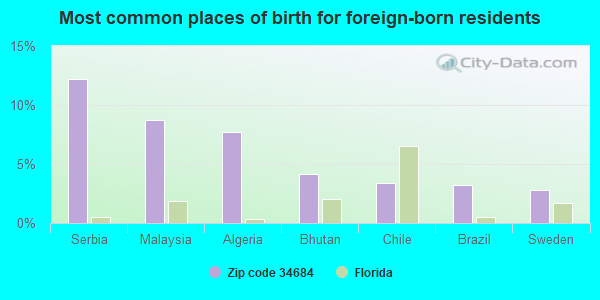
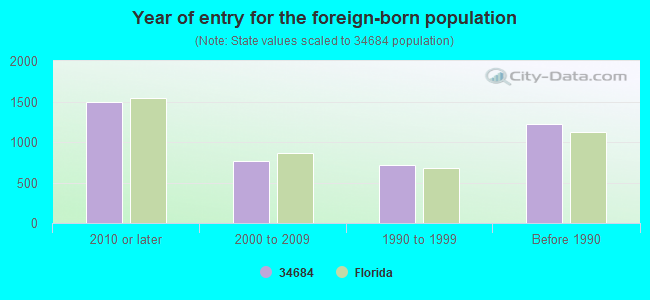
Foreign born population: 3,832 (13.5%) (60.2% of them are naturalized citizens)
Major facilities with environmental interests located in this zip code:
GOODYEAR AUTO SERVICE CENTER #2547 (30780 US HWY 19 N in PALM HARBOR, FL)
STATE MASTER (FDM) - CHAZ-FL0000446138, HAZARDOUS WASTE REGULATION PROGRAM Small Quantity Generators, between 100 kg and 1000 kg of hazardous waste/month (Resource Conservation and Recovery Act (tracking hazardous waste)) - notification Business SIC classification: AUTO AND HOME SUPPLY STORES Organizations: ALLIED TIRE SALES INC #33, ANGIE MUCCI, PARALEGAL (CONTACT/OWNER)
, GOODYEAR TIRE AND RUBBER CO (CONTACT/OWNER)
Alternative names: ALLIED TIRE SALES INC #33
JAMES AUTO BODY (36266 US HWY 19 N in PALM HARBOR, FL)
STATE MASTER (FDM) - CHAZ-FLD984252742, HAZARDOUS WASTE REGULATION PROGRAM Small Quantity Generators, between 100 kg and 1000 kg of hazardous waste/month (Resource Conservation and Recovery Act (tracking hazardous waste)) - notification Business SIC classification: TOP, BODY, AND UPHOLSTERY REPAIR SHOPS AND PAINT SHOPS Business NAICS classification: AUTOMOTIVE BODY, PAINT, AND INTERIOR REPAIR AND MAINTENANCE. Organizations: JAMES HOSKINSON (CONTACT/OWNER)
Alternative names: COLLISION SHOP
CURLEW CREEK ELEMENTARY SCHOOL (3030 CURLEW ROAD in PALM HARBOR, FL)
(Geographic Names Information System) (National Center for Education Statistics) - STATE ID-0851 Organizations: PINELLAS COUNTY SCHOOL DISTRICT (SCHOOL DISTRICT)
HIGHLAND LAKES ELEMENTARY SCHOOL (3636 RIDGE BOULEVARD in PALM HARBOR, FL)
(National Center for Education Statistics) - STATE ID-1781 Organizations: PINELLAS COUNTY SCHOOL DISTRICT (SCHOOL DISTRICT)
JOSEPH L. CARWISE MIDDLE SCHOOL (3301 BENTLEY DRIVE in PALM HARBOR, FL)
(National Center for Education Statistics) - STATE ID-0531 Organizations: PINELLAS COUNTY SCHOOL DISTRICT (SCHOOL DISTRICT)
LAKE ST. GEORGE ELEMENTARY SCHOOL (2855 COUNTY ROAD 95 in PALM HARBOR, FL)
(National Center for Education Statistics) - STATE ID-6281 Organizations: PINELLAS COUNTY SCHOOL DISTRICT (SCHOOL DISTRICT)
SPECIALITY CLEANERS (36081 US 19 NORTH in PALM HARBOR, FL)
AIR MINOR (AIRS/AFS) (Resource Conservation and Recovery Act (tracking hazardous waste)) Business SIC classification: DRYCLEANING PLANTS, EXCEPT RUG CLEANING Organizations: SHAHROKH AKVAN (CONTACT/OWNER)
Alternative names: SPECIALTY CLEANERS
CINNAMON HILL BLVD. FORM HIGHL (SECTION 31, 6; TOWNSHIP 27, 28 in PALM HARBOR, FL)
National Pollutant Discharge Elimination System NON-MAJOR (Tracking pollutant discharge elimination systems) - permit Organizations: JAN HERBST (CONTACT/OWNER)
INNISBROOK (SECTION 25, TOWNSHIP 27, RANGE in PALM HARBOR, FL)
National Pollutant Discharge Elimination System NON-MAJOR (Tracking pollutant discharge elimination systems) - permit Organizations: BOB GEIMER (CONTACT/OWNER)
NATURE'S WONDPW TOWNHOMES (SE WEST LAKE RD. & BACKIES RD. in PALM HARBOR, FL)
National Pollutant Discharge Elimination System NON-MAJOR (Tracking pollutant discharge elimination systems) - permit Organizations: JOSEPH YASSO (CONTACT/OWNER)
PELICAN CAR WASH INC (31425 US HWY 19 N in PALM HARBOR, FL)
(Resource Conservation and Recovery Act (tracking hazardous waste)) Organizations: ALLEN JADIDIAN, REG MGR (CONTACT/OWNER)
PERFORMANCE TRANSMISSIONS & AUTO REPAIR (36258 US HWY 19 N in PALM HARBOR, FL)
(Resource Conservation and Recovery Act (tracking hazardous waste)) Business NAICS classification: GENERAL AUTOMOTIVE REPAIR. Organizations: JIM FOUNTAS (CONTACT/OWNER)
RIVIERE RIDGE SHOPPING CENTER (35609 US HWY. 19 N. in PALM HARBOR, FL)
National Pollutant Discharge Elimination System NON-MAJOR (Tracking pollutant discharge elimination systems) - permit Organizations: THOMAS TREMPER (CONTACT/OWNER)
Housing units lacking complete plumbing facilities: 0.6% Housing units lacking complete kitchen facilities: 1.4%
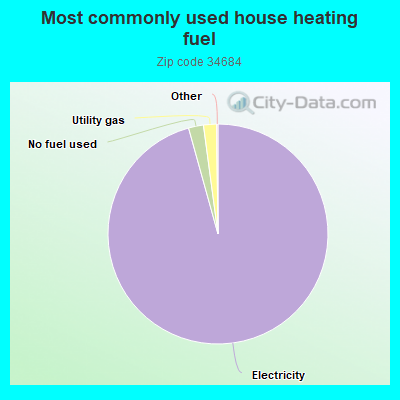
95.7%Electricity
2.2%No fuel used
1.9%Utility gas
Population in 1990: 21,753. Population change in the 1990s: +5,676 (+26.1%).
Place of birth for U.S.-born residents:
This state: 6,659
Northeast: 8,357
Midwest: 5,909
South: 2,262
West: 995
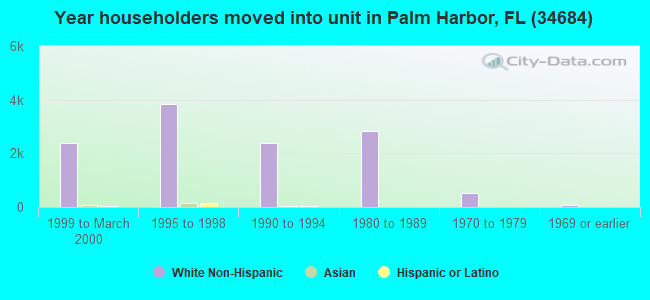
52% of the 34684 zip code residents lived in the same house 5 years ago. Out of people who lived in different houses, 53% lived in this county. Out of people who lived in different counties, 50% lived in Florida.
87% of the 34684 zip code residents lived in the same house 1 year ago. Out of people who lived in different houses, 34% moved from this county. Out of people who lived in different houses, 12% moved from different county within same state. Out of people who lived in different houses, 50% moved from different state. Out of people who lived in different houses, 9% moved from abroad.
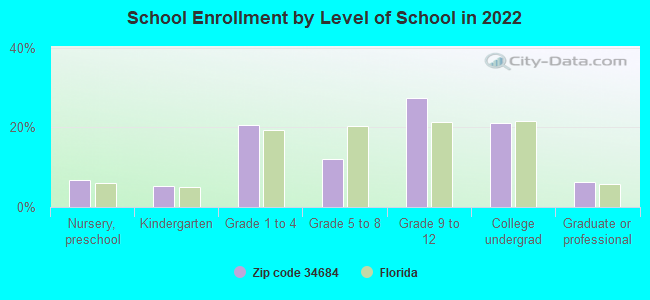
Private vs. public school enrollment:
Students in private schools in grades 1 to 8 (elementary and middle school): 163
Here:
10.9%
Florida:
15.8%
Students in private schools in grades 9 to 12 (high school): 112
Here:
8.9%
Florida:
12.9%
Students in private undergraduate colleges: 94
Here:
9.8%
Florida:
23.6%
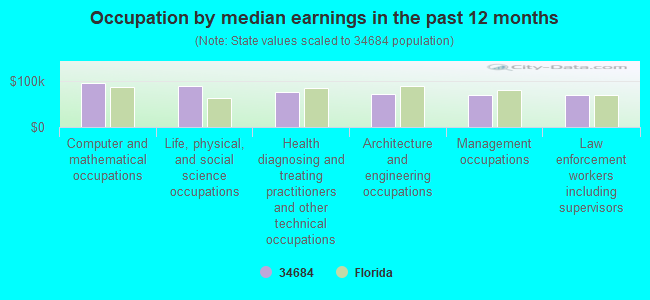
Occupation by median earnings in the past 12 months ($)
96,374Computer and mathematical occupations
89,675Life, physical, and social science occupations
77,028Health diagnosing and treating practitioners and other technical occupations
72,144Architecture and engineering occupations
71,020Management occupations
70,719Law enforcement workers including supervisors
Companies with federal contracts located in this zip code (PALM HARBOR, FL):
ROBERT E OLSON (2673 CAMILLE DRIVE; small business) : $128,275 in 6 contractsfrom 2002 to 2005
Contracts for Expert Witness, Legal Services by Offices, Boards and Divisions (includes Attorney General, Deputy Attorney General, etc.) Signed by year:2000: $0; 2001: $0; 2002: $74,000; 2003: $29,275; 2004: $0; 2005: $25,000; 2006: $0.
Biggest contracts:
$37,000 with Offices, Boards and Divisions (includes Attorney General, Deputy Attorney General, etc.) for Expert Witness. Taking place in DC. Signed on 2002-02-15. Completion date: 2002-09-15.
$37,000, same as above.Signed on 2002-02-15. Completion date: 2002-09-15.
$25,000 with Offices, Boards and Divisions (includes Attorney General, Deputy Attorney General, etc.) for Legal Services. Taking place in DC. Signed on 2005-04-11. Completion date: 2006-03-31.
$16,500 with Offices, Boards and Divisions (includes Attorney General, Deputy Attorney General, etc.) for Expert Witness. Taking place in DC. Signed on 2003-09-15. Completion date: 2004-06-15.
KENYON POWER BOATS INC (36851 US HIGHWAY 19 N; small business)
$54,946 with Air Force for Gasoline Rotary Engines and Components. Signed on 2005-09-27. Completion date: 2005-10-31.
barbara a. stein, md (33920 U.S. HWY 19 NORTH,; small business)
$28,200 with Offices, Boards and Divisions (includes Attorney General, Deputy Attorney General, etc.) for Engineering and Technical Services. Signed on 2005-05-30. Completion date: 2005-12-30.
GTA-IB, LLC (36750 US HWY 19 NORTH) : $16,005 in 3 contractsin 2005
$14,276 with Army for Other Education and Training Services. Signed on 2005-03-23. Completion date: 2005-04-15.
$2,588, same as above.Signed on 2005-04-25. Completion date: 2005-04-15.
-$859, same as above.Signed on 2005-05-13. Completion date: 2005-04-15.
UNITED ANGLICAN CHURCH/LAUD HA (217 KATHERINE BLVD STE 211; small business) : $15,300 in 3 contractsfrom 2003 to 2005
$5,100 with Army for Lectures For Training. Taking place in TX. Signed on 2005-08-08. Completion date: 2005-08-12.
$5,100 with Army for Other Professional Services. Taking place in TX. Signed on 2004-08-02. Completion date: 2004-08-13.
$5,100, same as above.Signed on 2003-08-07. Completion date: 2003-08-15.
HEAVY DUTY POWERTRAIN (715 CREEKSIDE LN; small business)
$7,465 with Army for Vehicular Brake, Steering, Axle, Wheel, and Track Components. Signed on 2005-04-22. Completion date: 2005-04-27.
NORTHRUP CONSTRUCTION INC (168 LAKESHORE DRIVE WEST; small business)
$6,900 with U.S. Army Corps of Engineers - civil program financing only for Engineering and Technical Services. Signed on 2001-05-03. Completion date: 2001-06-29.
Top industries in this zip code by the number of employees in 2005:
Administrative and Support and Waste Management and Remediation Services: Temporary Help Services (over 1000 employees: 1 establishment, 250-499 employees: 2 establishments, 100-249 employees: 1 establishment, 20-49 employees: 1 establishment, 1-4 employees: 1 establishment)
Professional, Scientific, and Technical Services: Other Accounting Services (over 1000: 1, 10-19: 1, 1-4: 4)
Health Care and Social Assistance: Offices of Physicians (except Mental Health Specialists) (50-99: 2, 20-49: 8, 10-19: 15, 5-9: 27, 1-4: 46)
Health Care and Social Assistance: Offices of Physical, Occupational and Speech Therapists, and Audiologists (500-999: 1, 50-99: 1, 20-49: 1, 10-19: 1, 5-9: 2, 1-4: 3)
Accommodation and Food Services: Hotels (except Casino Hotels) and Motels (500-999: 1, 50-99: 1, 20-49: 1, 10-19: 1, 1-4: 1)
Professional, Scientific, and Technical Services: All Other Professional, Scientific, and Technical Services (500-999: 1, 10-19: 1, 1-4: 5)
Professional, Scientific, and Technical Services: Computer Systems Design Services (500-999: 1, 1-4: 6)
People in group quarters in 2010:
382 people in nursing facilities/skilled-nursing facilities
57 people in workers' group living quarters and job corps centers
18 people in in-patient hospice facilities
6 people in group homes intended for adults
People in group quarters in 2000:
860 people in nursing homes
250 people in other noninstitutional group quarters
2 people in religious group quarters
2 people in other nonhousehold living situations
Fatal accident statistics in 2014:
Fatal accident count: 5
Vehicles involved in fatal accidents: 7
Fatal accidents caused by drunken drivers: 1
Fatalities: 5
Persons involved in fatal accidents: 11
Pedestrians involved in fatal accidents: 3
Fatal accident statistics in 2013:
Fatal accident count: 4
Vehicles involved in fatal accidents: 5
Fatal accidents caused by drunken drivers: 0
Fatalities: 4
Persons involved in fatal accidents: 6
Pedestrians involved in fatal accidents: 3
Home Mortgage Disclosure Act Aggregated Statistics For Year 2009 (Based on 6 full and 8 partial tracts)
A) FHA, FSA/RHS & VA Home Purchase Loans
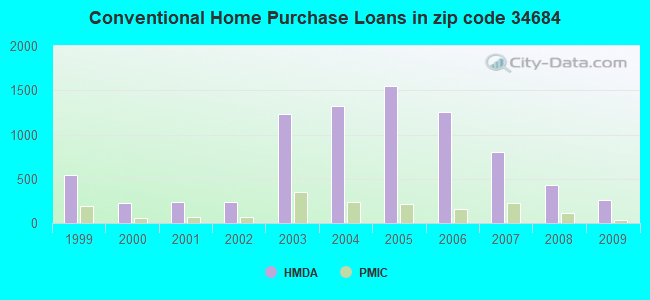
B) Conventional Home Purchase Loans
C) Refinancings
D) Home Improvement Loans
F) Non-occupant Loans on < 5 Family Dwellings (A B C & D)
G) Loans On Manufactured Home Dwelling (A B C & D)
Number
Average Value
Number
Average Value
Number
Average Value
Number
Average Value
Number
Average Value
Number
Average Value
LOANS ORIGINATED
174
$154,625
261
$136,680
456
$153,039
25
$101,266
79
$113,805
13
$87,839
APPLICATIONS APPROVED, NOT ACCEPTED
6
$112,552
23
$110,120
50
$162,831
6
$9,962
15
$100,799
1
$21,310
APPLICATIONS DENIED
21
$154,035
50
$195,326
284
$167,533
21
$75,030
51
$103,506
8
$76,325
APPLICATIONS WITHDRAWN
27
$142,341
34
$194,181
168
$150,184
8
$55,426
21
$134,350
1
$90,550
FILES CLOSED FOR INCOMPLETENESS
8
$120,799
10
$87,194
46
$176,148
2
$74,445
6
$79,483
0
$0
Aggregated Statistics For Year 2008 (Based on 6 full and 8 partial tracts)
A) FHA, FSA/RHS & VA Home Purchase Loans
B) Conventional Home Purchase Loans
C) Refinancings
D) Home Improvement Loans
F) Non-occupant Loans on < 5 Family Dwellings (A B C & D)
G) Loans On Manufactured Home Dwelling (A B C & D)
Number
Average Value
Number
Average Value
Number
Average Value
Number
Average Value
Number
Average Value
Number
Average Value
LOANS ORIGINATED
126
$166,908
426
$161,009
391
$148,701
69
$53,479
164
$134,992
11
$70,299
APPLICATIONS APPROVED, NOT ACCEPTED
3
$258,180
58
$163,584
106
$149,980
25
$19,791
42
$139,964
0
$0
APPLICATIONS DENIED
30
$201,573
247
$171,933
378
$184,060
71
$60,382
215
$155,738
10
$79,361
APPLICATIONS WITHDRAWN
15
$186,505
63
$182,093
124
$157,650
20
$211,886
33
$175,953
3
$75,900
FILES CLOSED FOR INCOMPLETENESS
2
$142,195
32
$214,791
56
$171,585
8
$58,039
23
$159,053
0
$0
Aggregated Statistics For Year 2007 (Based on 6 full and 8 partial tracts)
A) FHA, FSA/RHS & VA Home Purchase Loans
B) Conventional Home Purchase Loans
C) Refinancings
D) Home Improvement Loans
E) Loans on Dwellings For 5+ Families
F) Non-occupant Loans on < 5 Family Dwellings (A B C & D)
G) Loans On Manufactured Home Dwelling (A B C & D)
Number
Average Value
Number
Average Value
Number
Average Value
Number
Average Value
Number
Average Value
Number
Average Value
Number
Average Value
LOANS ORIGINATED
39
$163,507
799
$154,667
863
$165,583
125
$85,276
1
$2,547,350
299
$151,688
21
$81,653
APPLICATIONS APPROVED, NOT ACCEPTED
0
$0
137
$180,023
169
$177,482
17
$110,219
0
$0
64
$152,624
3
$85,087
APPLICATIONS DENIED
4
$155,920
209
$230,242
612
$194,005
100
$71,455
0
$0
148
$216,986
18
$69,684
APPLICATIONS WITHDRAWN
2
$230,450
70
$170,881
251
$174,005
39
$128,865
0
$0
56
$141,487
7
$48,897
FILES CLOSED FOR INCOMPLETENESS
2
$116,135
38
$187,254
118
$198,640
2
$132,175
0
$0
19
$173,413
0
$0
Aggregated Statistics For Year 2006 (Based on 6 full and 8 partial tracts)
A) FHA, FSA/RHS & VA Home Purchase Loans
B) Conventional Home Purchase Loans
C) Refinancings
D) Home Improvement Loans
F) Non-occupant Loans on < 5 Family Dwellings (A B C & D)
G) Loans On Manufactured Home Dwelling (A B C & D)
Number
Average Value
Number
Average Value
Number
Average Value
Number
Average Value
Number
Average Value
Number
Average Value
LOANS ORIGINATED
16
$203,142
1,254
$148,376
1,377
$160,721
179
$104,393
403
$146,702
32
$61,145
APPLICATIONS APPROVED, NOT ACCEPTED
1
$249,010
195
$156,615
252
$164,846
43
$67,833
50
$140,075
10
$52,771
APPLICATIONS DENIED
8
$68,271
227
$198,481
523
$165,106
116
$80,883
95
$143,544
23
$84,629
APPLICATIONS WITHDRAWN
2
$157,825
115
$148,089
414
$177,333
31
$82,567
40
$171,729
3
$87,790
FILES CLOSED FOR INCOMPLETENESS
0
$0
49
$160,922
132
$174,287
11
$38,154
6
$151,100
0
$0
Aggregated Statistics For Year 2005 (Based on 6 full and 8 partial tracts)
A) FHA, FSA/RHS & VA Home Purchase Loans
B) Conventional Home Purchase Loans
C) Refinancings
D) Home Improvement Loans
F) Non-occupant Loans on < 5 Family Dwellings (A B C & D)
G) Loans On Manufactured Home Dwelling (A B C & D)
Number
Average Value
Number
Average Value
Number
Average Value
Number
Average Value
Number
Average Value
Number
Average Value
LOANS ORIGINATED
32
$165,593
1,549
$139,664
1,492
$143,987
213
$99,680
414
$121,475
22
$73,120
APPLICATIONS APPROVED, NOT ACCEPTED
0
$0
144
$135,228
250
$140,537
47
$70,567
35
$106,648
15
$72,531
APPLICATIONS DENIED
8
$137,184
222
$127,025
624
$146,712
134
$67,663
87
$118,446
18
$89,086
APPLICATIONS WITHDRAWN
6
$137,518
152
$148,575
470
$144,398
75
$102,867
27
$156,742
3
$88,773
FILES CLOSED FOR INCOMPLETENESS
2
$208,480
33
$128,532
279
$149,811
14
$50,926
20
$141,504
3
$154,263
Aggregated Statistics For Year 2004 (Based on 6 full and 8 partial tracts)
A) FHA, FSA/RHS & VA Home Purchase Loans
B) Conventional Home Purchase Loans
C) Refinancings
D) Home Improvement Loans
F) Non-occupant Loans on < 5 Family Dwellings (A B C & D)
G) Loans On Manufactured Home Dwelling (A B C & D)
Number
Average Value
Number
Average Value
Number
Average Value
Number
Average Value
Number
Average Value
Number
Average Value
LOANS ORIGINATED
67
$138,266
1,317
$124,692
1,327
$126,796
155
$53,854
273
$108,760
30
$58,195
APPLICATIONS APPROVED, NOT ACCEPTED
0
$0
129
$116,856
253
$117,743
38
$58,866
32
$105,006
22
$67,383
APPLICATIONS DENIED
10
$117,402
212
$112,905
588
$120,011
134
$49,042
74
$101,663
25
$53,968
APPLICATIONS WITHDRAWN
2
$154,140
91
$130,660
429
$128,286
39
$82,999
28
$92,216
5
$76,932
FILES CLOSED FOR INCOMPLETENESS
0
$0
40
$124,063
253
$134,147
14
$55,239
10
$112,367
3
$168,140
Aggregated Statistics For Year 2003 (Based on 6 full and 8 partial tracts)
A) FHA, FSA/RHS & VA Home Purchase Loans
B) Conventional Home Purchase Loans
C) Refinancings
D) Home Improvement Loans
F) Non-occupant Loans on < 5 Family Dwellings (A B C & D)
Number
Average Value
Number
Average Value
Number
Average Value
Number
Average Value
Number
Average Value
LOANS ORIGINATED
155
$118,240
1,233
$117,203
3,087
$113,481
110
$34,013
366
$87,084
APPLICATIONS APPROVED, NOT ACCEPTED
5
$101,810
86
$108,131
345
$102,263
22
$26,781
25
$72,270
APPLICATIONS DENIED
12
$105,946
147
$109,389
803
$117,963
87
$29,956
35
$99,939
APPLICATIONS WITHDRAWN
2
$86,355
92
$112,992
398
$115,363
12
$68,439
31
$102,803
FILES CLOSED FOR INCOMPLETENESS
2
$119,995
31
$110,007
109
$120,099
8
$28,258
8
$88,900
Aggregated Statistics For Year 2002 (Based on 4 partial tracts)
A) FHA, FSA/RHS & VA Home Purchase Loans
B) Conventional Home Purchase Loans
C) Refinancings
D) Home Improvement Loans
F) Non-occupant Loans on < 5 Family Dwellings (A B C & D)
Number
Average Value
Number
Average Value
Number
Average Value
Number
Average Value
Number
Average Value
LOANS ORIGINATED
9
$136,210
235
$130,034
377
$121,982
71
$37,303
89
$88,023
APPLICATIONS APPROVED, NOT ACCEPTED
2
$79,540
26
$108,538
49
$83,250
5
$32,160
17
$62,300
APPLICATIONS DENIED
0
$0
39
$112,763
99
$124,261
20
$29,778
15
$78,639
APPLICATIONS WITHDRAWN
1
$182,430
21
$141,775
58
$112,581
5
$28,566
3
$114,960
FILES CLOSED FOR INCOMPLETENESS
1
$191,750
9
$106,521
12
$100,172
0
$0
0
$0
Aggregated Statistics For Year 2001 (Based on 4 partial tracts)
A) FHA, FSA/RHS & VA Home Purchase Loans
B) Conventional Home Purchase Loans
C) Refinancings
D) Home Improvement Loans
F) Non-occupant Loans on < 5 Family Dwellings (A B C & D)
Number
Average Value
Number
Average Value
Number
Average Value
Number
Average Value
Number
Average Value
LOANS ORIGINATED
27
$117,124
240
$124,222
305
$114,074
42
$30,307
41
$92,498
APPLICATIONS APPROVED, NOT ACCEPTED
4
$101,488
27
$110,330
44
$93,695
18
$29,257
7
$109,487
APPLICATIONS DENIED
5
$80,284
36
$82,335
100
$101,144
25
$37,857
6
$73,215
APPLICATIONS WITHDRAWN
3
$89,217
17
$120,366
70
$97,560
7
$33,919
4
$53,378
FILES CLOSED FOR INCOMPLETENESS
2
$89,095
6
$107,950
17
$119,895
3
$11,097
3
$62,140
Aggregated Statistics For Year 2000 (Based on 4 partial tracts)
A) FHA, FSA/RHS & VA Home Purchase Loans
B) Conventional Home Purchase Loans
C) Refinancings
D) Home Improvement Loans
F) Non-occupant Loans on < 5 Family Dwellings (A B C & D)
Number
Average Value
Number
Average Value
Number
Average Value
Number
Average Value
Number
Average Value
LOANS ORIGINATED
34
$108,085
231
$102,361
60
$82,541
43
$34,032
32
$97,116
APPLICATIONS APPROVED, NOT ACCEPTED
0
$0
24
$72,325
26
$85,438
19
$26,054
13
$42,918
APPLICATIONS DENIED
5
$81,294
43
$92,278
47
$69,785
27
$32,279
5
$64,294
APPLICATIONS WITHDRAWN
0
$0
28
$213,553
31
$78,409
9
$46,773
3
$101,647
FILES CLOSED FOR INCOMPLETENESS
0
$0
8
$61,088
8
$84,265
0
$0
1
$119,840
Aggregated Statistics For Year 1999 (Based on 1 full and 3 partial tracts)
A) FHA, FSA/RHS & VA Home Purchase Loans
B) Conventional Home Purchase Loans
C) Refinancings
D) Home Improvement Loans
E) Loans on Dwellings For 5+ Families
F) Non-occupant Loans on < 5 Family Dwellings (A B C & D)
2002 - 2018 National Fire Incident Reporting System (NFIRS) incidents
According to the data from the years 2002 - 2018 the average number of fires per year is 60. The highest number of fires - 100 took place in 2006, and the least - 33 in 2002. The data has an increasing trend.
When looking into fire subcategories, the most reports belonged to: Structure Fires (52.4%), and Outside Fires (24.3%).
Fire incident types reported to NFIRS in Zip Code 34684


 Nearest zip codes: 34683, 34685, 33761, 34681, 34677, 34698.


 According to the data from the years 2002 - 2018 the average number of fires per year is 60. The highest number of fires - 100 took place in 2006, and the least - 33 in 2002. The data has an increasing trend.
 When looking into fire subcategories, the most reports belonged to: Structure Fires (52.4%), and Outside Fires (24.3%).