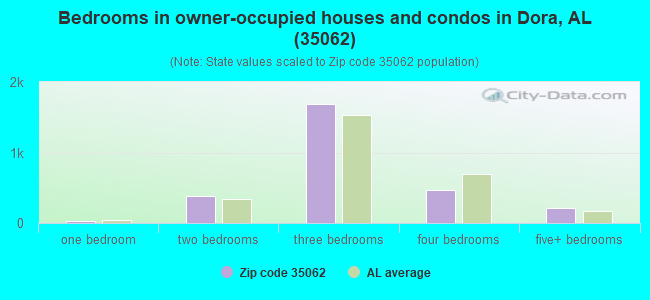
Estimated zip code population in 2022: 8,702 Zip code population in 2010: 7,944 Zip code population in 2000: 7,556
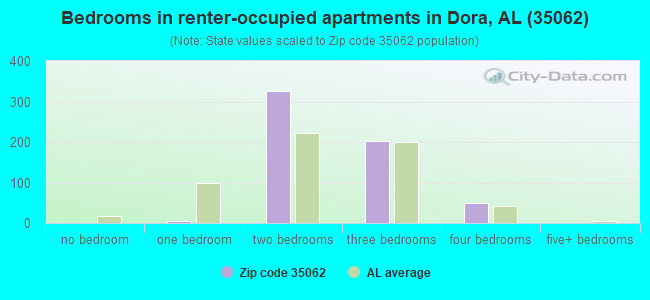
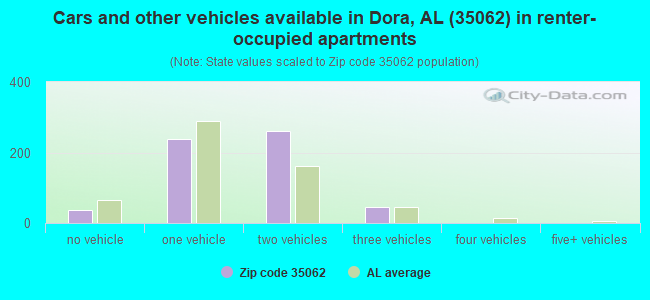
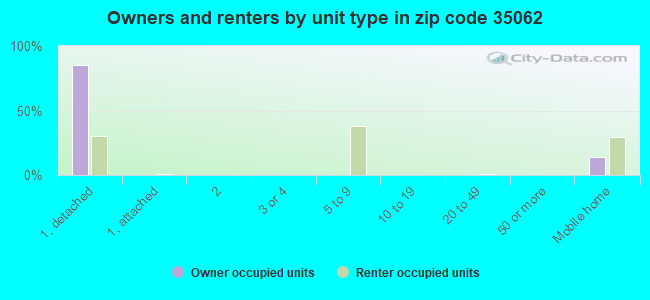
Houses and condos: 3,767 Renter-occupied apartments: 583
% of renters here:
17%
State:
30%
March 2022 cost of living index in zip code 35062: 81.4 (low, U.S. average is 100)
Land area: 44.9 sq. mi. Water area: 0.3 sq. mi.
Population density: 194 people per square mile
(very low).
OSM Map
General Map
Google Map
MSN Map
OSM Map
General Map
Google Map
MSN Map
OSM Map
General Map
Google Map
MSN Map
OSM Map
General Map
Google Map
MSN Map
Please wait while loading the map...
Real estate property taxes paid for housing units in 2022:
This zip code:
0.4% ($811)
Alabama:
0.4% ($718)
Median real estate property taxes paid for housing units with mortgages in 2022: $865 (0.4%) Median real estate property taxes paid for housing units with no mortgage in 2022: $768 (0.4%)
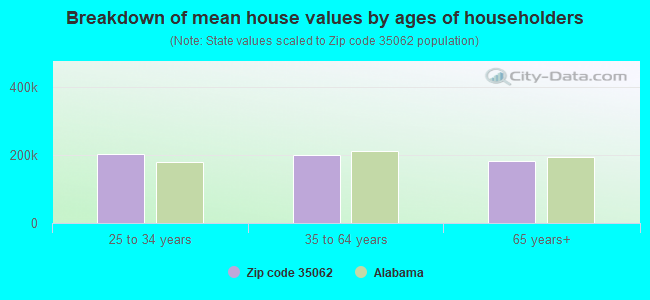
Estimated median house/condo value in 2022: $198,996
35062:
$198,996
Alabama:
$200,900
According to our research of Alabama and other state lists, there were 19 registered sex offenders living in 35062 zip code as of April 26, 2024. The ratio of all residents to sex offenders in zip code 35062 is 406 to 1. The ratio of registered sex offenders to all residents in this zip code is near the state average.
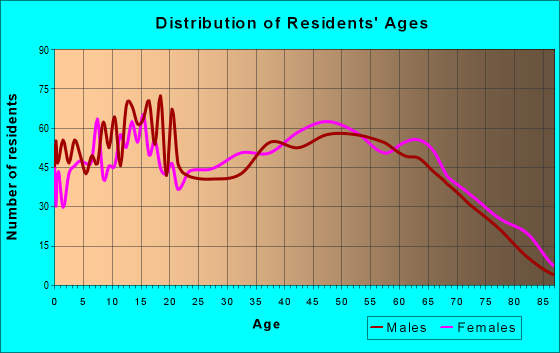
Median resident age:
This zip code:
47.5 years
Alabama median age:
39.6 years
Average household size:
This zip code:
2.6 people
Alabama:
2.5 people
Averages for the 2020 tax year for zip code 35062, filed in 2021:
Average Adjusted Gross Income (AGI) in 2020: $60,326 (Individual Income Tax Returns)
Here:
$60,326
State:
$63,984
Salary/wage: $54,072 (reported on 81.8% of returns)
Here:
$54,072
State:
$52,834
(% of AGI for various income ranges: 1128.1% for AGIs below $25k, 3341.0% for AGIs $25k-50k, 6381.6% for AGIs $50k-75k, 9713.0% for AGIs $75k-100k, 18227.2% for AGIs $100k-200k, 76095.0% for AGIs over 200k)
Taxable interest for individuals: $883 (reported on 25.2% of returns)
This zip code:
$883
Alabama:
$1,615
(% of AGI for various income ranges: 18.5% for AGIs below $25k, 18.1% for AGIs $25k-50k, 28.2% for AGIs $50k-75k, 33.7% for AGIs $75k-100k, 65.2% for AGIs $100k-200k, 460.0% for AGIs over 200k)
Ordinary dividends: $2,697 (reported on 9.1% of returns)
Here:
$2,697
State:
$7,660
(% of AGI for various income ranges: 6.7% for AGIs below $25k, 17.8% for AGIs $25k-50k, 17.1% for AGIs $50k-75k, 48.1% for AGIs $75k-100k, 84.8% for AGIs $100k-200k, 1085.0% for AGIs over 200k)
Net capital gain/loss in AGI: +$3,812 (reported on 7.6% of returns)
Here:
+$3,812
State:
+$23,528
(% of AGI for various income ranges: 6.9% for AGIs below $25k, 8.4% for AGIs $25k-50k, 55.0% for AGIs $50k-75k, 32.2% for AGIs $75k-100k, 111.0% for AGIs $100k-200k, 1285.0% for AGIs over 200k)
Profit/loss from business: +$11,082 (reported on 14.7% of returns)
Here:
+$11,082
State:
+$9,534
(% of AGI for various income ranges: 100.5% for AGIs below $25k, 132.8% for AGIs $25k-50k, 187.4% for AGIs $50k-75k, 34.1% for AGIs $75k-100k, 324.8% for AGIs $100k-200k, 10190.0% for AGIs over 200k)
Taxable individual retirement arrangement distribution: $15,539 (reported on 8.2% of returns)
35062:
$15,539
Alabama:
$19,004
(% of AGI for various income ranges: 42.2% for AGIs below $25k, 88.7% for AGIs $25k-50k, 158.4% for AGIs $50k-75k, 295.6% for AGIs $75k-100k, 685.9% for AGIs $100k-200k)
Total itemized deductions: $36,331 (reported on 4.7% of returns)
Here:
$36,331
State:
$37,338
(% of AGI for various income ranges: 45.9% for AGIs below $25k, 238.4% for AGIs $50k-75k, 619.7% for AGIs $100k-200k, 13600.0% for AGIs over 200k)
Charity contributions: $15,643 (reported on 4.1% of returns)
Here:
$15,643
State:
$18,005
(% of AGI for various income ranges: 83.7% for AGIs $50k-75k, 235.5% for AGIs $100k-200k, 5945.0% for AGIs over 200k)
Taxes paid: $6,300 (reported on 4.7% of returns)
35062:
$6,300
State:
$6,484
(% of AGI for various income ranges: 4.1% for AGIs below $25k, 38.7% for AGIs $50k-75k, 152.4% for AGIs $100k-200k, 1920.0% for AGIs over 200k)
Earned income credit: $2,648 (reported on 17.9% of returns)
Here:
$2,648
State:
$2,628
(% of AGI for various income ranges: 124.7% for AGIs below $25k, 81.6% for AGIs $25k-50k)
Percentage of individuals using paid preparers for their 2020 taxes: 94.4%
Here:
94%
State:
93%
(% for various income ranges: 93.5% for AGIs below $25k, 95.2% for AGIs $25k-50k, 94.2% for AGIs $50k-75k, 94.9% for AGIs $75k-100k, 94.0% for AGIs $100k-200k, 100.0% for AGIs over 200k)
Averages for the 2012 tax year for zip code 35062, filed in 2013:
Average Adjusted Gross Income (AGI) in 2012: $50,357 (Individual Income Tax Returns)
Here:
$50,357
State:
$52,001
Salary/wage: $46,746 (reported on 83.8% of returns)
Here:
$46,746
State:
$43,822
(% of AGI for various income ranges: 70.9% for AGIs below $25k, 77.6% for AGIs $25k-50k, 82.0% for AGIs $50k-75k, 82.7% for AGIs $75k-100k, 84.0% for AGIs $100k-200k, 35.1% for AGIs over 200k)
Taxable interest for individuals: $726 (reported on 28.4% of returns)
This zip code:
$726
Alabama:
$1,592
(% of AGI for various income ranges: 1.5% for AGIs below $25k, 0.4% for AGIs $25k-50k, 0.3% for AGIs $50k-75k, 0.2% for AGIs $75k-100k, 0.3% for AGIs $100k-200k, 0.3% for AGIs over 200k)
Ordinary dividends: $1,700 (reported on 10.4% of returns)
Here:
$1,700
State:
$5,697
(% of AGI for various income ranges: 0.4% for AGIs below $25k, 0.3% for AGIs $25k-50k, 0.2% for AGIs $50k-75k, 0.3% for AGIs $75k-100k, 0.6% for AGIs $100k-200k)
Net capital gain/loss in AGI: +$2,210 (reported on 6.4% of returns)
Here:
+$2,210
State:
+$13,286
(% of AGI for various income ranges: 0.2% for AGIs $75k-100k, 0.9% for AGIs $100k-200k)
Profit/loss from business: +$10,338 (reported on 15.3% of returns)
Here:
+$10,338
State:
+$9,151
(% of AGI for various income ranges: 6.5% for AGIs below $25k, 2.8% for AGIs $25k-50k, 1.5% for AGIs $50k-75k, 1.4% for AGIs $75k-100k, 5.2% for AGIs $100k-200k)
Taxable individual retirement arrangement distribution: $11,683 (reported on 8.9% of returns)
35062:
$11,683
Alabama:
$14,992
(% of AGI for various income ranges: 3.4% for AGIs below $25k, 2.1% for AGIs $25k-50k, 1.7% for AGIs $50k-75k, 1.9% for AGIs $75k-100k, 2.4% for AGIs $100k-200k)
Total itemized deductions: $18,932 (22% of AGI, reported on 30.0% of returns)
Here:
$18,932
State:
$21,388
Here:
22.2% of AGI
State:
20.1% of AGI
(% of AGI for various income ranges: 9.6% for AGIs below $25k, 9.2% for AGIs $25k-50k, 10.4% for AGIs $50k-75k, 11.0% for AGIs $75k-100k, 13.6% for AGIs $100k-200k, 12.7% for AGIs over 200k)
Charity contributions: $4,872 (reported on 26.6% of returns)
Here:
$4,872
State:
$5,925
(% of AGI for various income ranges: 1.4% for AGIs below $25k, 1.6% for AGIs $25k-50k, 2.3% for AGIs $50k-75k, 2.7% for AGIs $75k-100k, 3.5% for AGIs $100k-200k, 3.5% for AGIs over 200k)
Taxes paid: $4,391 (reported on 30.0% of returns)
35062:
$4,391
State:
$5,272
(% of AGI for various income ranges: 1.2% for AGIs below $25k, 1.5% for AGIs $25k-50k, 2.0% for AGIs $50k-75k, 2.7% for AGIs $75k-100k, 3.9% for AGIs $100k-200k, 3.3% for AGIs over 200k)
Earned income credit: $2,203 (reported on 20.2% of returns)
Here:
$2,203
State:
$2,646
(% of AGI for various income ranges: 7.4% for AGIs below $25k, 1.0% for AGIs $25k-50k)
Percentage of individuals using paid preparers for their 2012 taxes: 64.2%
Here:
64%
State:
60%
(% for various income ranges: 59.5% for AGIs below $25k, 66.2% for AGIs $25k-50k, 66.7% for AGIs $50k-75k, 68.6% for AGIs $75k-100k, 64.9% for AGIs $100k-200k, 100.0% for AGIs over 200k)
Averages for the 2004 tax year for zip code 35062, filed in 2005:
Average Adjusted Gross Income (AGI) in 2004: $39,638 (Individual Income Tax Returns)
Here:
$39,638
State:
$42,302
Salary/wage: $38,761 (reported on 86.7% of returns)
Here:
$38,761
State:
$36,626
(% of AGI for various income ranges: 111.7% for AGIs below $10k, 73.8% for AGIs $10k-25k, 85.0% for AGIs $25k-50k, 90.0% for AGIs $50k-75k, 89.0% for AGIs $75k-100k, 76.4% for AGIs over 100k)
Taxable interest for individuals: $1,041 (reported on 35.0% of returns)
This zip code:
$1,041
Alabama:
$1,827
(% of AGI for various income ranges: 5.7% for AGIs below $10k, 2.1% for AGIs $10k-25k, 1.1% for AGIs $25k-50k, 0.5% for AGIs $50k-75k, 0.3% for AGIs $75k-100k, 0.8% for AGIs over 100k)
Taxable dividends: $1,025 (reported on 11.7% of returns)
Here:
$1,025
State:
$4,206
(% of AGI for various income ranges: 0.2% for AGIs below $10k, 0.6% for AGIs $10k-25k, 0.3% for AGIs $25k-50k, 0.2% for AGIs $50k-75k, 0.3% for AGIs $75k-100k, 0.3% for AGIs over 100k)
Net capital gain/loss: +$2,079 (reported on 8.6% of returns)
Here:
+$2,079
State:
+$13,031
(% of AGI for various income ranges: -2.0% for AGIs below $10k, 0.0% for AGIs $10k-25k, 0.2% for AGIs $25k-50k, 0.5% for AGIs $50k-75k, 0.2% for AGIs $75k-100k, 1.6% for AGIs over 100k)
Profit/loss from business: +$7,689 (reported on 13.1% of returns)
Here:
+$7,689
State:
+$8,302
(% of AGI for various income ranges: 7.6% for AGIs below $10k, 3.5% for AGIs $10k-25k, 1.8% for AGIs $25k-50k, 1.0% for AGIs $50k-75k, 1.3% for AGIs $75k-100k, 6.4% for AGIs over 100k)
IRA payment deduction: $2,807 (reported on 1.7% of returns)
35062:
$2,807
Alabama:
$3,006
Total itemized deductions: $15,736 (24% of AGI, reported on 30.2% of returns)
Here:
$15,736
State:
$17,623
Here:
23.8% of AGI
State:
20.8% of AGI
(% of AGI for various income ranges: 7.0% for AGIs below $10k, 7.7% for AGIs $10k-25k, 10.3% for AGIs $25k-50k, 12.4% for AGIs $50k-75k, 14.2% for AGIs $75k-100k, 14.5% for AGIs over 100k)
Charity contributions deductions: $3,815 (6% of AGI, reported on 27.3% of returns)
Here:
$3,815
State:
$4,768
Here:
5.6% of AGI
State:
5.4% of AGI
(% of AGI for various income ranges: 0.5% for AGIs below $10k, 1.5% for AGIs $10k-25k, 2.0% for AGIs $25k-50k, 2.5% for AGIs $50k-75k, 3.2% for AGIs $75k-100k, 4.0% for AGIs over 100k)
Total tax: $4,537 (reported on 74.9% of returns)
35062:
$4,537
State:
$6,905
(% of AGI for various income ranges: 3.4% for AGIs below $10k, 3.5% for AGIs $10k-25k, 6.0% for AGIs $25k-50k, 8.1% for AGIs $50k-75k, 9.9% for AGIs $75k-100k, 15.2% for AGIs over 100k)
Earned income credit: $1,749 (reported on 17.0% of returns)
Here:
$1,749
State:
$2,048
Percentage of individuals using paid preparers for their 2004 taxes: 67.3%
Here:
67%
State:
65%
(% for various income ranges: 56.2% for AGIs below $10k, 70.5% for AGIs $10k-25k, 66.7% for AGIs $25k-50k, 71.9% for AGIs $50k-75k, 71.7% for AGIs $75k-100k, 70.4% for AGIs over 100k)
Likely homosexual households (counted as self-reported same-sex unmarried-partner households)
Lesbian couples: 1.4% of all households
Gay men: 0.0% of all households
Household received Food Stamps/SNAP in the past 12 months: 167 Household did not receive Food Stamps/SNAP in the past 12 months: 3,186
Women who had a birth in the past 12 months: 79 (83 now married, 4 unmarried) Women who did not have a birth in the past 12 months: 1,508 (707 now married, 800 unmarried)
Housing units in zip code 35062 with a mortgage: 1,424 (45 second mortgage, 24 both second mortgage and home equity loan) Houses without a mortgage: 47
Median monthly owner costs for units with a mortgage: $1,335 Median monthly owner costs for units without a mortgage: $445
Residents with income below the poverty level in 2022:
This zip code:
6.6%
Whole state:
16.2%
Residents with income below 50% of the poverty level in 2022:
This zip code:
1.6%
Whole state:
8.6%
Median number of rooms in houses and condos:
Here:
6.3
State:
6.5
Median number of rooms in apartments:
Here:
5.3
State:
4.7
Notable locations in this zip code not listed on our city pages
Churches in zip code 35062 include: New Temple Church (A), Morgan Chapel (B), Bethel Church (C), Canaan Church (D), Kilgore Church (E), Bryan Church (F), Frog Ridge Church (G), Good Hope Church (H), Lawler Baptist Church (I). Display/hide their locations on the map
Cemeteries: Bagley Bend Cemetery (1), Lawler Cemetery (2), Adams Cemetery (3), Union Grove Cemetery (4), New Horizon Memorial Gardens (5). Display/hide their locations on the map
Size of family households: 1,432 2-persons, 628 3-persons, 383 4-persons, 201 5-persons, 49 6-persons
Size of nonfamily households: 519 1-person, 125 2-persons, 28 3-persons
1,324 married couples with children.
188 single-parent households (38 men, 150 women).
93.8% of residents of 35062 zip code speak English at home.
1.3% of residents speak Spanish at home (69% very well, 21% not well, 10% not at all).
3.9% of residents speak other Indo-European language at home (100% very well).
1.2% of residents speak Asian or Pacific Island language at home (82% very well, 18% not well).
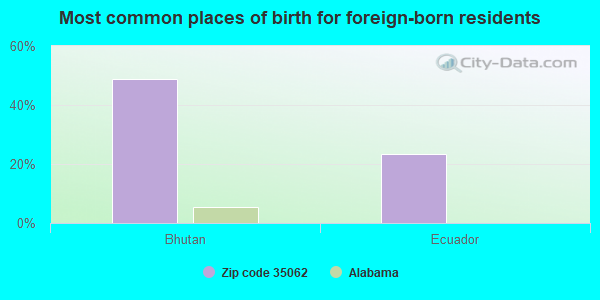
Foreign born population: 91 (1.1%) (62.1% of them are naturalized citizens)
This zip code:
1.1%
Whole state:
3.8%
49%Bhutan
23%Ecuador
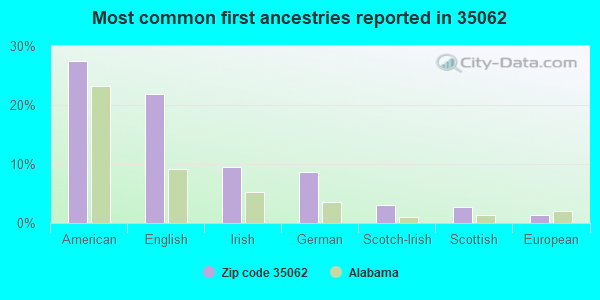
27%American
22%English
9%Irish
9%German
3%Scotch-Irish
3%Scottish
1%European
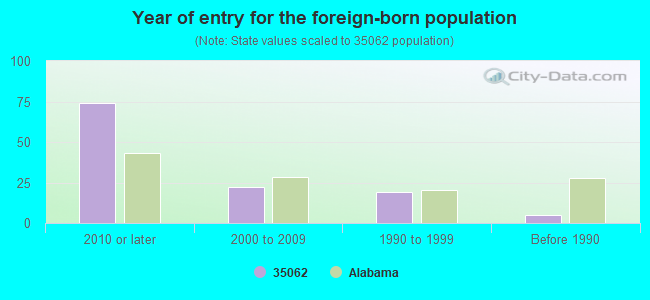
Year of entry for the foreign-born population
742010 or later
222000 to 2009
191990 to 1999
5Before 1990
Facilities with environmental interests located in this zip code:
READY MIX USA (1593 HORSE CREEK BLVD in DORA, AL)
ENFORCEMENT/COMPLIANCE ACTIVITY (Integrated Compliance Information System) - ICIS-04-2004-9917, FORMAL ENFORCEMENT ACTION (Integrated Compliance Information System) - ICIS-04-2004-9917, FORMAL ENFORCEMENT ACTION National Pollutant Discharge Elimination System NON-MAJOR (Tracking pollutant discharge elimination systems) - permit Business SIC classification: BRICK, STONE, AND RELATED CONSTRUCTION MATERIALS Organizations: READY MIX USA LLC DORA PLANT (CONTACT/OWNER)
PINEVIEW LANDFILL (2730 BRYAN ROAD in DORA, AL)
AIR MAJOR (AIRS/AFS) CRITERIA AND HAZARDOUS AIR POLLUTANT INVENTORY (Inventory of air pollution sources) National Pollutant Discharge Elimination System NON-MAJOR (Tracking pollutant discharge elimination systems) - permit Conditionally Exempt Small Quantity Generators, less than 100 kg/month of hazardous waste (Resource Conservation and Recovery Act (tracking hazardous waste)) Business SIC classification: REFUSE SYSTEMS Business NAICS classification: SOLID WASTE LANDFILL. Organizations: BFI WASTE SYSTEMS OF NO AMERIC (CONTACT/OPERATOR)
, BFI WASTE SYSTEMS OF N AMERICA (CONTACT/OPERATOR)
, BFI WASTE SYSTEMS N AMERICA (CONTACT/OWNER)
Alternative names: BFI W S N AMERICA PINEVIEW SLF, BFI WASTE SYSTEMS North AMERICA, BFI WASTE SYSTEMS OF N AMERICA, PINE VIEW SANITARY LANDFILL, PINEVIEW SANITARY LANDFILL
BETHEL BAPTIST CHURCH (DON BATSON in DORA, AL)
National Pollutant Discharge Elimination System NON-MAJOR (Tracking pollutant discharge elimination systems) - permit Business SIC classification: GENERAL CONTRACTORS-NONRESIDENTIAL BUILDINGS, OTHER THAN INDUSTRIAL BUILDINGS AND WAREHOUSES
NELSON BROTHERS INC (DORA FACILITY in DORA, AL)
National Pollutant Discharge Elimination System NON-MAJOR (Tracking pollutant discharge elimination systems) - permit Business SIC classification: EXPLOSIVES
BOOKOUT AUTO PARTS INC (6049 FLAT TOP ROAD in DORA, AL)
National Pollutant Discharge Elimination System NON-MAJOR (Tracking pollutant discharge elimination systems) - permit Business SIC classification: MOTOR VEHICLE PARTS, USED
RODNEY QUINN TRUCKING (5540 MCCALEB DRIVE in DORA, AL)
(Resource Conservation and Recovery Act (tracking hazardous waste))
NATIONAL FISHLINE COMPANY (HIGHWAY 18 in DORA, AL)
(Resource Conservation and Recovery Act (tracking hazardous waste)) Organizations: PETE SMITH (CONTACT/OWNER)
NELSON BROTHERS INC (NELSON BROTHERS DORA FACILITY in DORA, AL)
National Pollutant Discharge Elimination System NON-MAJOR (Tracking pollutant discharge elimination systems) - permit Business SIC classification: EXPLOSIVES Alternative names: NELSON BROTHERS DORA FACILITY
ADOT APD 0471 077 (ALABAMA DEPARTMENT OF TRANSPOR in DORA, AL)
National Pollutant Discharge Elimination System NON-MAJOR (Tracking pollutant discharge elimination systems) - permit Business SIC classification: HIGHWAY AND STREET CONSTRUCTION, EXCEPT ELEVATED HIGHWAYS
ADOT APD 417 504 (ALABAMA DEPARTMENT OF TRANSPOR in DORA, AL)
National Pollutant Discharge Elimination System NON-MAJOR (Tracking pollutant discharge elimination systems) - permit Business SIC classification: HIGHWAY AND STREET CONSTRUCTION, EXCEPT ELEVATED HIGHWAYS Alternative names: L S HAMILTON SIVICULTURE OPER, SIVICULTURE OPERATION POND
RIVER BEND COMMUNITY CHURCH (RIVER BEND COMMUNITY CHURCH in DORA, AL)
National Pollutant Discharge Elimination System NON-MAJOR (Tracking pollutant discharge elimination systems) - permit Business SIC classification: GENERAL CONTRACTORS-NONRESIDENTIAL BUILDINGS, OTHER THAN INDUSTRIAL BUILDINGS AND WAREHOUSES
Housing units lacking complete plumbing facilities: 7.3% Housing units lacking complete kitchen facilities: 5.5%
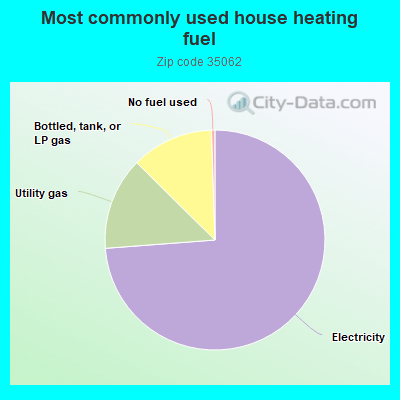
73.8%Electricity
13.6%Utility gas
12.1%Bottled, tank, or LP gas
0.5%No fuel used
Population in 1990: 11,017.
Place of birth for U.S.-born residents:
This state: 6,861
Northeast: 89
Midwest: 309
South: 868
West: 422
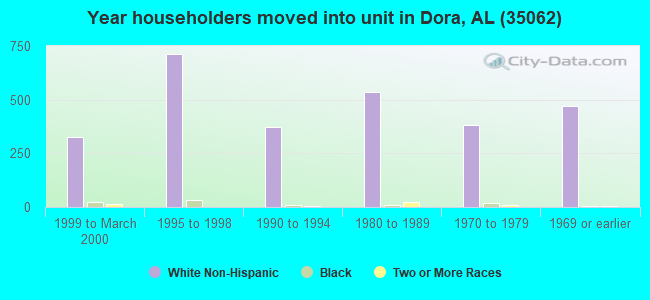
65% of the 35062 zip code residents lived in the same house 5 years ago. Out of people who lived in different houses, 60% lived in this county. Out of people who lived in different counties, 50% lived in Alabama.
97% of the 35062 zip code residents lived in the same house 1 year ago. Out of people who lived in different houses, 16% moved from this county. Out of people who lived in different houses, 74% moved from different county within same state. Out of people who lived in different houses, 17% moved from different state. Out of people who lived in different houses, 5% moved from abroad.
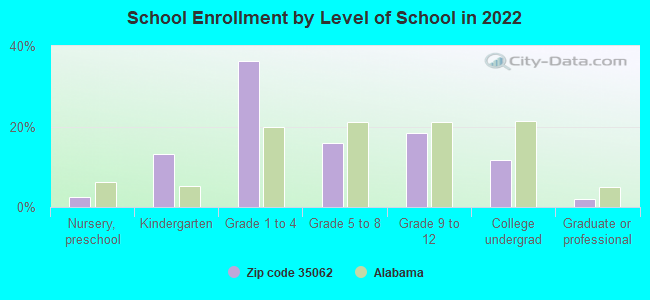
Private vs. public school enrollment:
Students in private schools in grades 1 to 8 (elementary and middle school): 139
Here:
17.3%
Alabama:
14.7%
Students in private schools in grades 9 to 12 (high school): 25
Here:
9.3%
Alabama:
16.3%
Students in private undergraduate colleges: 51
Here:
28.9%
Alabama:
14.6%
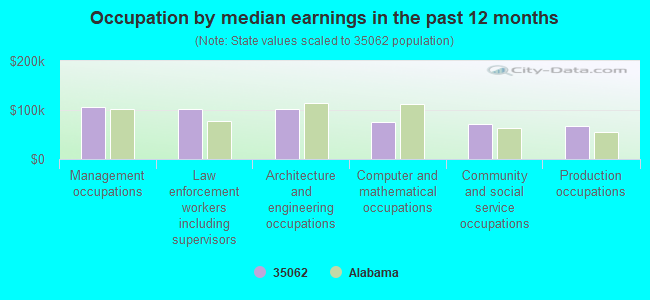
Occupation by median earnings in the past 12 months ($)
106,875Management occupations
102,937Law enforcement workers including supervisors
102,117Architecture and engineering occupations
76,512Computer and mathematical occupations
70,534Community and social service occupations
67,647Production occupations
Top industries in this zip code by the number of employees in 2005:
Detailed PMIC statistics for the following Tracts:0115.00
, 0217.00
2003 - 2018 National Fire Incident Reporting System (NFIRS) incidents
According to the data from the years 2003 - 2018 the average number of fires per year is 8. The highest number of fire incidents - 27 took place in 2009, and the least - 1 in 2003. The data has a growing trend.
When looking into fire subcategories, the most reports belonged to: Structure Fires (48.0%), and Outside Fires (38.4%).
Fire incident types reported to NFIRS in Zip Code 35062
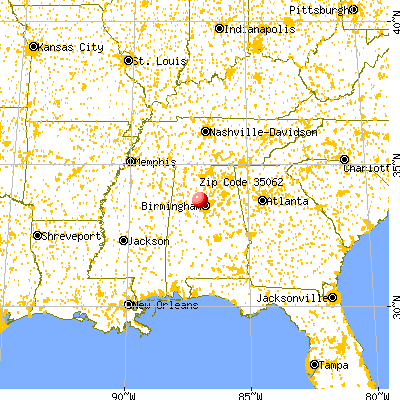


 Nearest zip codes: 35139, 35148, 35073, 35063, 35036, 35584.


 According to the data from the years 2003 - 2018 the average number of fires per year is 8. The highest number of fire incidents - 27 took place in 2009, and the least - 1 in 2003. The data has a growing trend.
 When looking into fire subcategories, the most reports belonged to: Structure Fires (48.0%), and Outside Fires (38.4%).