Estimated zip code population in 2022: 10,086 Zip code population in 2010: 11,458 Zip code population in 2000: 12,879
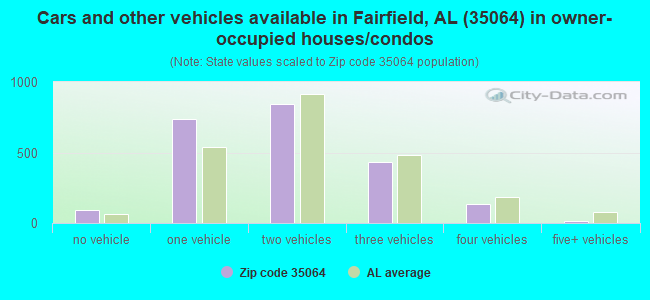
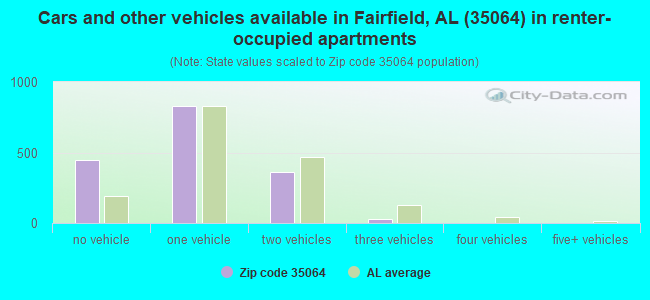
Houses and condos: 4,948 Renter-occupied apartments: 1,694
% of renters here:
43%
State:
30%
March 2022 cost of living index in zip code 35064: 86.9 (less than average, U.S. average is 100)
Land area: 4.1 sq. mi. Water area: 0.0 sq. mi.
Population density: 2,456 people per square mile
(low).
OSM Map
General Map
Google Map
MSN Map
OSM Map
General Map
Google Map
MSN Map
OSM Map
General Map
Google Map
MSN Map
OSM Map
General Map
Google Map
MSN Map
Please wait while loading the map...
Real estate property taxes paid for housing units in 2022:
This zip code:
0.7% ($940)
Alabama:
0.4% ($718)
Median real estate property taxes paid for housing units with mortgages in 2022: $969 (0.6%) Median real estate property taxes paid for housing units with no mortgage in 2022: $932 (0.8%)
Business Search- 14 Million verified businesses
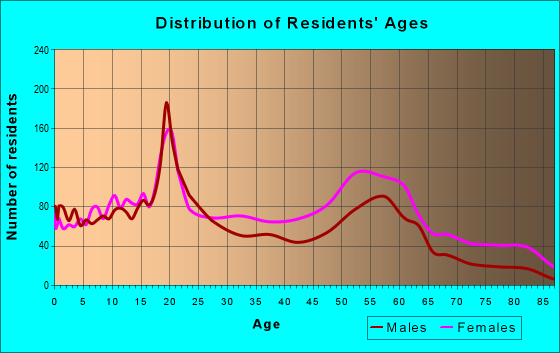
Males: 4,354
(43.2%)
Females: 5,734
(56.8%)
For population 25 years and over in 35064:
High school or higher: 96.3%
Bachelor's degree or higher: 24.3%
Graduate or professional degree: 7.7%
Unemployed: 6.5%
Mean travel time to work (commute): 23.8 minutes
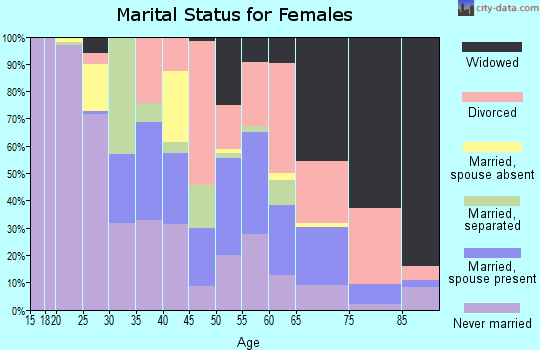
For population 15 years and over in 35064:
Never married: 48.0%
Now married: 28.1%
Separated: 2.8%
Widowed: 6.4%
Divorced: 14.6%
Zip code 35064 compared to state average:
Median house value below state average.
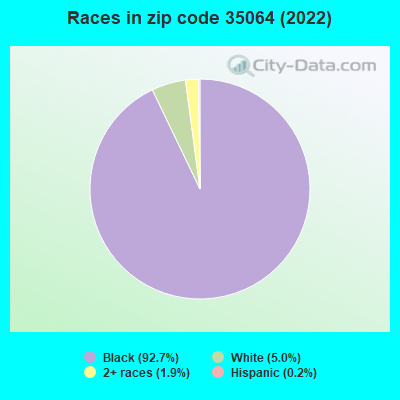
Black race population percentage significantly above state average.
Hispanic race population percentage significantly below state average.
Median age significantly below state average.
Foreign-born population percentage significantly below state average.
Length of stay since moving in significantly above state average.
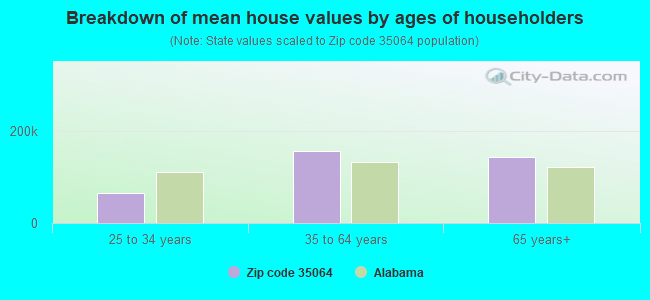
Estimated median house/condo value in 2022: $130,462
35064:
$130,462
Alabama:
$200,900
According to our research of Alabama and other state lists, there were 3 registered sex offenders living in 35064 zip code as of April 27, 2024. The ratio of all residents to sex offenders in zip code 35064 is 3,815 to 1. The ratio of registered sex offenders to all residents in this zip code is much lower than the state average.
Median resident age:
This zip code:
31.0 years
Alabama median age:
39.6 years
Average household size:
This zip code:
2.3 people
Alabama:
2.5 people
Averages for the 2020 tax year for zip code 35064, filed in 2021:
Average Adjusted Gross Income (AGI) in 2020: $34,874 (Individual Income Tax Returns)
Here:
$34,874
State:
$63,984
Salary/wage: $30,433 (reported on 82.9% of returns)
Here:
$30,433
State:
$52,834
(% of AGI for various income ranges: 1312.1% for AGIs below $25k, 3717.0% for AGIs $25k-50k, 7047.4% for AGIs $50k-75k, 10388.0% for AGIs $75k-100k, 18238.8% for AGIs $100k-200k)
Taxable interest for individuals: $538 (reported on 12.2% of returns)
This zip code:
$538
Alabama:
$1,615
(% of AGI for various income ranges: 2.8% for AGIs below $25k, 5.2% for AGIs $25k-50k, 25.8% for AGIs $50k-75k, 49.0% for AGIs $75k-100k, 63.7% for AGIs $100k-200k)
Ordinary dividends: $827 (reported on 3.5% of returns)
Here:
$827
State:
$7,660
(% of AGI for various income ranges: 0.5% for AGIs below $25k, 3.3% for AGIs $25k-50k, 4.5% for AGIs $50k-75k, 24.0% for AGIs $75k-100k, 53.8% for AGIs $100k-200k)
Net capital gain/loss in AGI: +$2,250 (reported on 2.3% of returns)
Here:
+$2,250
State:
+$23,528
(% of AGI for various income ranges: 0.4% for AGIs $25k-50k, 22.3% for AGIs $50k-75k, 190.0% for AGIs $100k-200k)
Taxable individual retirement arrangement distribution: $15,621 (reported on 4.4% of returns)
35064:
$15,621
Alabama:
$19,004
(% of AGI for various income ranges: 17.6% for AGIs below $25k, 43.6% for AGIs $25k-50k, 201.6% for AGIs $50k-75k, 727.0% for AGIs $75k-100k, 1052.5% for AGIs $100k-200k)
Total itemized deductions: $25,737 (reported on 6.2% of returns)
Here:
$25,737
State:
$37,338
(% of AGI for various income ranges: 34.3% for AGIs below $25k, 175.0% for AGIs $25k-50k, 561.3% for AGIs $50k-75k, 773.0% for AGIs $75k-100k, 2453.8% for AGIs $100k-200k)
Charity contributions: $9,519 (reported on 6.2% of returns)
Here:
$9,519
State:
$18,005
(% of AGI for various income ranges: 7.8% for AGIs below $25k, 53.0% for AGIs $25k-50k, 207.4% for AGIs $50k-75k, 335.0% for AGIs $75k-100k, 1110.0% for AGIs $100k-200k)
Taxes paid: $5,189 (reported on 6.2% of returns)
35064:
$5,189
State:
$6,484
(% of AGI for various income ranges: 3.8% for AGIs below $25k, 36.4% for AGIs $25k-50k, 124.5% for AGIs $50k-75k, 169.0% for AGIs $75k-100k, 488.8% for AGIs $100k-200k)
Earned income credit: $2,903 (reported on 35.0% of returns)
Here:
$2,903
State:
$2,628
(% of AGI for various income ranges: 191.1% for AGIs below $25k, 99.7% for AGIs $25k-50k)
Percentage of individuals using paid preparers for their 2020 taxes: 90.6%
Here:
91%
State:
93%
(% for various income ranges: 91.8% for AGIs below $25k, 90.6% for AGIs $25k-50k, 87.8% for AGIs $50k-75k, 90.0% for AGIs $75k-100k, 84.2% for AGIs $100k-200k)
Averages for the 2012 tax year for zip code 35064, filed in 2013:
Average Adjusted Gross Income (AGI) in 2012: $32,993 (Individual Income Tax Returns)
Here:
$32,993
State:
$52,001
Salary/wage: $29,704 (reported on 86.5% of returns)
Here:
$29,704
State:
$43,822
(% of AGI for various income ranges: 83.2% for AGIs below $25k, 83.7% for AGIs $25k-50k, 77.1% for AGIs $50k-75k, 70.4% for AGIs $75k-100k, 68.0% for AGIs $100k-200k)
Taxable interest for individuals: $638 (reported on 13.3% of returns)
This zip code:
$638
Alabama:
$1,592
(% of AGI for various income ranges: 0.3% for AGIs below $25k, 0.1% for AGIs $25k-50k, 0.3% for AGIs $50k-75k, 0.3% for AGIs $75k-100k, 0.4% for AGIs $100k-200k)
Ordinary dividends: $1,059 (reported on 4.6% of returns)
Here:
$1,059
State:
$5,697
(% of AGI for various income ranges: 0.2% for AGIs $25k-50k, 0.1% for AGIs $50k-75k, 0.2% for AGIs $75k-100k, 0.2% for AGIs $100k-200k)
Net capital gain/loss in AGI: +$438 (reported on 2.7% of returns)
Here:
+$438
State:
+$13,286
(% of AGI for various income ranges: 0.3% for AGIs $50k-75k)
Profit/loss from business: +$2,768 (reported on 16.6% of returns)
Here:
+$2,768
State:
+$9,151
(% of AGI for various income ranges: 6.2% for AGIs below $25k, 0.3% for AGIs $75k-100k, 0.8% for AGIs $100k-200k)
Taxable individual retirement arrangement distribution: $14,638 (reported on 4.4% of returns)
35064:
$14,638
Alabama:
$14,992
(% of AGI for various income ranges: 1.0% for AGIs below $25k, 1.3% for AGIs $25k-50k, 1.5% for AGIs $50k-75k, 3.8% for AGIs $75k-100k, 3.4% for AGIs $100k-200k)
Total itemized deductions: $16,908 (29% of AGI, reported on 30.5% of returns)
Here:
$16,908
State:
$21,388
Here:
29.0% of AGI
State:
20.1% of AGI
(% of AGI for various income ranges: 7.1% for AGIs below $25k, 16.5% for AGIs $25k-50k, 19.7% for AGIs $50k-75k, 20.9% for AGIs $75k-100k, 16.9% for AGIs $100k-200k)
Charity contributions: $5,718 (reported on 28.6% of returns)
Here:
$5,718
State:
$5,925
(% of AGI for various income ranges: 1.5% for AGIs below $25k, 4.4% for AGIs $25k-50k, 6.4% for AGIs $50k-75k, 7.6% for AGIs $75k-100k, 6.8% for AGIs $100k-200k)
Taxes paid: $3,510 (reported on 30.1% of returns)
35064:
$3,510
State:
$5,272
(% of AGI for various income ranges: 0.9% for AGIs below $25k, 3.0% for AGIs $25k-50k, 4.3% for AGIs $50k-75k, 4.6% for AGIs $75k-100k, 4.2% for AGIs $100k-200k)
Earned income credit: $2,982 (reported on 41.1% of returns)
Here:
$2,982
State:
$2,646
(% of AGI for various income ranges: 14.9% for AGIs below $25k, 1.4% for AGIs $25k-50k)
Percentage of individuals using paid preparers for their 2012 taxes: 59.2%
Here:
59%
State:
60%
(% for various income ranges: 61.3% for AGIs below $25k, 54.3% for AGIs $25k-50k, 56.2% for AGIs $50k-75k, 60.9% for AGIs $75k-100k, 66.7% for AGIs $100k-200k)
Averages for the 2004 tax year for zip code 35064, filed in 2005:
Average Adjusted Gross Income (AGI) in 2004: $29,699 (Individual Income Tax Returns)
Here:
$29,699
State:
$42,302
Salary/wage: $28,375 (reported on 90.7% of returns)
Here:
$28,375
State:
$36,626
(% of AGI for various income ranges: 88.6% for AGIs below $10k, 88.5% for AGIs $10k-25k, 88.5% for AGIs $25k-50k, 84.4% for AGIs $50k-75k, 82.9% for AGIs $75k-100k, 85.9% for AGIs over 100k)
Taxable interest for individuals: $913 (reported on 20.2% of returns)
This zip code:
$913
Alabama:
$1,827
(% of AGI for various income ranges: 1.6% for AGIs below $10k, 1.0% for AGIs $10k-25k, 0.5% for AGIs $25k-50k, 0.5% for AGIs $50k-75k, 0.4% for AGIs $75k-100k, 0.6% for AGIs over 100k)
Taxable dividends: $780 (reported on 6.7% of returns)
Here:
$780
State:
$4,206
(% of AGI for various income ranges: 0.3% for AGIs below $10k, 0.2% for AGIs $10k-25k, 0.2% for AGIs $25k-50k, 0.2% for AGIs $50k-75k, 0.2% for AGIs $75k-100k, 0.1% for AGIs over 100k)
Net capital gain/loss: +$315 (reported on 3.7% of returns)
Here:
+$315
State:
+$13,031
(% of AGI for various income ranges: -0.2% for AGIs below $10k, -0.1% for AGIs $10k-25k, 0.1% for AGIs $25k-50k, -0.0% for AGIs $50k-75k, 0.0% for AGIs $75k-100k, 0.4% for AGIs over 100k)
Profit/loss from business: +$829 (reported on 10.0% of returns)
Here:
+$829
State:
+$8,302
(% of AGI for various income ranges: 4.1% for AGIs below $10k, 1.1% for AGIs $10k-25k, -0.1% for AGIs $25k-50k, -0.4% for AGIs $50k-75k, 0.1% for AGIs $75k-100k, -0.0% for AGIs over 100k)
IRA payment deduction: $1,682 (reported on 0.9% of returns)
35064:
$1,682
Alabama:
$3,006
Total itemized deductions: $15,258 (30% of AGI, reported on 35.4% of returns)
Here:
$15,258
State:
$17,623
Here:
29.5% of AGI
State:
20.8% of AGI
(% of AGI for various income ranges: 6.7% for AGIs below $10k, 7.8% for AGIs $10k-25k, 20.4% for AGIs $25k-50k, 23.7% for AGIs $50k-75k, 22.6% for AGIs $75k-100k, 20.5% for AGIs over 100k)
Charity contributions deductions: $4,702 (9% of AGI, reported on 34.3% of returns)
Here:
$4,702
State:
$4,768
Here:
9.0% of AGI
State:
5.4% of AGI
(% of AGI for various income ranges: 0.4% for AGIs below $10k, 2.0% for AGIs $10k-25k, 5.7% for AGIs $25k-50k, 7.2% for AGIs $50k-75k, 7.6% for AGIs $75k-100k, 7.1% for AGIs over 100k)
Total tax: $3,341 (reported on 57.4% of returns)
35064:
$3,341
State:
$6,905
(% of AGI for various income ranges: 1.6% for AGIs below $10k, 2.0% for AGIs $10k-25k, 5.2% for AGIs $25k-50k, 8.7% for AGIs $50k-75k, 9.4% for AGIs $75k-100k, 12.5% for AGIs over 100k)
Earned income credit: $2,185 (reported on 37.8% of returns)
Here:
$2,185
State:
$2,048
Percentage of individuals using paid preparers for their 2004 taxes: 66.0%
Here:
66%
State:
65%
(% for various income ranges: 57.1% for AGIs below $10k, 71.8% for AGIs $10k-25k, 65.4% for AGIs $25k-50k, 64.6% for AGIs $50k-75k, 61.8% for AGIs $75k-100k, 70.9% for AGIs over 100k)
Likely homosexual households (counted as self-reported same-sex unmarried-partner households)
Lesbian couples: 0.1% of all households
Gay men: 0.0% of all households
Household received Food Stamps/SNAP in the past 12 months: 903 Household did not receive Food Stamps/SNAP in the past 12 months: 3,074
Women who had a birth in the past 12 months: 153 (54 now married, 81 unmarried) Women who did not have a birth in the past 12 months: 2,235 (393 now married, 1,847 unmarried)
Housing units in zip code 35064 with a mortgage: 1,136 (91 second mortgage, 58 both second mortgage and home equity loan) Houses without a mortgage: 68
Median monthly owner costs for units with a mortgage: $1,129 Median monthly owner costs for units without a mortgage: $451
Residents with income below the poverty level in 2022:
This zip code:
24.0%
Whole state:
16.2%
Residents with income below 50% of the poverty level in 2022:
This zip code:
12.3%
Whole state:
8.6%
Median number of rooms in houses and condos:
Here:
6.6
State:
6.5
Median number of rooms in apartments:
Here:
5.3
State:
4.7
Notable locations in this zip code not listed on our city pages
Notable locations in zip code 35064: Fairfield City Hall (A), Alabama Hall (B), Bell Building (C), Brown Hall (D), C A Kirkendoll Learning Resources Center (E), Knox-Windham Gymnasium (F), McKenzie Hall (G), Murchison Hall (H), Norton Student Center (I), Pitts Hall (J), Ramsay Hall (K), Taggart Hall (L), Williams Hall (M), Fairfield Fire Department (N), United States Steel Corporation Fairfield Works Fire Department (O). Display/hide their locations on the map
Churches in zip code 35064 include: Moody Christian Methodist Episcopal Church Temple (A), Fairfield First United Methodist Church (B), First Baptist Church of Fairfield (C), Fiftyfourth Street Church of God (D), Fairfield Presbyterian Church (E), Crumbley Bethel Baptist Church (F), Christ Episcopal Church (G), Antioch Baptist Church (H), Mount Pilgrim Baptist Church (I). Display/hide their locations on the map
In group quarters: 991 (-1 institutionalized population)
Size of family households: 817 2-persons, 869 3-persons, 298 4-persons, 231 5-persons, 16 6-persons, 43 7-or-more-persons
Size of nonfamily households: 1,665 1-person, 35 2-persons
387 married couples with children.
1,407 single-parent households (570 men, 837 women).
98.7% of residents of 35064 zip code speak English at home.
0.4% of residents speak Spanish at home (80% very well, 20% not at all).
0.5% of residents speak other Indo-European language at home (56% well, 44% not well).
Foreign born population: 75 (0.8%) (12.7% of them are naturalized citizens)
This zip code:
0.8%
Whole state:
3.8%
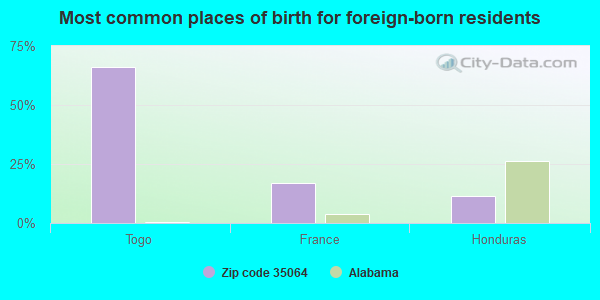
66%Togo
17%France
11%Honduras
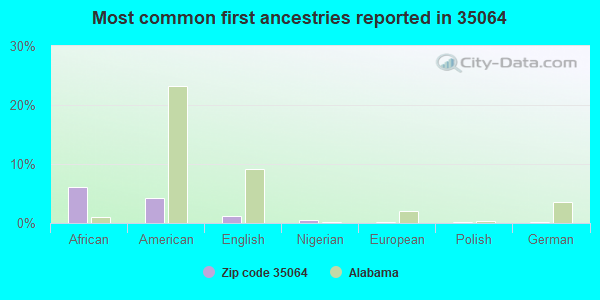
6%African
4%American
1%English
1%Nigerian
0%European
0%Polish
0%German
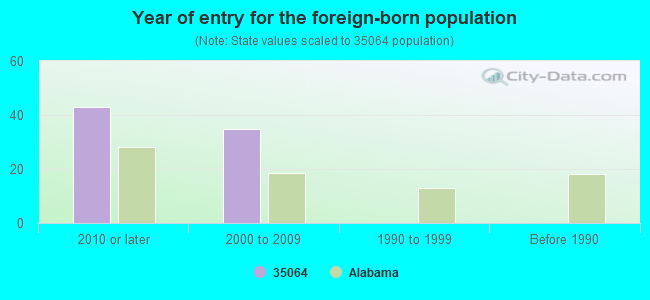
Year of entry for the foreign-born population
432010 or later
352000 to 2009
01990 to 1999
0Before 1990
Major facilities with environmental interests located in this zip code:
AIR LIQUIDE AMERICA (GATE 5 AND U.S. STEEL in FAIRFIELD, AL)
(Integrated Compliance Information System) - ICIS-06-2001-0066, FORMAL ENFORCEMENT ACTION, ICIS-04-2001-0068, Conditionally Exempt Small Quantity Generators, less than 100 kg/month of hazardous waste (Resource Conservation and Recovery Act (tracking hazardous waste)) TRI REPORTER (Tracking of toxic chemicals releasing facilities) Business SIC classification: INDUSTRIAL GASES Organizations: AIR LIQUIDE LARGE INDUSTRIES US LP (CONTACT/OPERATOR)
, AIR LIQUIDE AMERICA CORP (CONTACT/OWNER)
, AIR LIQUID LARGE INDUSTRIES US LP (CONTACT/OWNER)
Alternative names: AIR LIQUIDE AMERICA CORP FAIRFIELD AIR
PEROX (830 TIN MILL ROAD in FAIRFIELD, AL)
AIR MAJOR (AIRS/AFS) AIR SYNTHETIC MINOR (AIRS/AFS) COMPLIANCE ACTIVITY (Tracking inspections of insecticide, fungicide, and rodenticide, and toxic substances) CRITERIA AND HAZARDOUS AIR POLLUTANT INVENTORY (Inventory of air pollution sources) Conditionally Exempt Small Quantity Generators, less than 100 kg/month of hazardous waste (Resource Conservation and Recovery Act (tracking hazardous waste)) Business SIC classification: INDUSTRIAL INORGANIC CHEMICALS Business NAICS classification: INORGANIC DYE AND PIGMENT MANUFACTURING.; ALL OTHER BASIC INORGANIC CHEMICAL MANUFACTURING. Organizations: BAILEY-PVS OXIDES LLC (CONTACT/OPERATOR)
Alternative names: BAILEY ENGINEERS, BAILEY-PVS OXIDES L.L.C., BAILEY-PVS OXIDES, LLC
ROBINSON ELEMENTARY SCHOOL (301 61ST ST in FAIRFIELD, AL)
(National Center for Education Statistics) - STATE ID-0050 Organizations: FAIRFIELD CITY (SCHOOL DISTRICT)
FAIRFIELD ALTERNATIVE SCHOOL (6405 AVE D in FAIRFIELD, AL)
(National Center for Education Statistics) - STATE ID-0015 Organizations: FAIRFIELD CITY (SCHOOL DISTRICT)
FAIRFIELD AREA VOCATIONAL SCHOOL (610 VALLEY RD in FAIRFIELD, AL)
(National Center for Education Statistics) - STATE ID-6000 Organizations: FAIRFIELD CITY (SCHOOL DISTRICT)
FAIRFIELD HIGH PREPARATORY SCHOOL (610 VALLEY RD in FAIRFIELD, AL)
(National Center for Education Statistics) - STATE ID-0020 Organizations: FAIRFIELD CITY (SCHOOL DISTRICT)
BIRMINGHAM ROLL SERVICE DIV (5700 VALLEY ROAD in FAIRFIELD, AL)
HAZARDOUS WASTE BIENNIAL REPORTER (Resource Conservation and Recovery Act (tracking hazardous waste)) Large Quantity Generators, more that 1000 kg of hazardous waste/month (Resource Conservation and Recovery Act (tracking hazardous waste)) Business NAICS classification: ELECTROPLATING, PLATING, POLISHING, ANODIZING, AND COLORING. Organizations: CHROME DEPOSIT CORPORATION (CONTACT/OPERATOR)
BIRMINGHAM SOUTHERN RAILROAD CO (6200 FLINTRIDGE RD in FAIRFIELD, AL)
PENSKE AUTO CENTER (6500 AARON ARONOV DR BLDG A in FAIRFIELD, AL)
(Resource Conservation and Recovery Act (tracking hazardous waste)) Organizations: PENSKE AUTO CENTER INC (CONTACT/OWNER)
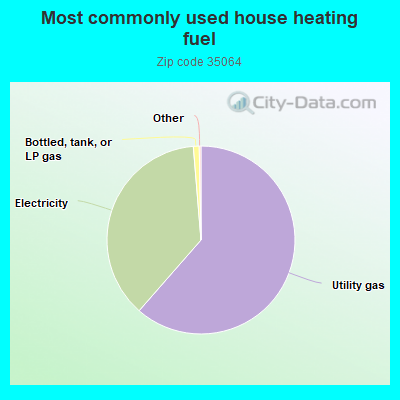
Housing units lacking complete plumbing facilities: 7.1% Housing units lacking complete kitchen facilities: 7.4%
61.5%Utility gas
37.3%Electricity
1.0%Bottled, tank, or LP gas
Population in 1990: 12,106. Population change in the 1990s: +773 (+6.4%).
Place of birth for U.S.-born residents:
This state: 8,860
Northeast: 94
Midwest: 240
South: 655
West: 64
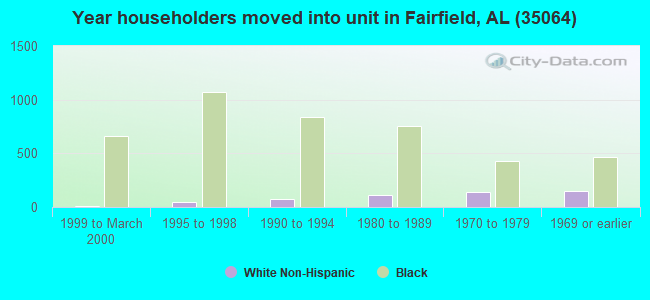
65% of the 35064 zip code residents lived in the same house 5 years ago. Out of people who lived in different houses, 82% lived in this county. Out of people who lived in different counties, 50% lived in Alabama.
94% of the 35064 zip code residents lived in the same house 1 year ago. Out of people who lived in different houses, 83% moved from this county. Out of people who lived in different houses, 4% moved from different county within same state. Out of people who lived in different houses, 8% moved from different state.
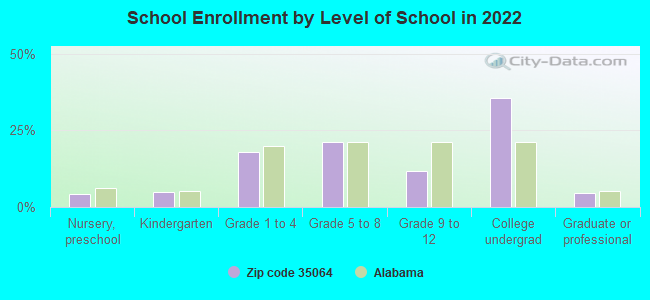
Private vs. public school enrollment:
Students in private schools in grades 1 to 8 (elementary and middle school): 253
Here:
20.3%
Alabama:
14.7%
Students in private schools in grades 9 to 12 (high school): 22
Here:
6.1%
Alabama:
16.3%
Students in private undergraduate colleges: 620
Here:
55.9%
Alabama:
14.6%
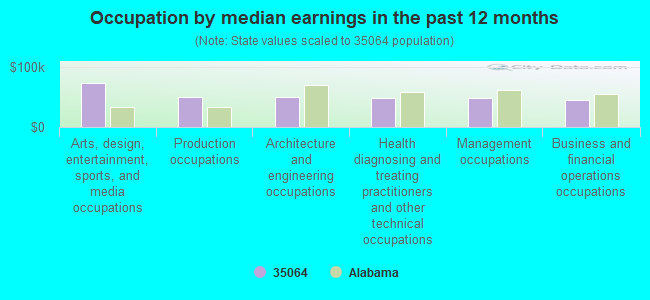
Occupation by median earnings in the past 12 months ($)
73,722Arts, design, entertainment, sports, and media occupations
49,643Production occupations
49,428Architecture and engineering occupations
48,998Health diagnosing and treating practitioners and other technical occupations
47,991Management occupations
45,998Business and financial operations occupations
Companies with federal contracts located in this zip code (FAIRFIELD, AL):
ALABAMA SPRINKLER CO INC (753 DONALD PKWY; small business) : $131,223 in 6 contractsfrom 2004 to 2005
Contracts for Technical Representation Services -- Fire Control Equipment by Army Signed by year:2000: $0; 2001: $0; 2002: $0; 2003: $0; 2004: $80,580; 2005: $50,643; 2006: $0.
Biggest contracts:
$45,602 with Army for Technical Representation Services -- Fire Control Equipment. Signed on 2005-09-21. Completion date: 2004-03-31.
$40,000, same as above.Signed on 2004-02-19. Completion date: 2004-03-31.
$23,019, same as above.Signed on 2004-12-30. Completion date: 2004-03-31.
$13,647, same as above.Signed on 2004-07-21. Completion date: 2004-03-31.
MILES COLLEGE (5500 MYRON MASSEY BLVD)
$69,581 with U.S. Army Corps of Engineers - civil program financing only for Historical Studies. Signed on 2002-12-30. Completion date: 2004-03-10.
SPECIALTY PRODUCTS INC (748 DONALD PKWY; small business) : $57,110 in 3 contractsfrom 2004 to 2005
$44,100 with Army for Miscellaneous Maintenance and Repair Shop Specialized Equipment. Signed on 2005-01-13. Completion date: 2005-01-24.
$9,495 with Army for Clothing, Special Purpose. Signed on 2004-08-23. Completion date: 2004-09-08.
$3,515 with Army for Laboratory Equipment and Supplies. Signed on 2005-05-20. Completion date: 2005-06-05.
BIRMINGHAM INDUSTRIAL PAINTING (3801 COMMERCE AVENUE; small business) : $47,958 in 2 contractsfrom 1999 to 2000
$29,958 with U.S. Army Corps of Engineers - civil program financing only for Maintenance, Repair or Alteration of Real Property -- Other Conservation and Development Facilities. Taking place in TN. Signed on 1999-10-20. Completion date: 1999-10-29.
$18,000 with U.S. Army Corps of Engineers - civil program financing only for Maintenance, Repair and Rebuilding of Equipment -- Ships, Small Craft, Pontoons, and Floating Docks. Signed on 2000-01-25. Completion date: 2000-02-04.
ENK INDUSTRIAL FILTER & BATTER (4420 VETERANS MEMORIAL DR; small business) : $20,041 in 3 contractsfrom 2005 to 2006
$13,143 with Army for Miscellaneous Electric Power and Distribution Equipment. Signed on 2006-05-25. Completion date: 2006-06-14.
$3,673 with Army for Batteries, Nonrechargeable. Signed on 2005-12-29. Completion date: 2006-01-28.
$3,225, same as above.Signed on 2005-11-04. Completion date: 2005-11-17.
Top industries in this zip code by the number of employees in 2005:
Administrative and Support and Waste Management and Remediation Services: Telemarketing Bureaus (500-999 employees: 1 establishment, 1-4 employees: 1 establishment)
Educational Services: Colleges, Universities, and Professional Schools (250-499: 1, 20-49: 1)
2002 - 2018 National Fire Incident Reporting System (NFIRS) incidents
According to the data from the years 2002 - 2018 the average number of fires per year is 16. The highest number of fire incidents - 54 took place in 2012, and the least - 0 in 2004. The data has a growing trend.
When looking into fire subcategories, the most reports belonged to: Structure Fires (45.5%), and Outside Fires (28.4%).
Fire incident types reported to NFIRS in Zip Code 35064


 Nearest zip codes: 35228, 35221, 35061, 35218, 35208, 35224.


 According to the data from the years 2002 - 2018 the average number of fires per year is 16. The highest number of fire incidents - 54 took place in 2012, and the least - 0 in 2004. The data has a growing trend.
 When looking into fire subcategories, the most reports belonged to: Structure Fires (45.5%), and Outside Fires (28.4%).