Estimated zip code population in 2022: 14,763
Zip code population in 2010: 14,855
Zip code population in 2000: 17,572
Houses and condos: 7,623
Renter-occupied apartments: 2,299
% of renters here:
38%State:
30%
March 2022 cost of living index in zip code 35208: 86.6
(less than average, U.S. average is 100)
Land area: 3.5
sq. mi.
Water area: 0.0
sq. mi.
Population density: 4,178 people per square mile (average).
OSM Map
General Map
Google Map
MSN Map
OSM Map
General Map
Google Map
MSN Map
OSM Map
General Map
Google Map
MSN Map
OSM Map
General Map
Google Map
MSN Map
Please wait while loading the map...
Real estate property taxes paid for housing units in 2022:
This zip code:
0.6% ($576)Alabama:
0.4% ($718)
Median real estate property taxes paid for housing units with mortgages in 2022: $608 (0.6%)
Median real estate property taxes paid for housing units with no mortgage in 2022: $541 (0.7%)
Profiles of local businesses
Business Search - 14 Million verified businesses
Males: 6,802 Females: 7,963
For population 25 years and over in 35208:
High school or higher: 88.0%Bachelor's degree or higher: 17.0%Graduate or professional degree: 4.5%Unemployed: 6.8%Mean travel time to work (commute): 24.1 minutes
For population 15 years and over in 35208:
Never married: 39.8%Now married: 32.2%Separated: 3.0%Widowed: 10.1%Divorced: 14.9%
Zip code 35208 compared to state average:
Median household income below state average. Median house value below state average. Black race population percentage significantly above state average. Hispanic race population percentage below state average. Length of stay since moving in significantly above state average. House age significantly above state average. Percentage of population with a bachelor's degree or higher below state average. 13,749 93.1% Black 593 4.0% White 297 2.0% Hispanic or Latino 123 0.8% Two or more races
Data:
Median household income ($)
Median household income (% change since 2000)
Household income diversity
Ratio of average income to average house value (%)
Ratio of average income to average rent
Median household income ($) - White
Median household income ($) - Black or African American
Median household income ($) - Asian
Median household income ($) - Hispanic or Latino
Median household income ($) - American Indian and Alaska Native
Median household income ($) - Multirace
Median household income ($) - Other Race
Median household income for houses/condos with a mortgage ($)
Median household income for apartments without a mortgage ($)
Races - White alone (%)
Races - White alone (% change since 2000)
Races - Black alone (%)
Races - Black alone (% change since 2000)
Races - American Indian alone (%)
Races - American Indian alone (% change since 2000)
Races - Asian alone (%)
Races - Asian alone (% change since 2000)
Races - Hispanic (%)
Races - Hispanic (% change since 2000)
Races - Native Hawaiian and Other Pacific Islander alone (%)
Races - Native Hawaiian and Other Pacific Islander alone (% change since 2000)
Races - Two or more races (%)
Races - Two or more races (% change since 2000)
Races - Other race alone (%)
Races - Other race alone (% change since 2000)
Racial diversity
Unemployment (%)
Unemployment (% change since 2000)
Unemployment (%) - White
Unemployment (%) - Black or African American
Unemployment (%) - Asian
Unemployment (%) - Hispanic or Latino
Unemployment (%) - American Indian and Alaska Native
Unemployment (%) - Multirace
Unemployment (%) - Other Race
Population density (people per square mile)
Population - Males (%)
Population - Females (%)
Population - Males (%) - White
Population - Males (%) - Black or African American
Population - Males (%) - Asian
Population - Males (%) - Hispanic or Latino
Population - Males (%) - American Indian and Alaska Native
Population - Males (%) - Multirace
Population - Males (%) - Other Race
Population - Females (%) - White
Population - Females (%) - Black or African American
Population - Females (%) - Asian
Population - Females (%) - Hispanic or Latino
Population - Females (%) - American Indian and Alaska Native
Population - Females (%) - Multirace
Population - Females (%) - Other Race
Coronavirus confirmed cases (Apr 27, 2024)
Deaths caused by coronavirus (Apr 27, 2024)
Coronavirus confirmed cases (per 100k population) (Apr 27, 2024)
Deaths caused by coronavirus (per 100k population) (Apr 27, 2024)
Daily increase in number of cases (Apr 27, 2024)
Weekly increase in number of cases (Apr 27, 2024)
Cases doubled (in days) (Apr 27, 2024)
Hospitalized patients (Apr 18, 2022)
Negative test results (Apr 18, 2022)
Total test results (Apr 18, 2022)
COVID Vaccine doses distributed (per 100k population) (Sep 19, 2023)
COVID Vaccine doses administered (per 100k population) (Sep 19, 2023)
COVID Vaccine doses distributed (Sep 19, 2023)
COVID Vaccine doses administered (Sep 19, 2023)
Likely homosexual households (%)
Likely homosexual households (% change since 2000)
Likely homosexual households - Lesbian couples (%)
Likely homosexual households - Lesbian couples (% change since 2000)
Likely homosexual households - Gay men (%)
Likely homosexual households - Gay men (% change since 2000)
Cost of living index
Median gross rent ($)
Median contract rent ($)
Median monthly housing costs ($)
Median house or condo value ($)
Median house or condo value ($ change since 2000)
Mean house or condo value by units in structure - 1, detached ($)
Mean house or condo value by units in structure - 1, attached ($)
Mean house or condo value by units in structure - 2 ($)
Mean house or condo value by units in structure by units in structure - 3 or 4 ($)
Mean house or condo value by units in structure - 5 or more ($)
Mean house or condo value by units in structure - Boat, RV, van, etc. ($)
Mean house or condo value by units in structure - Mobile home ($)
Median house or condo value ($) - White
Median house or condo value ($) - Black or African American
Median house or condo value ($) - Asian
Median house or condo value ($) - Hispanic or Latino
Median house or condo value ($) - American Indian and Alaska Native
Median house or condo value ($) - Multirace
Median house or condo value ($) - Other Race
Median resident age
Resident age diversity
Median resident age - Males
Median resident age - Females
Median resident age - White
Median resident age - Black or African American
Median resident age - Asian
Median resident age - Hispanic or Latino
Median resident age - American Indian and Alaska Native
Median resident age - Multirace
Median resident age - Other Race
Median resident age - Males - White
Median resident age - Males - Black or African American
Median resident age - Males - Asian
Median resident age - Males - Hispanic or Latino
Median resident age - Males - American Indian and Alaska Native
Median resident age - Males - Multirace
Median resident age - Males - Other Race
Median resident age - Females - White
Median resident age - Females - Black or African American
Median resident age - Females - Asian
Median resident age - Females - Hispanic or Latino
Median resident age - Females - American Indian and Alaska Native
Median resident age - Females - Multirace
Median resident age - Females - Other Race
Commute - mean travel time to work (minutes)
Travel time to work - Less than 5 minutes (%)
Travel time to work - Less than 5 minutes (% change since 2000)
Travel time to work - 5 to 9 minutes (%)
Travel time to work - 5 to 9 minutes (% change since 2000)
Travel time to work - 10 to 19 minutes (%)
Travel time to work - 10 to 19 minutes (% change since 2000)
Travel time to work - 20 to 29 minutes (%)
Travel time to work - 20 to 29 minutes (% change since 2000)
Travel time to work - 30 to 39 minutes (%)
Travel time to work - 30 to 39 minutes (% change since 2000)
Travel time to work - 40 to 59 minutes (%)
Travel time to work - 40 to 59 minutes (% change since 2000)
Travel time to work - 60 to 89 minutes (%)
Travel time to work - 60 to 89 minutes (% change since 2000)
Travel time to work - 90 or more minutes (%)
Travel time to work - 90 or more minutes (% change since 2000)
Marital status - Never married (%)
Marital status - Now married (%)
Marital status - Separated (%)
Marital status - Widowed (%)
Marital status - Divorced (%)
Median family income ($)
Median family income (% change since 2000)
Median non-family income ($)
Median non-family income (% change since 2000)
Median per capita income ($)
Median per capita income (% change since 2000)
Median family income ($) - White
Median family income ($) - Black or African American
Median family income ($) - Asian
Median family income ($) - Hispanic or Latino
Median family income ($) - American Indian and Alaska Native
Median family income ($) - Multirace
Median family income ($) - Other Race
Median year house/condo built
Median year apartment built
Year house built - Built 2005 or later (%)
Year house built - Built 2000 to 2004 (%)
Year house built - Built 1990 to 1999 (%)
Year house built - Built 1980 to 1989 (%)
Year house built - Built 1970 to 1979 (%)
Year house built - Built 1960 to 1969 (%)
Year house built - Built 1950 to 1959 (%)
Year house built - Built 1940 to 1949 (%)
Year house built - Built 1939 or earlier (%)
Average household size
Household density (households per square mile)
Average household size - White
Average household size - Black or African American
Average household size - Asian
Average household size - Hispanic or Latino
Average household size - American Indian and Alaska Native
Average household size - Multirace
Average household size - Other Race
Occupied housing units (%)
Vacant housing units (%)
Owner occupied housing units (%)
Renter occupied housing units (%)
Vacancy status - For rent (%)
Vacancy status - For sale only (%)
Vacancy status - Rented or sold, not occupied (%)
Vacancy status - For seasonal, recreational, or occasional use (%)
Vacancy status - For migrant workers (%)
Vacancy status - Other vacant (%)
Residents with income below the poverty level (%)
Residents with income below 50% of the poverty level (%)
Children below poverty level (%)
Poor families by family type - Married-couple family (%)
Poor families by family type - Male, no wife present (%)
Poor families by family type - Female, no husband present (%)
Poverty status for native-born residents (%)
Poverty status for foreign-born residents (%)
Poverty among high school graduates not in families (%)
Poverty among people who did not graduate high school not in families (%)
Residents with income below the poverty level (%) - White
Residents with income below the poverty level (%) - Black or African American
Residents with income below the poverty level (%) - Asian
Residents with income below the poverty level (%) - Hispanic or Latino
Residents with income below the poverty level (%) - American Indian and Alaska Native
Residents with income below the poverty level (%) - Multirace
Residents with income below the poverty level (%) - Other Race
Air pollution - Air Quality Index (AQI)
Air pollution - CO
Air pollution - NO2
Air pollution - SO2
Air pollution - Ozone
Air pollution - PM10
Air pollution - PM25
Air pollution - Pb
Crime - Murders per 100,000 population
Crime - Rapes per 100,000 population
Crime - Robberies per 100,000 population
Crime - Assaults per 100,000 population
Crime - Burglaries per 100,000 population
Crime - Thefts per 100,000 population
Crime - Auto thefts per 100,000 population
Crime - Arson per 100,000 population
Crime - City-data.com crime index
Crime - Violent crime index
Crime - Property crime index
Crime - Murders per 100,000 population (5 year average)
Crime - Rapes per 100,000 population (5 year average)
Crime - Robberies per 100,000 population (5 year average)
Crime - Assaults per 100,000 population (5 year average)
Crime - Burglaries per 100,000 population (5 year average)
Crime - Thefts per 100,000 population (5 year average)
Crime - Auto thefts per 100,000 population (5 year average)
Crime - Arson per 100,000 population (5 year average)
Crime - City-data.com crime index (5 year average)
Crime - Violent crime index (5 year average)
Crime - Property crime index (5 year average)
1996 Presidential Elections Results (%) - Democratic Party (Clinton)
1996 Presidential Elections Results (%) - Republican Party (Dole)
1996 Presidential Elections Results (%) - Other
2000 Presidential Elections Results (%) - Democratic Party (Gore)
2000 Presidential Elections Results (%) - Republican Party (Bush)
2000 Presidential Elections Results (%) - Other
2004 Presidential Elections Results (%) - Democratic Party (Kerry)
2004 Presidential Elections Results (%) - Republican Party (Bush)
2004 Presidential Elections Results (%) - Other
2008 Presidential Elections Results (%) - Democratic Party (Obama)
2008 Presidential Elections Results (%) - Republican Party (McCain)
2008 Presidential Elections Results (%) - Other
2012 Presidential Elections Results (%) - Democratic Party (Obama)
2012 Presidential Elections Results (%) - Republican Party (Romney)
2012 Presidential Elections Results (%) - Other
2016 Presidential Elections Results (%) - Democratic Party (Clinton)
2016 Presidential Elections Results (%) - Republican Party (Trump)
2016 Presidential Elections Results (%) - Other
2020 Presidential Elections Results (%) - Democratic Party (Biden)
2020 Presidential Elections Results (%) - Republican Party (Trump)
2020 Presidential Elections Results (%) - Other
Ancestries Reported - Arab (%)
Ancestries Reported - Czech (%)
Ancestries Reported - Danish (%)
Ancestries Reported - Dutch (%)
Ancestries Reported - English (%)
Ancestries Reported - French (%)
Ancestries Reported - French Canadian (%)
Ancestries Reported - German (%)
Ancestries Reported - Greek (%)
Ancestries Reported - Hungarian (%)
Ancestries Reported - Irish (%)
Ancestries Reported - Italian (%)
Ancestries Reported - Lithuanian (%)
Ancestries Reported - Norwegian (%)
Ancestries Reported - Polish (%)
Ancestries Reported - Portuguese (%)
Ancestries Reported - Russian (%)
Ancestries Reported - Scotch-Irish (%)
Ancestries Reported - Scottish (%)
Ancestries Reported - Slovak (%)
Ancestries Reported - Subsaharan African (%)
Ancestries Reported - Swedish (%)
Ancestries Reported - Swiss (%)
Ancestries Reported - Ukrainian (%)
Ancestries Reported - United States (%)
Ancestries Reported - Welsh (%)
Ancestries Reported - West Indian (%)
Ancestries Reported - Other (%)
Educational Attainment - No schooling completed (%)
Educational Attainment - Less than high school (%)
Educational Attainment - High school or equivalent (%)
Educational Attainment - Less than 1 year of college (%)
Educational Attainment - 1 or more years of college (%)
Educational Attainment - Associate degree (%)
Educational Attainment - Bachelor's degree (%)
Educational Attainment - Master's degree (%)
Educational Attainment - Professional school degree (%)
Educational Attainment - Doctorate degree (%)
School Enrollment - Nursery, preschool (%)
School Enrollment - Kindergarten (%)
School Enrollment - Grade 1 to 4 (%)
School Enrollment - Grade 5 to 8 (%)
School Enrollment - Grade 9 to 12 (%)
School Enrollment - College undergrad (%)
School Enrollment - Graduate or professional (%)
School Enrollment - Not enrolled in school (%)
School enrollment - Public schools (%)
School enrollment - Private schools (%)
School enrollment - Not enrolled (%)
Median number of rooms in houses and condos
Median number of rooms in apartments
Housing units lacking complete plumbing facilities (%)
Housing units lacking complete kitchen facilities (%)
Density of houses
Urban houses (%)
Rural houses (%)
Households with people 60 years and over (%)
Households with people 65 years and over (%)
Households with people 75 years and over (%)
Households with one or more nonrelatives (%)
Households with no nonrelatives (%)
Population in households (%)
Family households (%)
Nonfamily households (%)
Population in families (%)
Family households with own children (%)
Median number of bedrooms in owner occupied houses
Mean number of bedrooms in owner occupied houses
Median number of bedrooms in renter occupied houses
Mean number of bedrooms in renter occupied houses
Median number of vehichles in owner occupied houses
Mean number of vehichles in owner occupied houses
Median number of vehichles in renter occupied houses
Mean number of vehichles in renter occupied houses
Mortgage status - with mortgage (%)
Mortgage status - with second mortgage (%)
Mortgage status - with home equity loan (%)
Mortgage status - with both second mortgage and home equity loan (%)
Mortgage status - without a mortgage (%)
Average family size
Average family size - White
Average family size - Black or African American
Average family size - Asian
Average family size - Hispanic or Latino
Average family size - American Indian and Alaska Native
Average family size - Multirace
Average family size - Other Race
Geographical mobility - Same house 1 year ago (%)
Geographical mobility - Moved within same county (%)
Geographical mobility - Moved from different county within same state (%)
Geographical mobility - Moved from different state (%)
Geographical mobility - Moved from abroad (%)
Place of birth - Born in state of residence (%)
Place of birth - Born in other state (%)
Place of birth - Native, outside of US (%)
Place of birth - Foreign born (%)
Housing units in structures - 1, detached (%)
Housing units in structures - 1, attached (%)
Housing units in structures - 2 (%)
Housing units in structures - 3 or 4 (%)
Housing units in structures - 5 to 9 (%)
Housing units in structures - 10 to 19 (%)
Housing units in structures - 20 to 49 (%)
Housing units in structures - 50 or more (%)
Housing units in structures - Mobile home (%)
Housing units in structures - Boat, RV, van, etc. (%)
House/condo owner moved in on average (years ago)
Renter moved in on average (years ago)
Year householder moved into unit - Moved in 1999 to March 2000 (%)
Year householder moved into unit - Moved in 1995 to 1998 (%)
Year householder moved into unit - Moved in 1990 to 1994 (%)
Year householder moved into unit - Moved in 1980 to 1989 (%)
Year householder moved into unit - Moved in 1970 to 1979 (%)
Year householder moved into unit - Moved in 1969 or earlier (%)
Means of transportation to work - Drove car alone (%)
Means of transportation to work - Carpooled (%)
Means of transportation to work - Public transportation (%)
Means of transportation to work - Bus or trolley bus (%)
Means of transportation to work - Streetcar or trolley car (%)
Means of transportation to work - Subway or elevated (%)
Means of transportation to work - Railroad (%)
Means of transportation to work - Ferryboat (%)
Means of transportation to work - Taxicab (%)
Means of transportation to work - Motorcycle (%)
Means of transportation to work - Bicycle (%)
Means of transportation to work - Walked (%)
Means of transportation to work - Other means (%)
Working at home (%)
Industry diversity
Most Common Industries - Agriculture, forestry, fishing and hunting, and mining (%)
Most Common Industries - Agriculture, forestry, fishing and hunting (%)
Most Common Industries - Mining, quarrying, and oil and gas extraction (%)
Most Common Industries - Construction (%)
Most Common Industries - Manufacturing (%)
Most Common Industries - Wholesale trade (%)
Most Common Industries - Retail trade (%)
Most Common Industries - Transportation and warehousing, and utilities (%)
Most Common Industries - Transportation and warehousing (%)
Most Common Industries - Utilities (%)
Most Common Industries - Information (%)
Most Common Industries - Finance and insurance, and real estate and rental and leasing (%)
Most Common Industries - Finance and insurance (%)
Most Common Industries - Real estate and rental and leasing (%)
Most Common Industries - Professional, scientific, and management, and administrative and waste management services (%)
Most Common Industries - Professional, scientific, and technical services (%)
Most Common Industries - Management of companies and enterprises (%)
Most Common Industries - Administrative and support and waste management services (%)
Most Common Industries - Educational services, and health care and social assistance (%)
Most Common Industries - Educational services (%)
Most Common Industries - Health care and social assistance (%)
Most Common Industries - Arts, entertainment, and recreation, and accommodation and food services (%)
Most Common Industries - Arts, entertainment, and recreation (%)
Most Common Industries - Accommodation and food services (%)
Most Common Industries - Other services, except public administration (%)
Most Common Industries - Public administration (%)
Occupation diversity
Most Common Occupations - Management, business, science, and arts occupations (%)
Most Common Occupations - Management, business, and financial occupations (%)
Most Common Occupations - Management occupations (%)
Most Common Occupations - Business and financial operations occupations (%)
Most Common Occupations - Computer, engineering, and science occupations (%)
Most Common Occupations - Computer and mathematical occupations (%)
Most Common Occupations - Architecture and engineering occupations (%)
Most Common Occupations - Life, physical, and social science occupations (%)
Most Common Occupations - Education, legal, community service, arts, and media occupations (%)
Most Common Occupations - Community and social service occupations (%)
Most Common Occupations - Legal occupations (%)
Most Common Occupations - Education, training, and library occupations (%)
Most Common Occupations - Arts, design, entertainment, sports, and media occupations (%)
Most Common Occupations - Healthcare practitioners and technical occupations (%)
Most Common Occupations - Health diagnosing and treating practitioners and other technical occupations (%)
Most Common Occupations - Health technologists and technicians (%)
Most Common Occupations - Service occupations (%)
Most Common Occupations - Healthcare support occupations (%)
Most Common Occupations - Protective service occupations (%)
Most Common Occupations - Fire fighting and prevention, and other protective service workers including supervisors (%)
Most Common Occupations - Law enforcement workers including supervisors (%)
Most Common Occupations - Food preparation and serving related occupations (%)
Most Common Occupations - Building and grounds cleaning and maintenance occupations (%)
Most Common Occupations - Personal care and service occupations (%)
Most Common Occupations - Sales and office occupations (%)
Most Common Occupations - Sales and related occupations (%)
Most Common Occupations - Office and administrative support occupations (%)
Most Common Occupations - Natural resources, construction, and maintenance occupations (%)
Most Common Occupations - Farming, fishing, and forestry occupations (%)
Most Common Occupations - Construction and extraction occupations (%)
Most Common Occupations - Installation, maintenance, and repair occupations (%)
Most Common Occupations - Production, transportation, and material moving occupations (%)
Most Common Occupations - Production occupations (%)
Most Common Occupations - Transportation occupations (%)
Most Common Occupations - Material moving occupations (%)
People in Group quarters - Institutionalized population (%)
People in Group quarters - Correctional institutions (%)
People in Group quarters - Federal prisons and detention centers (%)
People in Group quarters - Halfway houses (%)
People in Group quarters - Local jails and other confinement facilities (including police lockups) (%)
People in Group quarters - Military disciplinary barracks (%)
People in Group quarters - State prisons (%)
People in Group quarters - Other types of correctional institutions (%)
People in Group quarters - Nursing homes (%)
People in Group quarters - Hospitals/wards, hospices, and schools for the handicapped (%)
People in Group quarters - Hospitals/wards and hospices for chronically ill (%)
People in Group quarters - Hospices or homes for chronically ill (%)
People in Group quarters - Military hospitals or wards for chronically ill (%)
People in Group quarters - Other hospitals or wards for chronically ill (%)
People in Group quarters - Hospitals or wards for drug/alcohol abuse (%)
People in Group quarters - Mental (Psychiatric) hospitals or wards (%)
People in Group quarters - Schools, hospitals, or wards for the mentally retarded (%)
People in Group quarters - Schools, hospitals, or wards for the physically handicapped (%)
People in Group quarters - Institutions for the deaf (%)
People in Group quarters - Institutions for the blind (%)
People in Group quarters - Orthopedic wards and institutions for the physically handicapped (%)
People in Group quarters - Wards in general hospitals for patients who have no usual home elsewhere (%)
People in Group quarters - Wards in military hospitals for patients who have no usual home elsewhere (%)
People in Group quarters - Juvenile institutions (%)
People in Group quarters - Long-term care (%)
People in Group quarters - Homes for abused, dependent, and neglected children (%)
People in Group quarters - Residential treatment centers for emotionally disturbed children (%)
People in Group quarters - Training schools for juvenile delinquents (%)
People in Group quarters - Short-term care, detention or diagnostic centers for delinquent children (%)
People in Group quarters - Type of juvenile institution unknown (%)
People in Group quarters - Noninstitutionalized population (%)
People in Group quarters - College dormitories (includes college quarters off campus) (%)
People in Group quarters - Military quarters (%)
People in Group quarters - On base (%)
People in Group quarters - Barracks, unaccompanied personnel housing (UPH), (Enlisted/Officer), ;and similar group living quarters for military personnel (%)
People in Group quarters - Transient quarters for temporary residents (%)
People in Group quarters - Military ships (%)
People in Group quarters - Group homes (%)
People in Group quarters - Homes or halfway houses for drug/alcohol abuse (%)
People in Group quarters - Homes for the mentally ill (%)
People in Group quarters - Homes for the mentally retarded (%)
People in Group quarters - Homes for the physically handicapped (%)
People in Group quarters - Other group homes (%)
People in Group quarters - Religious group quarters (%)
People in Group quarters - Dormitories (%)
People in Group quarters - Agriculture workers' dormitories on farms (%)
People in Group quarters - Job Corps and vocational training facilities (%)
People in Group quarters - Other workers' dormitories (%)
People in Group quarters - Crews of maritime vessels (%)
People in Group quarters - Other nonhousehold living situations (%)
People in Group quarters - Other noninstitutional group quarters (%)
Residents speaking English at home (%)
Residents speaking English at home - Born in the United States (%)
Residents speaking English at home - Native, born elsewhere (%)
Residents speaking English at home - Foreign born (%)
Residents speaking Spanish at home (%)
Residents speaking Spanish at home - Born in the United States (%)
Residents speaking Spanish at home - Native, born elsewhere (%)
Residents speaking Spanish at home - Foreign born (%)
Residents speaking other language at home (%)
Residents speaking other language at home - Born in the United States (%)
Residents speaking other language at home - Native, born elsewhere (%)
Residents speaking other language at home - Foreign born (%)
Class of Workers - Employee of private company (%)
Class of Workers - Self-employed in own incorporated business (%)
Class of Workers - Private not-for-profit wage and salary workers (%)
Class of Workers - Local government workers (%)
Class of Workers - State government workers (%)
Class of Workers - Federal government workers (%)
Class of Workers - Self-employed workers in own not incorporated business and Unpaid family workers (%)
House heating fuel used in houses and condos - Utility gas (%)
House heating fuel used in houses and condos - Bottled, tank, or LP gas (%)
House heating fuel used in houses and condos - Electricity (%)
House heating fuel used in houses and condos - Fuel oil, kerosene, etc. (%)
House heating fuel used in houses and condos - Coal or coke (%)
House heating fuel used in houses and condos - Wood (%)
House heating fuel used in houses and condos - Solar energy (%)
House heating fuel used in houses and condos - Other fuel (%)
House heating fuel used in houses and condos - No fuel used (%)
House heating fuel used in apartments - Utility gas (%)
House heating fuel used in apartments - Bottled, tank, or LP gas (%)
House heating fuel used in apartments - Electricity (%)
House heating fuel used in apartments - Fuel oil, kerosene, etc. (%)
House heating fuel used in apartments - Coal or coke (%)
House heating fuel used in apartments - Wood (%)
House heating fuel used in apartments - Solar energy (%)
House heating fuel used in apartments - Other fuel (%)
House heating fuel used in apartments - No fuel used (%)
Armed forces status - In Armed Forces (%)
Armed forces status - Civilian (%)
Armed forces status - Civilian - Veteran (%)
Armed forces status - Civilian - Nonveteran (%)
Fatal accidents locations in years 2005-2021
Fatal accidents locations in 2005
Fatal accidents locations in 2006
Fatal accidents locations in 2007
Fatal accidents locations in 2008
Fatal accidents locations in 2009
Fatal accidents locations in 2010
Fatal accidents locations in 2011
Fatal accidents locations in 2012
Fatal accidents locations in 2013
Fatal accidents locations in 2014
Fatal accidents locations in 2015
Fatal accidents locations in 2016
Fatal accidents locations in 2017
Fatal accidents locations in 2018
Fatal accidents locations in 2019
Fatal accidents locations in 2020
Fatal accidents locations in 2021
Alcohol use - People drinking some alcohol every month (%)
Alcohol use - People not drinking at all (%)
Alcohol use - Average days/month drinking alcohol
Alcohol use - Average drinks/week
Alcohol use - Average days/year people drink much
Audiometry - Average condition of hearing (%)
Audiometry - People that can hear a whisper from across a quiet room (%)
Audiometry - People that can hear normal voice from across a quiet room (%)
Audiometry - Ears ringing, roaring, buzzing (%)
Audiometry - Had a job exposure to loud noise (%)
Audiometry - Had off-work exposure to loud noise (%)
Blood Pressure & Cholesterol - Has high blood pressure (%)
Blood Pressure & Cholesterol - Checking blood pressure at home (%)
Blood Pressure & Cholesterol - Frequently checking blood cholesterol (%)
Blood Pressure & Cholesterol - Has high cholesterol level (%)
Consumer Behavior - Money monthly spent on food at supermarket/grocery store
Consumer Behavior - Money monthly spent on food at other stores
Consumer Behavior - Money monthly spent on eating out
Consumer Behavior - Money monthly spent on carryout/delivered foods
Consumer Behavior - Income spent on food at supermarket/grocery store (%)
Consumer Behavior - Income spent on food at other stores (%)
Consumer Behavior - Income spent on eating out (%)
Consumer Behavior - Income spent on carryout/delivered foods (%)
Current Health Status - General health condition (%)
Current Health Status - Blood donors (%)
Current Health Status - Has blood ever tested for HIV virus (%)
Current Health Status - Left-handed people (%)
Dermatology - People using sunscreen (%)
Diabetes - Diabetics (%)
Diabetes - Had a blood test for high blood sugar (%)
Diabetes - People taking insulin (%)
Diet Behavior & Nutrition - Diet health (%)
Diet Behavior & Nutrition - Milk product consumption (# of products/month)
Diet Behavior & Nutrition - Meals not home prepared (#/week)
Diet Behavior & Nutrition - Meals from fast food or pizza place (#/week)
Diet Behavior & Nutrition - Ready-to-eat foods (#/month)
Diet Behavior & Nutrition - Frozen meals/pizza (#/month)
Drug Use - People that ever used marijuana or hashish (%)
Drug Use - Ever used hard drugs (%)
Drug Use - Ever used any form of cocaine (%)
Drug Use - Ever used heroin (%)
Drug Use - Ever used methamphetamine (%)
Health Insurance - People covered by health insurance (%)
Kidney Conditions-Urology - Avg. # of times urinating at night
Medical Conditions - People with asthma (%)
Medical Conditions - People with anemia (%)
Medical Conditions - People with psoriasis (%)
Medical Conditions - People with overweight (%)
Medical Conditions - Elderly people having difficulties in thinking or remembering (%)
Medical Conditions - People who ever received blood transfusion (%)
Medical Conditions - People having trouble seeing even with glass/contacts (%)
Medical Conditions - People with arthritis (%)
Medical Conditions - People with gout (%)
Medical Conditions - People with congestive heart failure (%)
Medical Conditions - People with coronary heart disease (%)
Medical Conditions - People with angina pectoris (%)
Medical Conditions - People who ever had heart attack (%)
Medical Conditions - People who ever had stroke (%)
Medical Conditions - People with emphysema (%)
Medical Conditions - People with thyroid problem (%)
Medical Conditions - People with chronic bronchitis (%)
Medical Conditions - People with any liver condition (%)
Medical Conditions - People who ever had cancer or malignancy (%)
Mental Health - People who have little interest in doing things (%)
Mental Health - People feeling down, depressed, or hopeless (%)
Mental Health - People who have trouble sleeping or sleeping too much (%)
Mental Health - People feeling tired or having little energy (%)
Mental Health - People with poor appetite or overeating (%)
Mental Health - People feeling bad about themself (%)
Mental Health - People who have trouble concentrating on things (%)
Mental Health - People moving or speaking slowly or too fast (%)
Mental Health - People having thoughts they would be better off dead (%)
Oral Health - Average years since last visit a dentist
Oral Health - People embarrassed because of mouth (%)
Oral Health - People with gum disease (%)
Oral Health - General health of teeth and gums (%)
Oral Health - Average days a week using dental floss/device
Oral Health - Average days a week using mouthwash for dental problem
Oral Health - Average number of teeth
Pesticide Use - Households using pesticides to control insects (%)
Pesticide Use - Households using pesticides to kill weeds (%)
Physical Activity - People doing vigorous-intensity work activities (%)
Physical Activity - People doing moderate-intensity work activities (%)
Physical Activity - People walking or bicycling (%)
Physical Activity - People doing vigorous-intensity recreational activities (%)
Physical Activity - People doing moderate-intensity recreational activities (%)
Physical Activity - Average hours a day doing sedentary activities
Physical Activity - Average hours a day watching TV or videos
Physical Activity - Average hours a day using computer
Physical Functioning - People having limitations keeping them from working (%)
Physical Functioning - People limited in amount of work they can do (%)
Physical Functioning - People that need special equipment to walk (%)
Physical Functioning - People experiencing confusion/memory problems (%)
Physical Functioning - People requiring special healthcare equipment (%)
Prescription Medications - Average number of prescription medicines taking
Preventive Aspirin Use - Adults 40+ taking low-dose aspirin (%)
Reproductive Health - Vaginal deliveries (%)
Reproductive Health - Cesarean deliveries (%)
Reproductive Health - Deliveries resulted in a live birth (%)
Reproductive Health - Pregnancies resulted in a delivery (%)
Reproductive Health - Women breastfeeding newborns (%)
Reproductive Health - Women that had a hysterectomy (%)
Reproductive Health - Women that had both ovaries removed (%)
Reproductive Health - Women that have ever taken birth control pills (%)
Reproductive Health - Women taking birth control pills (%)
Reproductive Health - Women that have ever used Depo-Provera or injectables (%)
Reproductive Health - Women that have ever used female hormones (%)
Sexual Behavior - People 18+ that ever had sex (vaginal, anal, or oral) (%)
Sexual Behavior - Males 18+ that ever had vaginal sex with a woman (%)
Sexual Behavior - Males 18+ that ever performed oral sex on a woman (%)
Sexual Behavior - Males 18+ that ever had anal sex with a woman (%)
Sexual Behavior - Males 18+ that ever had any sex with a man (%)
Sexual Behavior - Females 18+ that ever had vaginal sex with a man (%)
Sexual Behavior - Females 18+ that ever performed oral sex on a man (%)
Sexual Behavior - Females 18+ that ever had anal sex with a man (%)
Sexual Behavior - Females 18+ that ever had any kind of sex with a woman (%)
Sexual Behavior - Average age people first had sex
Sexual Behavior - Average number of female sex partners in lifetime (males 18+)
Sexual Behavior - Average number of female vaginal sex partners in lifetime (males 18+)
Sexual Behavior - Average age people first performed oral sex on a woman (18+)
Sexual Behavior - Average number of woman performed oral sex on in lifetime (18+)
Sexual Behavior - Average number of male sex partners in lifetime (males 18+)
Sexual Behavior - Average number of male anal sex partners in lifetime (males 18+)
Sexual Behavior - Average age people first performed oral sex on a man (18+)
Sexual Behavior - Average number of male oral sex partners in lifetime (18+)
Sexual Behavior - People using protection when performing oral sex (%)
Sexual Behavior - Average number of times people have vaginal or anal sex a year
Sexual Behavior - People having sex without condom (%)
Sexual Behavior - Average number of male sex partners in lifetime (females 18+)
Sexual Behavior - Average number of male vaginal sex partners in lifetime (females 18+)
Sexual Behavior - Average number of female sex partners in lifetime (females 18+)
Sexual Behavior - Circumcised males 18+ (%)
Sleep Disorders - Average hours sleeping at night
Sleep Disorders - People that has trouble sleeping (%)
Smoking-Cigarette Use - People smoking cigarettes (%)
Taste & Smell - People 40+ having problems with smell (%)
Taste & Smell - People 40+ having problems with taste (%)
Taste & Smell - People 40+ that ever had wisdom teeth removed (%)
Taste & Smell - People 40+ that ever had tonsils teeth removed (%)
Taste & Smell - People 40+ that ever had a loss of consciousness because of a head injury (%)
Taste & Smell - People 40+ that ever had a broken nose or other serious injury to face or skull (%)
Taste & Smell - People 40+ that ever had two or more sinus infections (%)
Weight - Average height (inches)
Weight - Average weight (pounds)
Weight - Average BMI
Weight - People that are obese (%)
Weight - People that ever were obese (%)
Weight - People trying to lose weight (%)
100%
urban population.
Estimated median house/condo value in 2022: $96,419
35208:
$96,419Alabama:
$200,900
According to our research of Alabama and other state lists, there were 20 registered sex offenders living in 35208 zip code as of April 27, 2024 . The ratio of all residents to sex offenders in zip code 35208 is 730 to 1.The ratio of registered sex offenders to all residents in this zip code is lower than the state average.
Median resident age: This zip code:
41.5 yearsAlabama median age:
39.6 years
Average household size: This zip code:
2.4 peopleAlabama:
2.5 people
Averages for the 2020 tax year for zip code 35208, filed in 2021:
Average Adjusted Gross Income (AGI) in 2020: $28,546 (Individual Income Tax Returns) Here:
$28,546State:
$63,984
Salary/wage: $27,087 (reported on 86.1% of returns )Here:
$27,087State:
$52,834
(% of AGI for various income ranges: 1265.6% for AGIs below $25k , 3825.3% for AGIs $25k-50k , 7469.7% for AGIs $50k-75k , 10961.1% for AGIs $75k-100k , 20232.5% for AGIs $100k-200k ) Taxable interest for individuals: $276 (reported on 7.7% of returns )This zip code:
$276Alabama:
$1,615
(% of AGI for various income ranges: 1.1% for AGIs below $25k , 3.2% for AGIs $25k-50k , 7.4% for AGIs $50k-75k , 7.8% for AGIs $75k-100k , 30.0% for AGIs $100k-200k ) Ordinary dividends: $1,433 (reported on 2.0% of returns )(% of AGI for various income ranges: 0.7% for AGIs below $25k , 1.2% for AGIs $25k-50k , 12.3% for AGIs $50k-75k , 230.0% for AGIs $100k-200k ) Net capital gain/loss in AGI: +$878 (reported on 1.5% of returns )(% of AGI for various income ranges: 2.4% for AGIs $25k-50k , 46.7% for AGIs $75k-100k ) Taxable individual retirement arrangement distribution: $11,629 (reported on 2.4% of returns )35208:
$11,629Alabama:
$19,004
(% of AGI for various income ranges: 11.8% for AGIs below $25k , 30.4% for AGIs $25k-50k , 240.9% for AGIs $50k-75k ) Total itemized deductions: $19,555 (reported on 3.4% of returns )Here:
$19,555State:
$37,338
(% of AGI for various income ranges: 12.9% for AGIs below $25k , 78.6% for AGIs $25k-50k , 316.3% for AGIs $50k-75k , 592.2% for AGIs $75k-100k , 1772.5% for AGIs $100k-200k ) Charity contributions: $8,565 (reported on 2.9% of returns )(% of AGI for various income ranges: 27.0% for AGIs $25k-50k , 118.9% for AGIs $50k-75k , 275.6% for AGIs $75k-100k , 932.5% for AGIs $100k-200k ) Taxes paid: $4,226 (reported on 3.2% of returns )(% of AGI for various income ranges: 1.5% for AGIs below $25k , 14.2% for AGIs $25k-50k , 67.1% for AGIs $50k-75k , 137.8% for AGIs $75k-100k , 460.0% for AGIs $100k-200k ) Earned income credit: $2,838 (reported on 41.3% of returns )(% of AGI for various income ranges: 198.7% for AGIs below $25k , 104.0% for AGIs $25k-50k ) Percentage of individuals using paid preparers for their 2020 taxes: 90.5%(% for various income ranges: 91.7% for AGIs below $25k , 90.3% for AGIs $25k-50k , 85.2% for AGIs $50k-75k , 93.3% for AGIs $75k-100k , 80.0% for AGIs $100k-200k )
Averages for the 2012 tax year for zip code 35208, filed in 2013:
Average Adjusted Gross Income (AGI) in 2012: $26,779 (Individual Income Tax Returns) Here:
$26,779State:
$52,001
Salary/wage: $25,820 (reported on 88.0% of returns )Here:
$25,820State:
$43,822
(% of AGI for various income ranges: 85.0% for AGIs below $25k , 90.3% for AGIs $25k-50k , 81.8% for AGIs $50k-75k , 79.9% for AGIs $75k-100k , 71.2% for AGIs $100k-200k ) Taxable interest for individuals: $467 (reported on 8.6% of returns )This zip code:
$467Alabama:
$1,592
(% of AGI for various income ranges: 0.2% for AGIs below $25k , 0.2% for AGIs $50k-75k , 0.1% for AGIs $75k-100k , 0.3% for AGIs $100k-200k ) Ordinary dividends: $958 (reported on 2.9% of returns )(% of AGI for various income ranges: 0.2% for AGIs $50k-75k , 0.5% for AGIs $75k-100k ) Net capital gain/loss in AGI: +$211 (reported on 1.4% of returns )(% of AGI for various income ranges: 0.3% for AGIs $50k-75k ) Profit/loss from business: +$2,043 (reported on 15.6% of returns )Here:
+$2,043State:
+$9,151
(% of AGI for various income ranges: 5.1% for AGIs below $25k , 5.7% for AGIs $100k-200k ) Taxable individual retirement arrangement distribution: $11,137 (reported on 2.9% of returns )35208:
$11,137Alabama:
$14,992
(% of AGI for various income ranges: 0.5% for AGIs below $25k , 0.9% for AGIs $25k-50k , 2.0% for AGIs $50k-75k , 4.7% for AGIs $75k-100k ) Total itemized deductions: $14,638 (31% of AGI, reported on 22.0% of returns )Here:
$14,638State:
$21,388
Here:
30.9% of AGIState:
20.1% of AGI
(% of AGI for various income ranges: 6.4% for AGIs below $25k , 13.3% for AGIs $25k-50k , 16.7% for AGIs $50k-75k , 15.7% for AGIs $75k-100k , 14.5% for AGIs $100k-200k ) Charity contributions: $4,611 (reported on 20.3% of returns )(% of AGI for various income ranges: 1.3% for AGIs below $25k , 3.6% for AGIs $25k-50k , 5.4% for AGIs $50k-75k , 5.7% for AGIs $75k-100k , 5.3% for AGIs $100k-200k ) Taxes paid: $2,944 (reported on 21.5% of returns )(% of AGI for various income ranges: 0.8% for AGIs below $25k , 2.4% for AGIs $25k-50k , 3.7% for AGIs $50k-75k , 3.7% for AGIs $75k-100k , 4.2% for AGIs $100k-200k ) Earned income credit: $2,935 (reported on 47.4% of returns )(% of AGI for various income ranges: 14.8% for AGIs below $25k , 1.7% for AGIs $25k-50k ) Percentage of individuals using paid preparers for their 2012 taxes: 59.5%(% for various income ranges: 61.2% for AGIs below $25k , 56.2% for AGIs $25k-50k , 59.2% for AGIs $50k-75k , 64.7% for AGIs $75k-100k , 50.0% for AGIs $100k-200k )
Averages for the 2004 tax year for zip code 35208, filed in 2005:
Average Adjusted Gross Income (AGI) in 2004: $24,729 (Individual Income Tax Returns) Here:
$24,729State:
$42,302
Salary/wage: $24,186 (reported on 91.8% of returns )Here:
$24,186State:
$36,626
(% of AGI for various income ranges: 87.7% for AGIs below $10k , 90.9% for AGIs $10k-25k , 93.3% for AGIs $25k-50k , 86.7% for AGIs $50k-75k , 84.3% for AGIs $75k-100k , 76.7% for AGIs over 100k ) Taxable interest for individuals: $984 (reported on 13.1% of returns )This zip code:
$984Alabama:
$1,827
(% of AGI for various income ranges: 0.9% for AGIs below $10k , 0.4% for AGIs $10k-25k , 0.5% for AGIs $25k-50k , 0.5% for AGIs $50k-75k , 0.3% for AGIs $75k-100k , 1.0% for AGIs over 100k ) Taxable dividends: $952 (reported on 4.7% of returns )(% of AGI for various income ranges: 0.3% for AGIs below $10k , 0.1% for AGIs $10k-25k , 0.2% for AGIs $25k-50k , 0.1% for AGIs $50k-75k , 0.2% for AGIs $75k-100k , 0.8% for AGIs over 100k ) Net capital gain/loss: +$2,068 (reported on 2.0% of returns )Here:
+$2,068State:
+$13,031
(% of AGI for various income ranges: 0.0% for AGIs below $10k , -0.0% for AGIs $10k-25k , 0.0% for AGIs $25k-50k , -0.0% for AGIs $50k-75k , 0.9% for AGIs $75k-100k , 2.0% for AGIs over 100k ) Profit/loss from business: +$2,162 (reported on 9.2% of returns )Here:
+$2,162State:
+$8,302
(% of AGI for various income ranges: 6.4% for AGIs below $10k , 1.6% for AGIs $10k-25k , -0.4% for AGIs $25k-50k , 1.0% for AGIs $50k-75k , -0.0% for AGIs $75k-100k , 0.8% for AGIs over 100k ) IRA payment deduction: $1,927 (reported on 0.8% of returns )35208:
$1,927Alabama:
$3,006
Total itemized deductions: $13,219 (32% of AGI, reported on 29.3% of returns )Here:
$13,219State:
$17,623
Here:
31.7% of AGIState:
20.8% of AGI
(% of AGI for various income ranges: 5.3% for AGIs below $10k , 10.7% for AGIs $10k-25k , 18.8% for AGIs $25k-50k , 18.7% for AGIs $50k-75k , 17.4% for AGIs $75k-100k , 17.6% for AGIs over 100k ) Charity contributions deductions: $3,873 (9% of AGI, reported on 28.2% of returns )Here:
9.2% of AGIState:
5.4% of AGI
(% of AGI for various income ranges: 0.8% for AGIs below $10k , 2.2% for AGIs $10k-25k , 5.1% for AGIs $25k-50k , 6.5% for AGIs $50k-75k , 6.2% for AGIs $75k-100k , 6.5% for AGIs over 100k ) Total tax: $2,548 (reported on 52.6% of returns )(% of AGI for various income ranges: 1.8% for AGIs below $10k , 1.9% for AGIs $10k-25k , 4.9% for AGIs $25k-50k , 8.9% for AGIs $50k-75k , 10.3% for AGIs $75k-100k , 14.4% for AGIs over 100k ) Earned income credit: $2,155 (reported on 46.0% of returns )Percentage of individuals using paid preparers for their 2004 taxes: 64.9%(% for various income ranges: 57.3% for AGIs below $10k , 69.8% for AGIs $10k-25k , 64.5% for AGIs $25k-50k , 63.2% for AGIs $50k-75k , 56.7% for AGIs $75k-100k , 67.1% for AGIs over 100k )
Estimated median household income in 2022: This zip code:
$34,707Alabama:
$59,674
Nearest zip codes: 35218 ,
35254 ,
35064 ,
35204 ,
35211 ,
35221 .
Birmingham Zip Code Map
Percentage of family households: This zip code:
36.9%Alabama:
45.6%
Percentage of households with unmarried partners: This zip code:
4.1%Alabama:
46.7%
Likely homosexual households (counted as self-reported same-sex unmarried-partner households)
Lesbian couples: 0.0% of all households Gay men: 0.3% of all households
Household received Food Stamps/SNAP in the past 12 months: 1,629Household did not receive Food Stamps/SNAP in the past 12 months: 4,522
Women who had a birth in the past 12 months: 231 (198 now married , 44 unmarried) Women who did not have a birth in the past 12 months: 2,911 (678 now married , 2,238 unmarried)
Housing units in zip code 35208 with a mortgage: 1,900 (97
second mortgage , 24
both second mortgage and home equity loan )
Houses without a mortgage: 174
Median monthly owner costs for units with a mortgage: $939
Median monthly owner costs for units without a mortgage: $381
Residents with income below the poverty level in 2022:
This zip code:
29.7%Whole state:
16.2%
Residents with income below 50% of the poverty level in 2022:
This zip code:
17.0%Whole state:
8.6%
Median number of rooms in houses and condos: Median number of rooms in apartments: Notable locations in this zip code not listed on our city pages
Click to draw/clear zip code borders Notable locations in zip code 35208: (A) , Alabama State Fairgrounds (B) , Birmingham International Raceway (C) , Birmingham Fire and Rescue Service Station 20 (D) , Birmingham Fire and Rescue Service Station 24 (E) . Display/hide their locations on the map
Shopping Center: (1) . Display/hide its location on the map
Churches in zip code 35208 include: (A) , Church of God (B) , Hunter Street Baptist Church (C) , Central Park Presbyterian Church (D) , Central Park Baptist Church (E) , Belview Heights Church of Christ (F) , Bethel African Methodist Episcopal Church (G) . Display/hide their locations on the map
Parks in zip code 35208 include: (1) , Highlands Park (2) , Fairview Park (3) , Exchange Park (4) . Display/hide their locations on the map
Year house built (houses)
0 2020 or later144 2010 to 2019168 2000 to 2009138 1990 to 1999281 1980 to 1989801 1970 to 19791,021 1960 to 19692,161 1950 to 19591,228 1940 to 19491,542 1939 or earlier
Zip code 35208 household income distribution in 2022 564 Less than $10,000440 $10,000 to $14,999370 $15,000 to $19,999800 $20,000 to $24,999507 $25,000 to $29,999384 $30,000 to $34,999196 $35,000 to $39,999338 $40,000 to $44,999427 $45,000 to $49,999425 $50,000 to $59,999550 $60,000 to $74,999465 $75,000 to $99,999207 $100,000 to $124,999167 $125,000 to $149,999150 $150,000 to $199,99973 $200,000 or moreEstimate of home value of owner-occupied houses/condos in 2022 in zip code 35208 39 Less than $10,00026 $10,000 to $14,99910 $15,000 to $19,9994 $20,000 to $24,99948 $25,000 to $29,999111 $35,000 to $39,999163 $40,000 to $49,999240 $50,000 to $59,999569 $60,000 to $69,999416 $70,000 to $79,999380 $80,000 to $89,999407 $90,000 to $99,999414 $100,000 to $124,999110 $125,000 to $149,999151 $150,000 to $174,99962 $175,000 to $199,99999 $200,000 to $249,99985 $250,000 to $299,99967 $300,000 to $399,9998 $750,000 to $999,99949 $1,500,000 to $1,999,999Rent paid by renters in 2022 in zip code 35208 114 $100 to $14923 $150 to $19911 $200 to $2498 $250 to $29929 $300 to $34996 $350 to $399135 $400 to $449187 $450 to $499165 $500 to $549205 $550 to $59919 $600 to $649201 $650 to $699138 $700 to $74999 $750 to $799462 $800 to $899109 $900 to $99943 $1,000 to $1,24935 $1,250 to $1,49989 No cash rent
Median gross rent in 2022: $926.
Median price asked for vacant for-sale houses and condos in 2022: $176,939.
Estimated median house (or condo) value in 2022 for: White Non-Hispanic householders: $95,195Black or African American householders: $97,117Native Hawaiian and other Pacific Islander householders: $283,840Some other race householders: $56,768Two or more races householders: $107,946Hispanic or Latino householders: $90,305Estimated median house or condo value in 2022: $96,419
35208:
$96,419Alabama:
$200,900
Lower value quartile - upper value quartile: $68,543 - $123,872
Mean price in 2022: Detached houses: $204,326Here:
$204,326State:
$273,076
Townhouses or other attached units: $234,381Here:
$234,381State:
$222,857
In 2-unit structures: $371,094Here:
$371,094State:
$191,282
In 3-to-4-unit structures: $673,347Here:
$673,347State:
$194,388
In 5-or-more-unit structures: $486,145Here:
$486,145State:
$307,073
Mobile homes: $63,795Here:
$63,795State:
$77,780
Housing units in structures:
One, detached: 6,381One, attached: 30Two: 333 or 4: 3175 to 9: 36010 to 19: 18220 to 49: 12750 or more: 23Mobile homes: 166Unemployment : 6.8%
Means of transportation to work in zip code 35208 75.1% 3,947 Drove a car alone6.9% 363 Carpooled5.7% 298 Bus or trolley bus4.3% 224 Walked3.0% 160 Other means3.8% 199 Worked at homeTravel time to work (commute) in zip code 35208 56 Less than 5 minutes422 5 to 9 minutes556 10 to 14 minutes1,284 15 to 19 minutes775 20 to 24 minutes555 25 to 29 minutes653 30 to 34 minutes111 35 to 39 minutes214 40 to 44 minutes73 45 to 59 minutes152 60 to 89 minutes131 90 or more minutes
Percentage of zip code residents living and working in this county: 94.7%
Household type by relationship:
Households: 14,763
Male householders: 2,134 (1,007 living alone ), Female householders: 3,995 (1,372 living alone )1,586 spouses (1,578 opposite-sex spouses ), 231 unmarried partners , (213 opposite-sex unmarried partners ), 4,515 children (4,321 natural , 156 adopted , 48 stepchildren ), 883 grandchildren , 240 brothers or sisters , 117 parents , 0 foster children , 578 other relatives , 322 non-relatives In group quarters: 32 (-1 institutionalized population )
Size of family households: 1,454 2-persons , 1,094 3-persons , 561 4-persons , 279 5-persons , 27 6-persons , 68 7-or-more-persons
Size of nonfamily households: 2,377 1-person , 231 2-persons , 7 3-persons , 23 5-persons
757 married couples with children. single-parent households (44 men , 1,520 women ).
95.9% of residents of 35208 zip code speak English at home. of residents speak Spanish at home (50% very well, 18% well, 17% not well, 14% not at all ).of residents speak other language at home (70% very well, 30% well ).
Foreign born population: 438 (3.0%)
(11.2%
of them are naturalized citizens )
This zip code:
3.0%Whole state:
3.8%
46% Haiti 14% Honduras 14% Czechoslovakia (includes Czech Republic and Slovakia) 10% El Salvador 5% Dominica 3% West Indies 1% Chile 7% African 2% Jamaican 2% American 1% Scotch-Irish 0% Hungarian 0% English 0% Italian
Year of entry for the foreign-born population
254 2010 or later 226 2000 to 2009 11 1990 to 1999 31 Before 1990
Private high school in in this zip code not listed on the city page: CENTRAL PARK CHRISTIAN SCHOOLS Students: 184, Location: 1900 43RD STREET ENSLEY, Grades: KG-12)
Public elementary/middle schools in in zip code 35208 not listed on the city page:
There are
16 Medical Specialists in Zip Code 35208 .
Major facilities with environmental interests located in this zip code:
ALABAMA METAL INDUSTRIES CORPORATION (3245 FAYETTE AVENUE in BIRMINGHAM, AL)
AIR MAJOR (AIRS/AFS) (Integrated Compliance Information System) - ICIS-04-2003-1775, FORMAL ENFORCEMENT ACTION COMPLIANCE ACTIVITY (Tracking inspections of insecticide, fungicide, and rodenticide, and toxic substances) CRITERIA AND HAZARDOUS AIR POLLUTANT INVENTORY (Inventory of air pollution sources) National Pollutant Discharge Elimination System NON-MAJOR (Tracking pollutant discharge elimination systems) - permit Small Quantity Generators, between 100 kg and 1000 kg of hazardous waste/month (Resource Conservation and Recovery Act (tracking hazardous waste)) - notification TRI REPORTER (Tracking of toxic chemicals releasing facilities) Business SIC classification: ARCHITECTURAL AND ORNAMENTAL METALWORK; MISCELLANEOUS STRUCTURAL METALWORKBusiness NAICS classification: ORNAMENTAL AND ARCHITECTURAL METAL WORK MANUFACTURING.; ORNAMENTAL AND ARCHITECTURAL METAL WORK MANUFACTURING.Organizations: OPERNAME (CONTACT/OPERATOR)
, ALABAMA METAL IND CORP (CONTACT/OWNER)
CENTRAL PARK ELEMENTARY SCHOOL (4915 AVE Q in BIRMINGHAM, AL)
(Geographic Names Information System) (National Center for Education Statistics) - STATE ID-0110 Organizations: BIRMINGHAM CITY (SCHOOL DISTRICT)
CHARLES A BROWN ELEMENTARY SCHOOL (4811 COURT J in BIRMINGHAM, AL)
(National Center for Education Statistics) - STATE ID-0050 Organizations: BIRMINGHAM CITY (SCHOOL DISTRICT)
PRINCETON ALTERNATIVE SCHOOL (1425 2ND AVE W in BIRMINGHAM, AL)
(National Center for Education Statistics) - STATE ID-0700 Organizations: BIRMINGHAM CITY (SCHOOL DISTRICT)
ADAMS AUTO REPAIR (1601 BESSEMER RD in BIRMINGHAM, AL)
(Resource Conservation and Recovery Act (tracking hazardous waste)) Business NAICS classification: GENERAL AUTOMOTIVE REPAIR.Organizations: MUTASIM ADAM (CONTACT/OPERATOR)
ALLIED BATTERY CO (2920 LOMB AVE W in BIRMINGHAM, AL)
(Resource Conservation and Recovery Act (tracking hazardous waste)) Organizations: OPERNAME (CONTACT/OPERATOR)
PARAMOUNT CLEANERS & LAUNDRY INC (2917 LOMB AVE NE in BIRMINGHAM, AL)
(Resource Conservation and Recovery Act (tracking hazardous waste)) Organizations: OPERNAME (CONTACT/OPERATOR)
ANTONIO AUTO PARTS INC (7 15TH STREET SW in BIRMINGHAM, AL)
National Pollutant Discharge Elimination System NON-MAJOR (Tracking pollutant discharge elimination systems) - permit Business SIC classification: MOTOR VEHICLE PARTS, USED
AUTOZONE #113 (1545 BESSEMER HWY in BIRMINGHAM, AL)
(Resource Conservation and Recovery Act (tracking hazardous waste)) Organizations: AUTOZONE INC (CONTACT/OWNER)
RAINES LUMBER COMPANY #2 (#2 17TH STREET WEST in BIRMINGHAM, AL)
(Resource Conservation and Recovery Act (tracking hazardous waste)) Organizations: OPERNAME (CONTACT/OPERATOR)
PAUL SANDERS CLEANERS (2714 BESSEMER RD in BIRMINGHAM, AL)
Small Quantity Generators, between 100 kg and 1000 kg of hazardous waste/month (Resource Conservation and Recovery Act (tracking hazardous waste)) - notification Organizations: OPERNAME (CONTACT/OPERATOR)
, LEWIS SANDERS (CONTACT/OWNER)
RUCKER HARDWARE INC (1715 BESSEMER RD in BIRMINGHAM, AL)
Small Quantity Generators, between 100 kg and 1000 kg of hazardous waste/month (Resource Conservation and Recovery Act (tracking hazardous waste)) - notification Business NAICS classification: GENERAL AUTOMOTIVE REPAIR.Organizations: OPERNAME (CONTACT/OPERATOR)
, LANGSTON BUTCH (CONTACT/OWNER)
KARGO RPR CTR OF BIRMINGHAM (3028 BESS RD in BIRMINGHAM, AL)
Small Quantity Generators, between 100 kg and 1000 kg of hazardous waste/month (Resource Conservation and Recovery Act (tracking hazardous waste)) - notification Organizations: OPERNAME (CONTACT/OPERATOR)
, UHAUL CORP (CONTACT/OWNER)
Housing units lacking complete plumbing facilities: 6.6%
Housing units lacking complete kitchen facilities: 5.6%
53.4% Utility gas 42.5% Electricity 1.7% Bottled, tank, or LP gas 1.7% Wood
Population in 1990: 19,328.
Place of birth for U.S.-born residents:
This state: 12,759Northeast: 253Midwest: 430South: 610West: 65
62% of the 35208 zip code residents lived in the same house 5 years ago.
Out of people who lived in different houses, 86% lived in this county.
Out of people who lived in different counties, 50% lived in Alabama.
91% of the 35208 zip code residents lived in the same house 1 year ago.
Out of people who lived in different houses, 78% moved from this county.
Out of people who lived in different houses, 5% moved from different county within same state.
Out of people who lived in different houses, 10% moved from different state.
Out of people who lived in different houses, 1% moved from abroad.
Private vs. public school enrollment:
Students in private schools in grades 1 to 8 (elementary and middle school): 250
Students in private schools in grades 9 to 12 (high school): 37
Students in private undergraduate colleges: 114
Occupation by median earnings in the past 12 months ($)
124,939 Computer and mathematical occupations 82,591 Health diagnosing and treating practitioners and other technical occupations 72,839 Business and financial operations occupations 49,133 Management occupations 43,238 Education, training, and library occupations 41,880 Installation, maintenance, and repair occupations
Companies with federal contracts located in this zip code:
DEB''S CLEANING SERVICES (1840 47TH STREET in BIRMINGHAM, AL; small business) in 3 contracts from 2003 to 2005
$39,832 with Navy for Custodial Janitorial Services. Signed on 2004-02-27. Completion date: 2004-03-05.
, same as above. Signed on 2003-03-06. Completion date: 2004-03-05.
, same as above. Signed on 2005-03-03. Completion date: 2004-03-05.
PARAMOUNT SERVICES INC (2917 LOMB AVENUE in BIRMINGHAM, AL; small business) in 5 contracts from 2003 to 2005
Contracts for Laundry and DryCleaning Services by ArmySigned by year: 2000: $0; 2001: $0; 2002: $0; 2003: $4,500; 2004: $8,000; 2005: $9,600; 2006: $0.
Biggest contracts: with Army for Laundry and DryCleaning Services. Signed on 2005-10-04. Completion date: 2007-09-30.
, same as above. Signed on 2004-10-15. Completion date: 2005-09-30.
, same as above. Signed on 2003-12-23. Completion date: 2004-09-30.
, same as above. Signed on 2004-09-22. Completion date: 2004-09-30.
Top industries in this zip code by the number of employees in 2005:
Accommodation and Food Services: Limited-Service Restaurants (20-49 employees: 7 establishments, 10-19 employees: 2 establishments, 5-9 employees: 1 establishment, 1-4 employees: 6 establishments)Other Services (except Public Administration): Religious Organizations (20-49: 2, 10-19: 1, 5-9: 1, 1-4: 2)Other Services (except Public Administration): Linen Supply (50-99: 1)Health Care and Social Assistance: Child Day Care Services (10-19: 1, 5-9: 4, 1-4: 9)Finance and Insurance: Commercial Banking (20-49: 1, 10-19: 1, 5-9: 1)Wholesale Trade: Other Chemical and Allied Products Merchant Wholesalers (20-49: 1, 10-19: 1)
People in group quarters in 2010:
62 people in group homes intended for adults
8 people in college/university student housing
People in group quarters in 2000:
33 people in nursing homes
29 people in homes or halfway houses for drug/alcohol abuse
23 people in other group homes
Fatal accident statistics in 2014:
Fatal accident count: 2Vehicles involved in fatal accidents: 4Fatal accidents caused by drunken drivers: 1Fatalities: 2Persons involved in fatal accidents: 5Pedestrians involved in fatal accidents: 2
Fatal accident statistics in 2011:
Fatal accident count: 1Vehicles involved in fatal accidents: 1Fatal accidents caused by drunken drivers: 0Fatalities: 1Persons involved in fatal accidents: 1Pedestrians involved in fatal accidents: 1
Home Mortgage Disclosure Act Aggregated Statistics For Year 2009(Based on 7 partial tracts) A) FHA, FSA/RHS & VA B) Conventional C) Refinancings D) Home Improvement Loans E) Loans on Dwellings For 5+ Families F) Non-occupant Loans on Number Average Value Number Average Value Number Average Value Number Average Value Number Average Value Number Average Value
LOANS ORIGINATED 13 $83,545 16 $35,489 73 $71,046 14 $26,459 1 $265,070 31 $53,360 APPLICATIONS APPROVED, NOT ACCEPTED 1 $116,710 2 $40,385 14 $57,734 1 $33,570 0 $0 4 $45,930 APPLICATIONS DENIED 8 $76,616 10 $64,769 123 $72,997 33 $27,047 0 $0 12 $82,834 APPLICATIONS WITHDRAWN 2 $89,615 4 $51,880 68 $70,374 2 $56,470 0 $0 7 $55,074 FILES CLOSED FOR INCOMPLETENESS 2 $68,070 0 $0 13 $75,465 2 $84,965 0 $0 1 $63,870
Aggregated Statistics For Year 2008(Based on 7 partial tracts) A) FHA, FSA/RHS & VA B) Conventional C) Refinancings D) Home Improvement Loans E) Loans on Dwellings For 5+ Families F) Non-occupant Loans on Number Average Value Number Average Value Number Average Value Number Average Value Number Average Value Number Average Value
LOANS ORIGINATED 22 $73,881 75 $61,840 155 $69,989 20 $29,174 2 $1,032,260 118 $65,961 APPLICATIONS APPROVED, NOT ACCEPTED 3 $63,420 6 $70,567 29 $61,935 8 $30,250 0 $0 9 $59,772 APPLICATIONS DENIED 18 $88,012 34 $60,400 271 $71,055 80 $30,561 0 $0 59 $59,091 APPLICATIONS WITHDRAWN 6 $80,345 15 $69,349 84 $71,649 4 $53,368 0 $0 23 $58,443 FILES CLOSED FOR INCOMPLETENESS 7 $80,156 5 $68,150 22 $74,476 2 $17,680 0 $0 7 $58,333
Aggregated Statistics For Year 2007(Based on 7 partial tracts) A) FHA, FSA/RHS & VA B) Conventional C) Refinancings D) Home Improvement Loans E) Loans on Dwellings For 5+ Families F) Non-occupant Loans on G) Loans On Manufactured Number Average Value Number Average Value Number Average Value Number Average Value Number Average Value Number Average Value Number Average Value
LOANS ORIGINATED 20 $79,132 158 $61,321 218 $65,376 38 $35,741 1 $1,063,720 140 $54,330 1 $85,570 APPLICATIONS APPROVED, NOT ACCEPTED 4 $74,215 24 $70,963 48 $63,989 9 $36,399 0 $0 13 $59,935 0 $0 APPLICATIONS DENIED 6 $89,148 77 $70,312 323 $71,398 132 $36,557 1 $12,770 71 $60,276 0 $0 APPLICATIONS WITHDRAWN 6 $77,662 28 $69,046 107 $67,824 14 $43,914 0 $0 18 $58,999 0 $0 FILES CLOSED FOR INCOMPLETENESS 0 $0 14 $105,050 42 $74,715 1 $29,580 0 $0 10 $59,173 0 $0
Aggregated Statistics For Year 2006(Based on 7 partial tracts) A) FHA, FSA/RHS & VA B) Conventional C) Refinancings D) Home Improvement Loans E) Loans on Dwellings For 5+ Families F) Non-occupant Loans on G) Loans On Manufactured Number Average Value Number Average Value Number Average Value Number Average Value Number Average Value Number Average Value Number Average Value
LOANS ORIGINATED 15 $80,506 181 $60,381 263 $62,846 44 $29,227 2 $1,317,840 141 $55,778 0 $0 APPLICATIONS APPROVED, NOT ACCEPTED 1 $48,630 33 $65,746 64 $65,532 13 $25,065 0 $0 14 $57,780 3 $30,153 APPLICATIONS DENIED 4 $104,118 97 $69,017 321 $67,187 108 $31,613 0 $0 52 $66,416 1 $48,900 APPLICATIONS WITHDRAWN 2 $88,970 36 $62,416 132 $66,792 13 $44,887 0 $0 19 $54,994 0 $0 FILES CLOSED FOR INCOMPLETENESS 3 $62,777 14 $76,121 66 $70,101 1 $48,690 0 $0 5 $68,970 0 $0
Aggregated Statistics For Year 2005(Based on 7 partial tracts) A) FHA, FSA/RHS & VA B) Conventional C) Refinancings D) Home Improvement Loans E) Loans on Dwellings For 5+ Families F) Non-occupant Loans on G) Loans On Manufactured Number Average Value Number Average Value Number Average Value Number Average Value Number Average Value Number Average Value Number Average Value
LOANS ORIGINATED 18 $67,276 167 $56,645 341 $62,741 42 $32,922 3 $452,183 140 $55,756 0 $0 APPLICATIONS APPROVED, NOT ACCEPTED 2 $84,035 45 $60,452 86 $59,161 13 $23,675 0 $0 17 $54,976 2 $72,345 APPLICATIONS DENIED 5 $68,064 87 $61,325 470 $64,711 94 $34,000 0 $0 44 $52,242 3 $91,203 APPLICATIONS WITHDRAWN 5 $80,578 65 $89,443 140 $74,843 25 $81,909 0 $0 28 $70,083 1 $9,580 FILES CLOSED FOR INCOMPLETENESS 0 $0 11 $60,638 82 $74,252 2 $40,320 0 $0 4 $61,610 0 $0
Aggregated Statistics For Year 2004(Based on 7 partial tracts) A) FHA, FSA/RHS & VA B) Conventional C) Refinancings D) Home Improvement Loans E) Loans on Dwellings For 5+ Families F) Non-occupant Loans on G) Loans On Manufactured Number Average Value Number Average Value Number Average Value Number Average Value Number Average Value Number Average Value Number Average Value
LOANS ORIGINATED 29 $69,590 118 $54,505 381 $59,646 28 $33,290 0 $0 137 $52,983 0 $0 APPLICATIONS APPROVED, NOT ACCEPTED 2 $55,160 44 $61,410 146 $62,109 4 $26,148 0 $0 9 $49,744 1 $21,380 APPLICATIONS DENIED 7 $71,129 77 $59,665 497 $61,314 84 $30,832 1 $339,320 38 $47,622 1 $34,360 APPLICATIONS WITHDRAWN 6 $65,393 28 $72,110 162 $63,185 11 $38,362 1 $914,030 19 $70,337 0 $0 FILES CLOSED FOR INCOMPLETENESS 1 $62,840 8 $64,358 115 $69,095 4 $52,302 0 $0 5 $55,422 0 $0
Aggregated Statistics For Year 2003(Based on 7 partial tracts) A) FHA, FSA/RHS & VA B) Conventional C) Refinancings D) Home Improvement Loans E) Loans on Dwellings For 5+ Families F) Non-occupant Loans on Number Average Value Number Average Value Number Average Value Number Average Value Number Average Value Number Average Value
LOANS ORIGINATED 29 $66,777 104 $59,085 360 $56,022 18 $34,357 3 $437,003 83 $49,129 APPLICATIONS APPROVED, NOT ACCEPTED 1 $95,910 30 $63,261 121 $57,312 4 $18,978 0 $0 10 $61,584 APPLICATIONS DENIED 5 $61,260 49 $55,909 400 $58,672 51 $19,469 0 $0 29 $47,330 APPLICATIONS WITHDRAWN 1 $41,130 14 $64,413 156 $61,294 3 $38,137 0 $0 10 $54,236 FILES CLOSED FOR INCOMPLETENESS 0 $0 9 $65,234 22 $60,424 1 $18,100 0 $0 1 $79,200
Aggregated Statistics For Year 2002(Based on 7 partial tracts) A) FHA, FSA/RHS & VA B) Conventional C) Refinancings D) Home Improvement Loans E) Loans on Dwellings For 5+ Families F) Non-occupant Loans on Number Average Value Number Average Value Number Average Value Number Average Value Number Average Value Number Average Value
LOANS ORIGINATED 49 $63,092 76 $47,220 256 $53,943 19 $21,207 1 $228,220 57 $41,858 APPLICATIONS APPROVED, NOT ACCEPTED 3 $58,390 16 $49,811 111 $50,939 3 $21,593 0 $0 10 $40,451 APPLICATIONS DENIED 12 $61,788 45 $49,466 304 $56,356 41 $21,779 0 $0 20 $42,184 APPLICATIONS WITHDRAWN 2 $68,130 20 $68,574 125 $59,284 3 $49,153 0 $0 9 $49,850 FILES CLOSED FOR INCOMPLETENESS 2 $52,090 9 $61,369 51 $60,564 0 $0 0 $0 4 $47,235
Aggregated Statistics For Year 2001(Based on 7 partial tracts) A) FHA, FSA/RHS & VA B) Conventional C) Refinancings D) Home Improvement Loans E) Loans on Dwellings For 5+ Families F) Non-occupant Loans on Number Average Value Number Average Value Number Average Value Number Average Value Number Average Value Number Average Value
LOANS ORIGINATED 37 $60,305 56 $49,352 232 $53,305 27 $15,591 1 $180,040 31 $36,517 APPLICATIONS APPROVED, NOT ACCEPTED 5 $61,830 13 $47,422 62 $52,850 5 $18,654 1 $231,620 5 $43,158 APPLICATIONS DENIED 11 $55,548 42 $53,798 329 $53,192 55 $14,820 0 $0 21 $47,266 APPLICATIONS WITHDRAWN 5 $58,378 14 $53,373 100 $52,535 5 $19,180 0 $0 5 $51,000 FILES CLOSED FOR INCOMPLETENESS 4 $54,112 8 $57,715 41 $55,980 0 $0 0 $0 2 $27,945
Aggregated Statistics For Year 2000(Based on 7 partial tracts) A) FHA, FSA/RHS & VA B) Conventional C) Refinancings D) Home Improvement Loans E) Loans on Dwellings For 5+ Families F) Non-occupant Loans on Number Average Value Number Average Value Number Average Value Number Average Value Number Average Value Number Average Value
LOANS ORIGINATED 72 $55,943 59 $62,904 137 $46,456 27 $12,111 1 $372,410 27 $73,436 APPLICATIONS APPROVED, NOT ACCEPTED 3 $40,930 10 $40,603 37 $44,190 11 $13,595 0 $0 5 $42,354 APPLICATIONS DENIED 15 $49,947 43 $48,930 223 $48,233 67 $12,909 0 $0 17 $36,788 APPLICATIONS WITHDRAWN 7 $60,831 25 $47,724 73 $49,705 3 $30,220 0 $0 5 $42,364 FILES CLOSED FOR INCOMPLETENESS 4 $52,528 14 $50,701 91 $49,486 0 $0 0 $0 4 $48,385
Aggregated Statistics For Year 1999(Based on 7 partial tracts) A) FHA, FSA/RHS & VA B) Conventional C) Refinancings D) Home Improvement Loans E) Loans on Dwellings For 5+ Families F) Non-occupant Loans on Number Average Value Number Average Value Number Average Value Number Average Value Number Average Value Number Average Value
LOANS ORIGINATED 79 $55,129 42 $165,149 181 $65,810 30 $10,568 4 $272,672 21 $36,385 APPLICATIONS APPROVED, NOT ACCEPTED 1 $42,220 11 $40,301 43 $45,117 14 $14,108 0 $0 3 $38,897 APPLICATIONS DENIED 16 $60,044 36 $45,968 231 $45,612 95 $12,143 0 $0 14 $36,936 APPLICATIONS WITHDRAWN 4 $60,385 20 $49,526 87 $43,861 1 $41,180 0 $0 7 $33,084 FILES CLOSED FOR INCOMPLETENESS 2 $59,945 7 $60,669 77 $42,572 0 $0 0 $0 7 $39,204
Private Mortgage Insurance Companies Aggregated Statistics For Year 2009(Based on 4 partial tracts) B) Refinancings Number Average Value
LOANS ORIGINATED 2 $57,110 APPLICATIONS APPROVED, NOT ACCEPTED 0 $0 APPLICATIONS DENIED 0 $0 APPLICATIONS WITHDRAWN 0 $0 FILES CLOSED FOR INCOMPLETENESS 0 $0
Aggregated Statistics For Year 2008(Based on 6 partial tracts) A) Conventional B) Refinancings C) Non-occupant Loans on Number Average Value Number Average Value Number Average Value
LOANS ORIGINATED 26 $61,491 11 $75,670 11 $58,261 APPLICATIONS APPROVED, NOT ACCEPTED 12 $68,510 9 $75,592 6 $59,368 APPLICATIONS DENIED 7 $56,456 1 $87,410 6 $44,205 APPLICATIONS WITHDRAWN 1 $54,820 0 $0 0 $0 FILES CLOSED FOR INCOMPLETENESS 1 $100,480 1 $107,470 1 $60,790
Aggregated Statistics For Year 2007(Based on 7 partial tracts) A) Conventional B) Refinancings C) Non-occupant Loans on Number Average Value Number Average Value Number Average Value
LOANS ORIGINATED 86 $72,575 35 $76,524 23 $61,970 APPLICATIONS APPROVED, NOT ACCEPTED 9 $76,244 6 $74,538 4 $57,592 APPLICATIONS DENIED 4 $82,225 1 $99,380 1 $90,140 APPLICATIONS WITHDRAWN 8 $76,169 3 $78,637 2 $48,245 FILES CLOSED FOR INCOMPLETENESS 0 $0 0 $0 0 $0
Aggregated Statistics For Year 2006(Based on 7 partial tracts) A) Conventional B) Refinancings C) Non-occupant Loans on Number Average Value Number Average Value Number Average Value
LOANS ORIGINATED 34 $68,669 21 $72,069 14 $53,012 APPLICATIONS APPROVED, NOT ACCEPTED 8 $63,561 4 $76,810 3 $59,523 APPLICATIONS DENIED 1 $39,730 1 $98,870 1 $98,870 APPLICATIONS WITHDRAWN 4 $69,082 4 $62,420 5 $61,064 FILES CLOSED FOR INCOMPLETENESS 0 $0 0 $0 0 $0
Aggregated Statistics For Year 2005(Based on 7 partial tracts) A) Conventional B) Refinancings C) Non-occupant Loans on Number Average Value Number Average Value Number Average Value
LOANS ORIGINATED 38 $63,259 26 $70,808 23 $57,051 APPLICATIONS APPROVED, NOT ACCEPTED 7 $62,391 5 $60,100 3 $50,747 APPLICATIONS DENIED 0 $0 0 $0 0 $0 APPLICATIONS WITHDRAWN 2 $70,455 2 $57,530 1 $59,380 FILES CLOSED FOR INCOMPLETENESS 0 $0 1 $35,930 0 $0
Aggregated Statistics For Year 2004(Based on 6 partial tracts) A) Conventional B) Refinancings C) Non-occupant Loans on Number Average Value Number Average Value Number Average Value
LOANS ORIGINATED 32 $55,298 31 $66,209 16 $45,558 APPLICATIONS APPROVED, NOT ACCEPTED 5 $46,856 4 $71,472 3 $44,423 APPLICATIONS DENIED 0 $0 0 $0 0 $0 APPLICATIONS WITHDRAWN 2 $48,635 3 $67,293 1 $32,100 FILES CLOSED FOR INCOMPLETENESS 1 $72,510 0 $0 0 $0
Aggregated Statistics For Year 2003(Based on 7 partial tracts) A) Conventional B) Refinancings C) Non-occupant Loans on Number Average Value Number Average Value Number Average Value
LOANS ORIGINATED 30 $63,708 31 $61,475 15 $51,366 APPLICATIONS APPROVED, NOT ACCEPTED 4 $42,338 8 $67,831 2 $48,105 APPLICATIONS DENIED 0 $0 0 $0 0 $0 APPLICATIONS WITHDRAWN 2 $56,855 3 $47,940 2 $52,900 FILES CLOSED FOR INCOMPLETENESS 0 $0 0 $0 0 $0
Aggregated Statistics For Year 2002(Based on 7 partial tracts) A) Conventional B) Refinancings C) Non-occupant Loans on Number Average Value Number Average Value Number Average Value
LOANS ORIGINATED 24 $49,648 35 $65,010 8 $38,135 APPLICATIONS APPROVED, NOT ACCEPTED 3 $70,347 9 $65,118 2 $48,510 APPLICATIONS DENIED 0 $0 2 $71,620 1 $87,390 APPLICATIONS WITHDRAWN 0 $0 2 $76,190 0 $0 FILES CLOSED FOR INCOMPLETENESS 0 $0 0 $0 0 $0
Aggregated Statistics For Year 2001(Based on 7 partial tracts) A) Conventional B) Refinancings C) Non-occupant Loans on Number Average Value Number Average Value Number Average Value
LOANS ORIGINATED 17 $61,048 22 $68,771 7 $43,889 APPLICATIONS APPROVED, NOT ACCEPTED 3 $40,563 7 $55,383 3 $50,427 APPLICATIONS DENIED 1 $15,970 2 $48,485 1 $15,970 APPLICATIONS WITHDRAWN 1 $58,820 2 $97,135 0 $0 FILES CLOSED FOR INCOMPLETENESS 0 $0 1 $68,430 0 $0
Aggregated Statistics For Year 2000(Based on 6 partial tracts) A) Conventional B) Refinancings C) Non-occupant Loans on Number Average Value Number Average Value Number Average Value
LOANS ORIGINATED 13 $53,059 13 $44,328 6 $39,622 APPLICATIONS APPROVED, NOT ACCEPTED 3 $49,893 1 $54,610 1 $90,290 APPLICATIONS DENIED 0 $0 1 $48,060 0 $0 APPLICATIONS WITHDRAWN 0 $0 0 $0 0 $0 FILES CLOSED FOR INCOMPLETENESS 0 $0 0 $0 0 $0
Aggregated Statistics For Year 1999(Based on 6 partial tracts) A) Conventional B) Refinancings C) Non-occupant Loans on Number Average Value Number Average Value Number Average Value
LOANS ORIGINATED 10 $60,055 17 $54,395 1 $32,170 APPLICATIONS APPROVED, NOT ACCEPTED 1 $132,100 2 $48,825 0 $0 APPLICATIONS DENIED 2 $56,920 0 $0 0 $0 APPLICATIONS WITHDRAWN 0 $0 1 $47,630 0 $0 FILES CLOSED FOR INCOMPLETENESS 0 $0 0 $0 0 $0
2002 - 2018 National Fire Incident Reporting System (NFIRS) incidents See full 2006 National Fire Incident Reporting System statistics for zip code 35208, Alabama
Most common first names in zip code 35208 among deceased individuals Name Count Lived (average)
James 233 73.0 years Mary 208 77.7 years John 185 73.4 years William 169 73.8 years Willie 115 73.2 years Robert 104 70.9 years George 79 77.2 years Annie 78 78.4 years Charles 78 71.0 years Henry 60 73.9 years
Most common last names in zip code 35208 among deceased individuals Last name Count Lived (average)
Smith 98 74.5 years Jones 92 73.4 years Williams 83 73.2 years Johnson 73 74.9 years Brown 62 72.1 years Thomas 53 72.1 years Davis 48 75.6 years Harris 46 74.0 years Martin 44 75.5 years Moore 40 70.4 years
Businesses in zip code 35208
Name Count Name Count
Arby's 1 Nike 3 AutoZone 1 Payless 1 Burger King 1 Pizza Hut 1 CVS 1 Popeyes 1 Catherines 1 RadioShack 1 Firestone Complete Auto Care 1 Rite Aid 1 Foot Locker 1 Subway 1 GameStop 1 T-Mobile 2 KFC 1 Taco Bell 1 Little Caesars Pizza 1 U-Haul 1 McDonald's 1

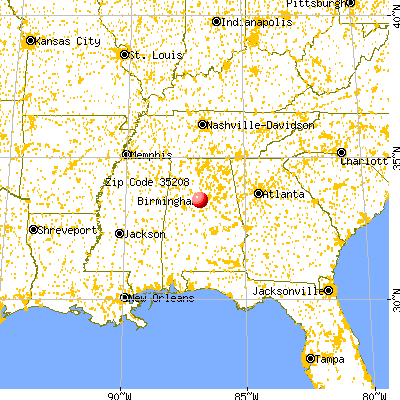


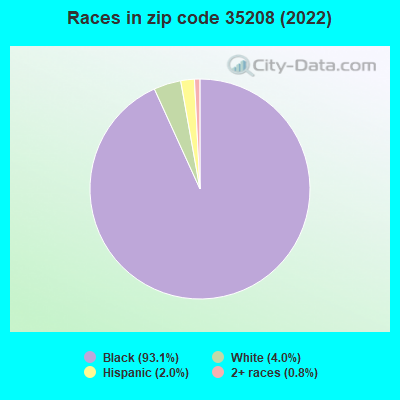


 Nearest zip codes: 35218, 35254, 35064, 35204, 35211, 35221.
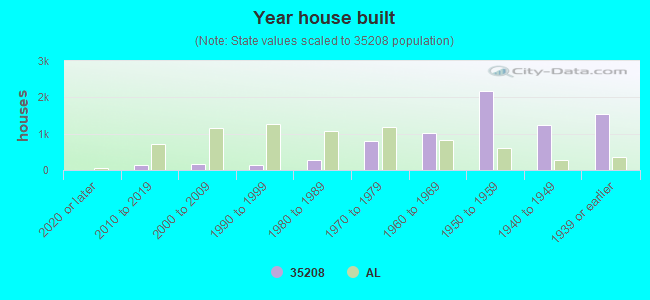

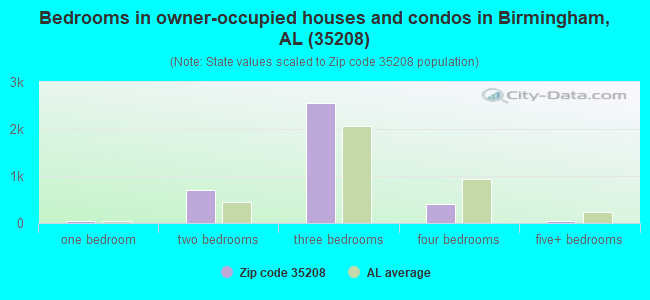
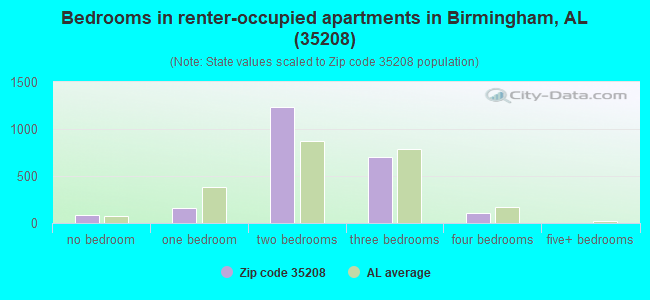
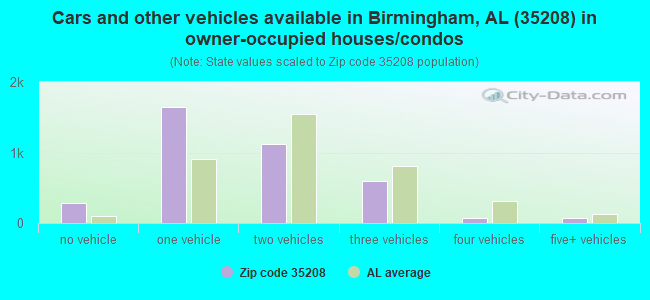
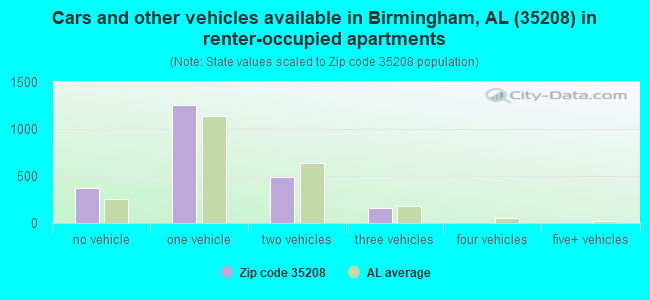


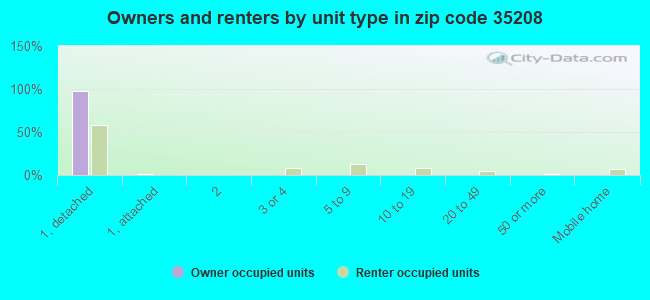
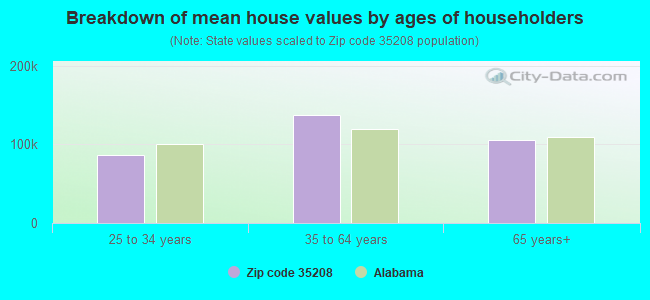


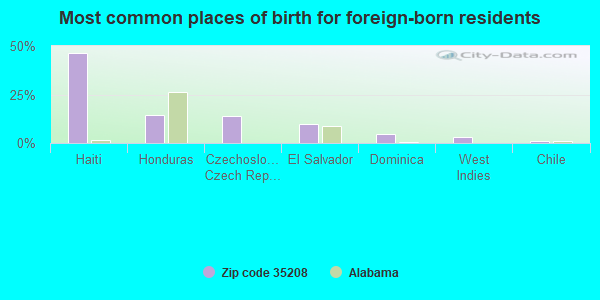
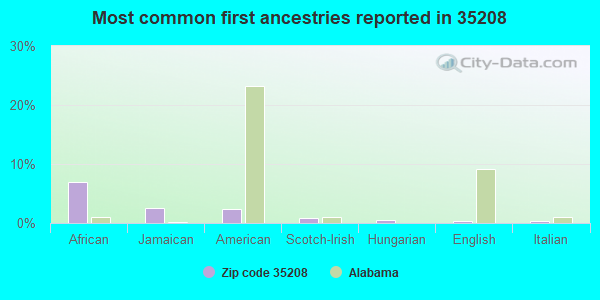
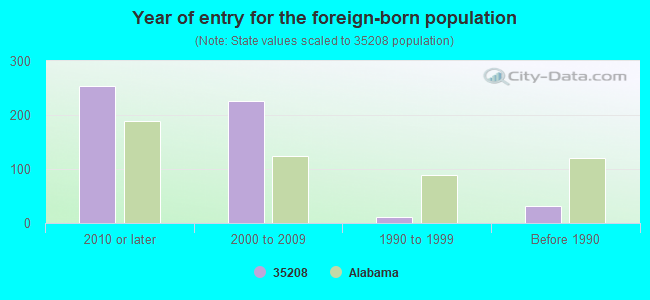
 (Students: 184, Location: 1900 43RD STREET ENSLEY, Grades: KG-12)
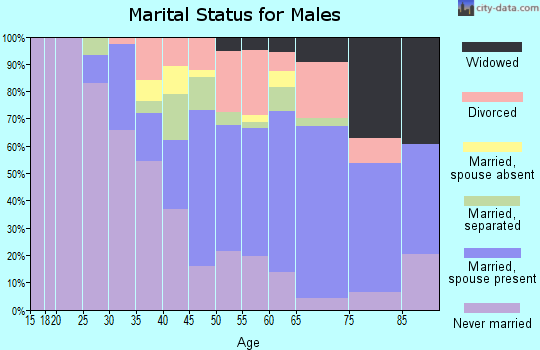
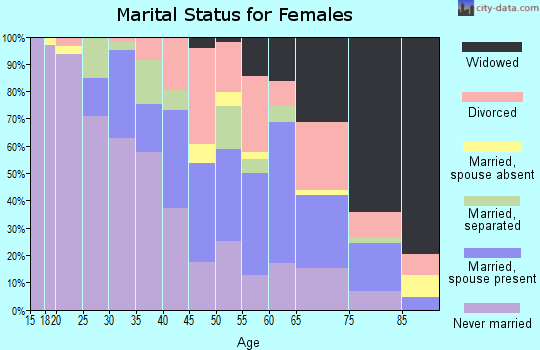
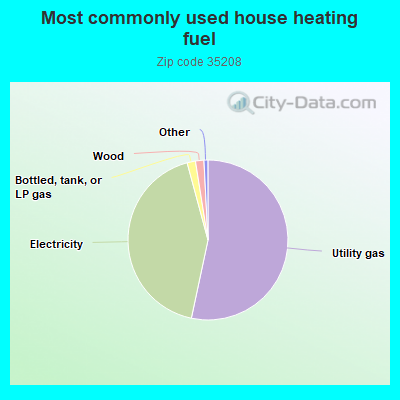
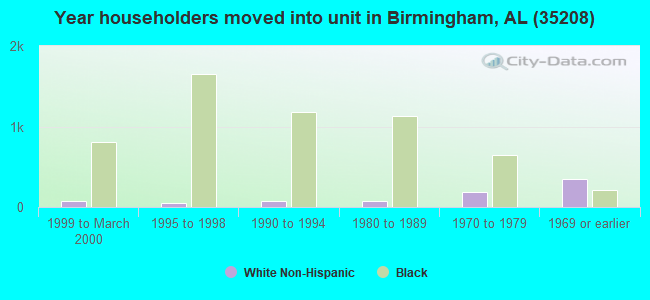
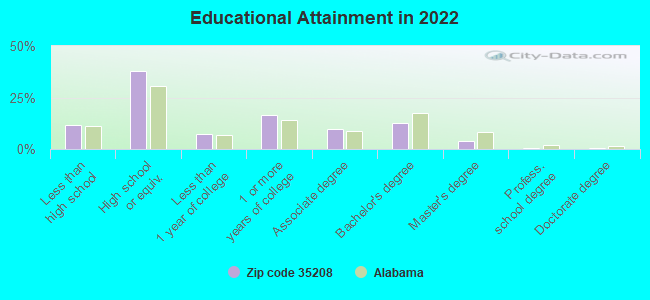
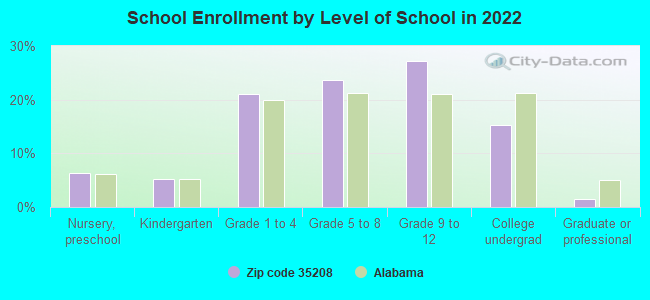
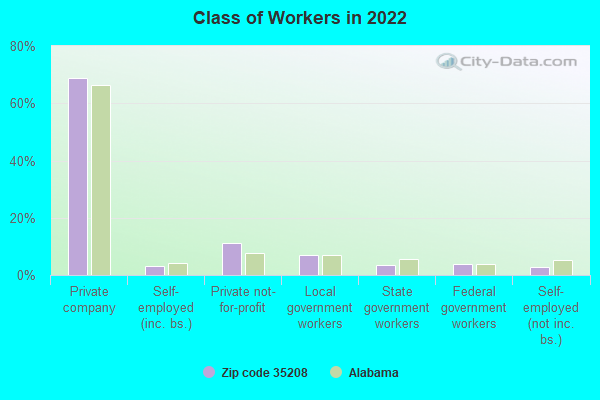
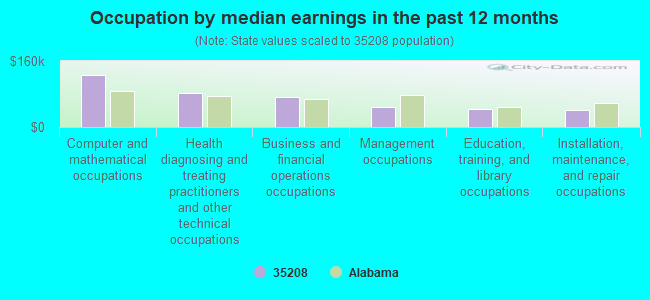
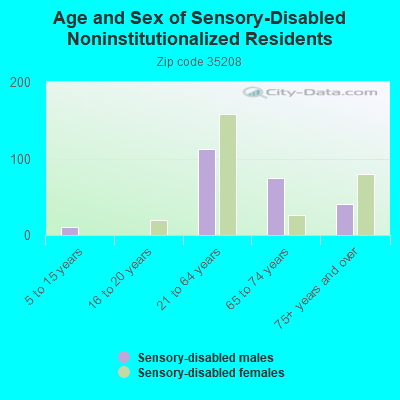
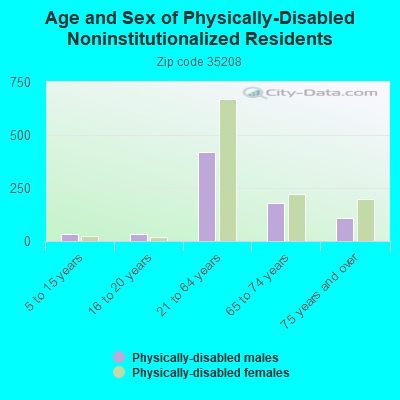
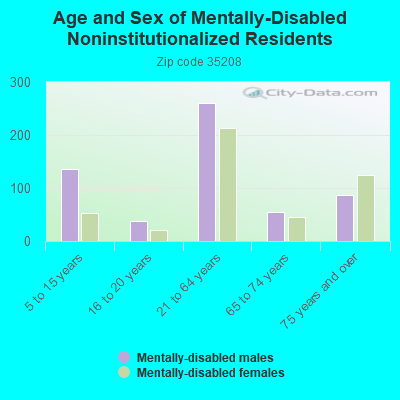
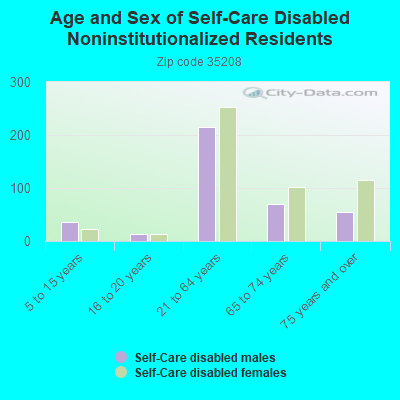
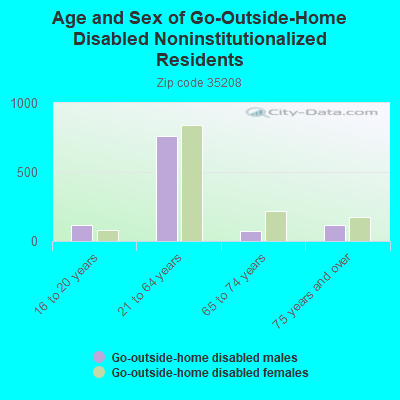
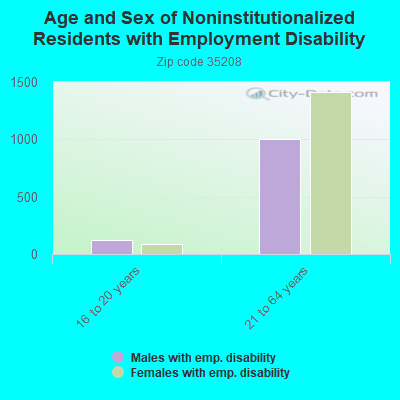
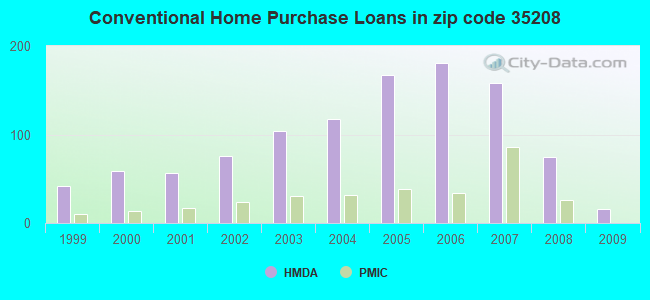
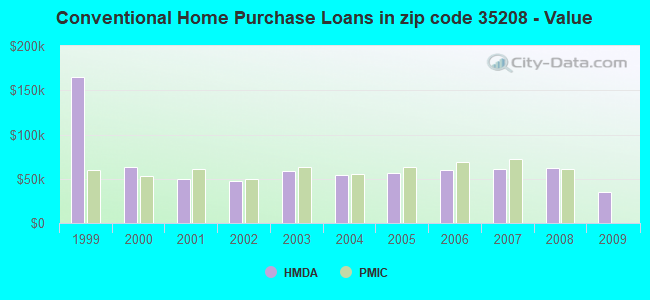
 According to the data from the years 2002 - 2018 the average number of fires per year is 112. The highest number of fires - 213 took place in 2003, and the least - 0 in 2012. The data has a decreasing trend.
 When looking into fire subcategories, the most incidents belonged to: Structure Fires (49.9%), and Mobile Property/Vehicle Fires (24.2%).