Estimated zip code population in 2022: 21,810 Zip code population in 2010: 21,725 Zip code population in 2000: 19,816
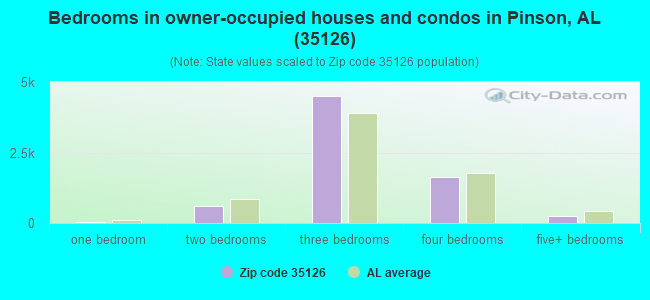
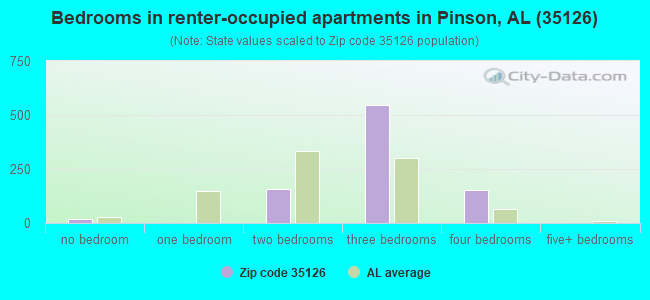
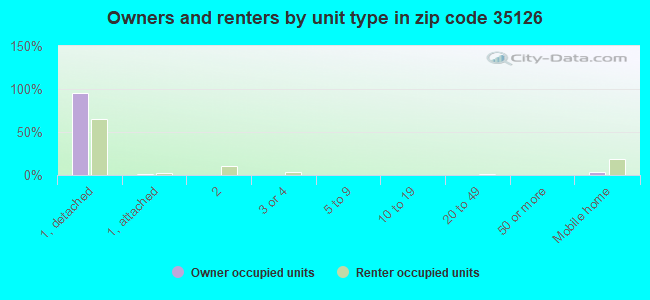
Houses and condos: 8,494 Renter-occupied apartments: 870
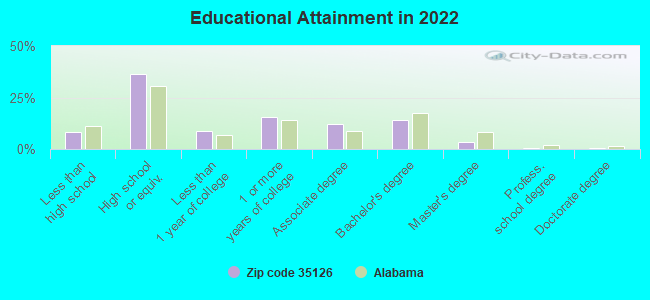
% of renters here:
11%
State:
30%
March 2022 cost of living index in zip code 35126: 86.9 (less than average, U.S. average is 100)
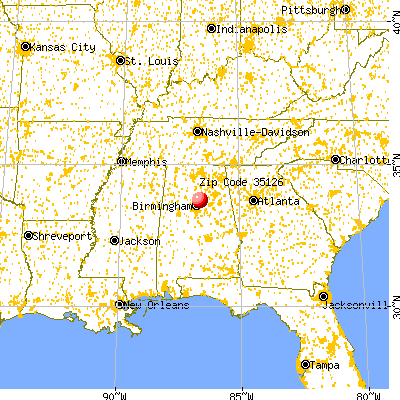
Land area: 58.2 sq. mi. Water area: 0.6 sq. mi.
Population density: 375 people per square mile
(very low).
OSM Map
General Map
Google Map
MSN Map
OSM Map
General Map
Google Map
MSN Map
OSM Map
General Map
Google Map
MSN Map
OSM Map
General Map
Google Map
MSN Map
Please wait while loading the map...
Real estate property taxes paid for housing units in 2022:
This zip code:
0.4% ($856)
Alabama:
0.4% ($718)
Median real estate property taxes paid for housing units with mortgages in 2022: $887 (0.4%) Median real estate property taxes paid for housing units with no mortgage in 2022: $783 (0.4%)
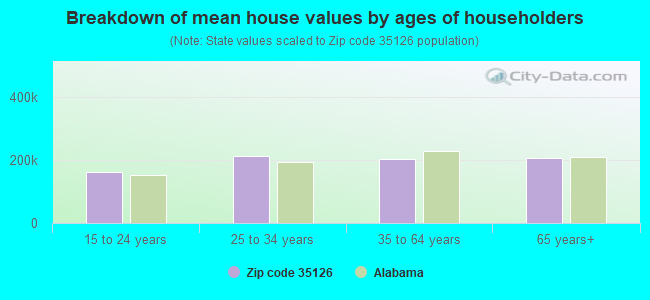
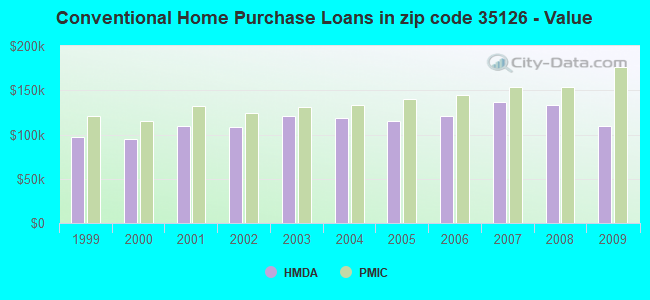
Estimated median house/condo value in 2022: $195,525
35126:
$195,525
Alabama:
$200,900
According to our research of Alabama and other state lists, there were 44 registered sex offenders living in 35126 zip code as of April 26, 2024. The ratio of all residents to sex offenders in zip code 35126 is 491 to 1. The ratio of registered sex offenders to all residents in this zip code is near the state average.
Median resident age:
This zip code:
37.7 years
Alabama median age:
39.6 years
Average household size:
This zip code:
2.8 people
Alabama:
2.5 people
Averages for the 2020 tax year for zip code 35126, filed in 2021:
Average Adjusted Gross Income (AGI) in 2020: $52,413 (Individual Income Tax Returns)
Here:
$52,413
State:
$63,984
Salary/wage: $48,982 (reported on 83.2% of returns)
Here:
$48,982
State:
$52,834
(% of AGI for various income ranges: 1212.3% for AGIs below $25k, 3748.9% for AGIs $25k-50k, 7005.8% for AGIs $50k-75k, 9946.2% for AGIs $75k-100k, 18176.2% for AGIs $100k-200k, 48725.0% for AGIs over 200k)
Taxable interest for individuals: $1,007 (reported on 20.9% of returns)
This zip code:
$1,007
Alabama:
$1,615
(% of AGI for various income ranges: 14.1% for AGIs below $25k, 15.3% for AGIs $25k-50k, 24.2% for AGIs $50k-75k, 33.2% for AGIs $75k-100k, 108.7% for AGIs $100k-200k, 450.0% for AGIs over 200k)
Ordinary dividends: $2,569 (reported on 9.7% of returns)
Here:
$2,569
State:
$7,660
(% of AGI for various income ranges: 12.1% for AGIs below $25k, 10.2% for AGIs $25k-50k, 31.5% for AGIs $50k-75k, 58.5% for AGIs $75k-100k, 145.5% for AGIs $100k-200k, 560.0% for AGIs over 200k)
Net capital gain/loss in AGI: +$5,941 (reported on 7.9% of returns)
Here:
+$5,941
State:
+$23,528
(% of AGI for various income ranges: 7.3% for AGIs below $25k, 8.1% for AGIs $25k-50k, 40.3% for AGIs $50k-75k, 68.9% for AGIs $75k-100k, 296.4% for AGIs $100k-200k, 3525.0% for AGIs over 200k)
Profit/loss from business: +$4,831 (reported on 17.8% of returns)
Here:
+$4,831
State:
+$9,534
(% of AGI for various income ranges: 77.5% for AGIs below $25k, 105.5% for AGIs $50k-75k, 133.0% for AGIs $75k-100k, 565.2% for AGIs $100k-200k, 2487.5% for AGIs over 200k)
Taxable individual retirement arrangement distribution: $15,437 (reported on 8.3% of returns)
35126:
$15,437
Alabama:
$19,004
(% of AGI for various income ranges: 59.8% for AGIs below $25k, 87.7% for AGIs $25k-50k, 171.8% for AGIs $50k-75k, 261.1% for AGIs $75k-100k, 835.8% for AGIs $100k-200k)
Total itemized deductions: $25,489 (reported on 7.6% of returns)
Here:
$25,489
State:
$37,338
(% of AGI for various income ranges: 27.4% for AGIs below $25k, 115.4% for AGIs $25k-50k, 307.4% for AGIs $50k-75k, 397.7% for AGIs $75k-100k, 1110.0% for AGIs $100k-200k, 5712.5% for AGIs over 200k)
Charity contributions: $9,037 (reported on 6.8% of returns)
Here:
$9,037
State:
$18,005
(% of AGI for various income ranges: 4.3% for AGIs below $25k, 17.6% for AGIs $25k-50k, 80.8% for AGIs $50k-75k, 117.3% for AGIs $75k-100k, 467.7% for AGIs $100k-200k, 1922.5% for AGIs over 200k)
Taxes paid: $5,605 (reported on 7.5% of returns)
35126:
$5,605
State:
$6,484
(% of AGI for various income ranges: 2.7% for AGIs below $25k, 16.0% for AGIs $25k-50k, 71.4% for AGIs $50k-75k, 97.5% for AGIs $75k-100k, 273.0% for AGIs $100k-200k, 1087.5% for AGIs over 200k)
Earned income credit: $2,617 (reported on 19.2% of returns)
Here:
$2,617
State:
$2,628
(% of AGI for various income ranges: 127.2% for AGIs below $25k, 84.6% for AGIs $25k-50k)
Percentage of individuals using paid preparers for their 2020 taxes: 92.2%
Here:
92%
State:
93%
(% for various income ranges: 91.5% for AGIs below $25k, 93.1% for AGIs $25k-50k, 91.6% for AGIs $50k-75k, 91.3% for AGIs $75k-100k, 93.1% for AGIs $100k-200k, 100.0% for AGIs over 200k)
Averages for the 2012 tax year for zip code 35126, filed in 2013:
Average Adjusted Gross Income (AGI) in 2012: $51,314 (Individual Income Tax Returns)
Here:
$51,314
State:
$52,001
Salary/wage: $47,341 (reported on 86.7% of returns)
Here:
$47,341
State:
$43,822
(% of AGI for various income ranges: 75.4% for AGIs below $25k, 82.9% for AGIs $25k-50k, 81.9% for AGIs $50k-75k, 81.6% for AGIs $75k-100k, 82.5% for AGIs $100k-200k, 55.6% for AGIs over 200k)
Taxable interest for individuals: $917 (reported on 28.1% of returns)
This zip code:
$917
Alabama:
$1,592
(% of AGI for various income ranges: 1.1% for AGIs below $25k, 0.5% for AGIs $25k-50k, 0.5% for AGIs $50k-75k, 0.4% for AGIs $75k-100k, 0.3% for AGIs $100k-200k, 1.1% for AGIs over 200k)
Ordinary dividends: $1,876 (reported on 12.5% of returns)
Here:
$1,876
State:
$5,697
(% of AGI for various income ranges: 0.9% for AGIs below $25k, 0.4% for AGIs $25k-50k, 0.4% for AGIs $50k-75k, 0.4% for AGIs $75k-100k, 0.4% for AGIs $100k-200k, 0.7% for AGIs over 200k)
Net capital gain/loss in AGI: +$3,973 (reported on 7.7% of returns)
Here:
+$3,973
State:
+$13,286
(% of AGI for various income ranges: 0.2% for AGIs $50k-75k, 0.4% for AGIs $75k-100k, 0.7% for AGIs $100k-200k, 4.3% for AGIs over 200k)
Profit/loss from business: +$7,794 (reported on 14.9% of returns)
Here:
+$7,794
State:
+$9,151
(% of AGI for various income ranges: 7.3% for AGIs below $25k, 1.6% for AGIs $25k-50k, 1.9% for AGIs $50k-75k, 1.1% for AGIs $75k-100k, 2.7% for AGIs $100k-200k)
Taxable individual retirement arrangement distribution: $13,104 (reported on 9.5% of returns)
35126:
$13,104
Alabama:
$14,992
(% of AGI for various income ranges: 3.9% for AGIs below $25k, 2.4% for AGIs $25k-50k, 2.2% for AGIs $50k-75k, 2.5% for AGIs $75k-100k, 2.7% for AGIs $100k-200k)
Total itemized deductions: $18,970 (24% of AGI, reported on 38.2% of returns)
Here:
$18,970
State:
$21,388
Here:
23.6% of AGI
State:
20.1% of AGI
(% of AGI for various income ranges: 12.2% for AGIs below $25k, 13.5% for AGIs $25k-50k, 13.8% for AGIs $50k-75k, 14.4% for AGIs $75k-100k, 15.1% for AGIs $100k-200k, 14.1% for AGIs over 200k)
Charity contributions: $4,894 (reported on 33.4% of returns)
Here:
$4,894
State:
$5,925
(% of AGI for various income ranges: 1.6% for AGIs below $25k, 2.2% for AGIs $25k-50k, 2.7% for AGIs $50k-75k, 3.4% for AGIs $75k-100k, 3.8% for AGIs $100k-200k, 5.8% for AGIs over 200k)
Taxes paid: $4,473 (reported on 38.0% of returns)
35126:
$4,473
State:
$5,272
(% of AGI for various income ranges: 1.4% for AGIs below $25k, 2.3% for AGIs $25k-50k, 3.1% for AGIs $50k-75k, 3.4% for AGIs $75k-100k, 4.3% for AGIs $100k-200k, 4.5% for AGIs over 200k)
Earned income credit: $2,285 (reported on 17.5% of returns)
Here:
$2,285
State:
$2,646
(% of AGI for various income ranges: 7.0% for AGIs below $25k, 1.2% for AGIs $25k-50k)
Percentage of individuals using paid preparers for their 2012 taxes: 52.6%
Here:
53%
State:
60%
(% for various income ranges: 50.2% for AGIs below $25k, 52.3% for AGIs $25k-50k, 55.1% for AGIs $50k-75k, 54.3% for AGIs $75k-100k, 53.2% for AGIs $100k-200k, 77.8% for AGIs over 200k)
Averages for the 2004 tax year for zip code 35126, filed in 2005:
Average Adjusted Gross Income (AGI) in 2004: $44,865 (Individual Income Tax Returns)
Here:
$44,865
State:
$42,302
Salary/wage: $42,657 (reported on 88.2% of returns)
Here:
$42,657
State:
$36,626
(% of AGI for various income ranges: 115.2% for AGIs below $10k, 75.8% for AGIs $10k-25k, 85.7% for AGIs $25k-50k, 86.9% for AGIs $50k-75k, 87.2% for AGIs $75k-100k, 77.5% for AGIs over 100k)
Taxable interest for individuals: $1,127 (reported on 38.3% of returns)
This zip code:
$1,127
Alabama:
$1,827
(% of AGI for various income ranges: 5.3% for AGIs below $10k, 2.0% for AGIs $10k-25k, 0.8% for AGIs $25k-50k, 0.6% for AGIs $50k-75k, 0.6% for AGIs $75k-100k, 1.2% for AGIs over 100k)
Taxable dividends: $1,725 (reported on 15.7% of returns)
Here:
$1,725
State:
$4,206
(% of AGI for various income ranges: 1.3% for AGIs below $10k, 0.6% for AGIs $10k-25k, 0.4% for AGIs $25k-50k, 0.3% for AGIs $50k-75k, 0.4% for AGIs $75k-100k, 1.2% for AGIs over 100k)
Net capital gain/loss: +$6,544 (reported on 10.9% of returns)
Here:
+$6,544
State:
+$13,031
(% of AGI for various income ranges: -1.2% for AGIs below $10k, 0.2% for AGIs $10k-25k, 0.1% for AGIs $25k-50k, 0.3% for AGIs $50k-75k, 0.5% for AGIs $75k-100k, 5.3% for AGIs over 100k)
Profit/loss from business: +$8,342 (reported on 15.5% of returns)
Here:
+$8,342
State:
+$8,302
(% of AGI for various income ranges: 13.3% for AGIs below $10k, 7.1% for AGIs $10k-25k, 2.7% for AGIs $25k-50k, 2.1% for AGIs $50k-75k, 2.1% for AGIs $75k-100k, 2.6% for AGIs over 100k)
IRA payment deduction: $2,956 (reported on 2.3% of returns)
35126:
$2,956
Alabama:
$3,006
(% of AGI for various income ranges: 0.3% for AGIs $10k-25k, 0.2% for AGIs $25k-50k, 0.1% for AGIs $50k-75k, 0.1% for AGIs $75k-100k, 0.1% for AGIs over 100k)
Self-employed pension: $8,810 (reported on 0.2% of returns)
Here:
$8,810
Alabama:
$17,165
Total itemized deductions: $16,176 (23% of AGI, reported on 43.5% of returns)
Here:
$16,176
State:
$17,623
Here:
23.1% of AGI
State:
20.8% of AGI
(% of AGI for various income ranges: 17.4% for AGIs below $10k, 12.2% for AGIs $10k-25k, 14.7% for AGIs $25k-50k, 16.3% for AGIs $50k-75k, 17.1% for AGIs $75k-100k, 15.7% for AGIs over 100k)
Charity contributions deductions: $3,569 (5% of AGI, reported on 39.8% of returns)
Here:
$3,569
State:
$4,768
Here:
5.0% of AGI
State:
5.4% of AGI
(% of AGI for various income ranges: 1.3% for AGIs below $10k, 2.1% for AGIs $10k-25k, 2.5% for AGIs $25k-50k, 3.1% for AGIs $50k-75k, 3.6% for AGIs $75k-100k, 3.9% for AGIs over 100k)
Total tax: $5,515 (reported on 77.4% of returns)
35126:
$5,515
State:
$6,905
(% of AGI for various income ranges: 4.0% for AGIs below $10k, 4.4% for AGIs $10k-25k, 6.1% for AGIs $25k-50k, 8.1% for AGIs $50k-75k, 9.8% for AGIs $75k-100k, 15.2% for AGIs over 100k)
Earned income credit: $1,777 (reported on 12.8% of returns)
Here:
$1,777
State:
$2,048
Percentage of individuals using paid preparers for their 2004 taxes: 55.7%
Here:
56%
State:
65%
(% for various income ranges: 44.6% for AGIs below $10k, 59.2% for AGIs $10k-25k, 59.0% for AGIs $25k-50k, 57.9% for AGIs $50k-75k, 56.4% for AGIs $75k-100k, 56.5% for AGIs over 100k)
Likely homosexual households (counted as self-reported same-sex unmarried-partner households)
Lesbian couples: 0.2% of all households
Gay men: 0.0% of all households
Household received Food Stamps/SNAP in the past 12 months: 1,098 Household did not receive Food Stamps/SNAP in the past 12 months: 6,833
Women who had a birth in the past 12 months: 169 (164 now married, 19 unmarried) Women who did not have a birth in the past 12 months: 5,254 (2,115 now married, 3,140 unmarried)
Housing units in zip code 35126 with a mortgage: 4,940 (688 second mortgage, 17 home equity loan, 505 both second mortgage and home equity loan) Houses without a mortgage: 63
Median monthly owner costs for units with a mortgage: $1,241 Median monthly owner costs for units without a mortgage: $409
Residents with income below the poverty level in 2022:
This zip code:
9.6%
Whole state:
16.2%
Residents with income below 50% of the poverty level in 2022:
This zip code:
6.7%
Whole state:
8.6%
Median number of rooms in houses and condos:
Here:
6.5
State:
6.5
Median number of rooms in apartments:
Here:
5.4
State:
4.7
Notable locations in this zip code not listed on our city pages
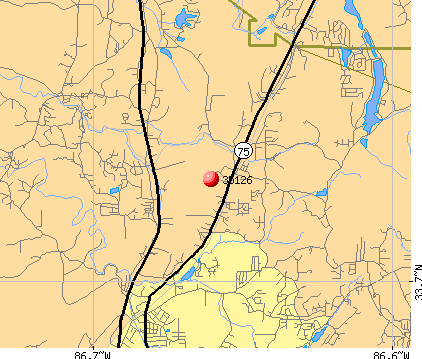
Notable locations in zip code 35126: Turkey Creek Landfill (A), Emerald Valley Resort (B), Camp Crosby (C), Palmerdale Fire District (D), Center Point Fire and Rescue Station 4 (E). Display/hide their locations on the map
Churches in zip code 35126 include: Pinson United Methodist Church (A), Oak Grove Church (B), Palmerdale Presbyterian Church (C), Cedar Mount Baptist Church (D), Bradford United Methodist Church (E), Mount Pinson Presbyterian Church (F), First Baptist Church (G), Sunnyside Church (H), Bethel United Methodist Church (I). Display/hide their locations on the map
Lakes and reservoirs: Silver Lake (A), Canoe Creek Lake (B), Lake Pittman (C), Woodhaven Lake (D), Shadow Lake (E), Zamora Lake (F), Hilldale Farm Lake (G), Shadow Lake (H). Display/hide their locations on the map
2,846 married couples with children.
1,309 single-parent households (161 men, 1,148 women).
95.4% of residents of 35126 zip code speak English at home.
2.0% of residents speak Spanish at home (81% very well, 14% well, 5% not well).
0.9% of residents speak other Indo-European language at home (60% very well, 40% well).
1.6% of residents speak Asian or Pacific Island language at home (22% very well, 78% well).
0.1% of residents speak other language at home (100% well).
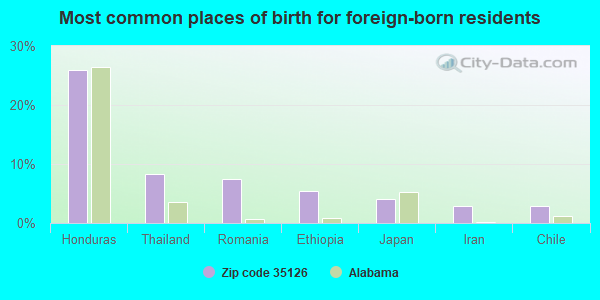
Foreign born population: 574 (2.6%) (31.9% of them are naturalized citizens)
This zip code:
2.6%
Whole state:
3.8%
26%Honduras
8%Thailand
7%Romania
5%Ethiopia
4%Japan
3%Iran
3%Chile
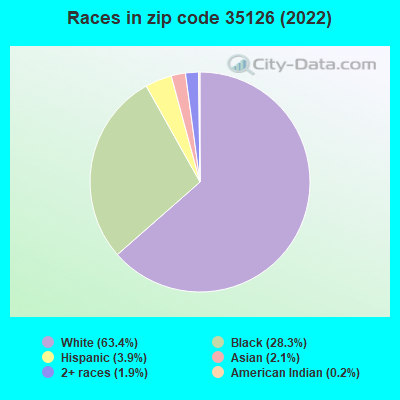
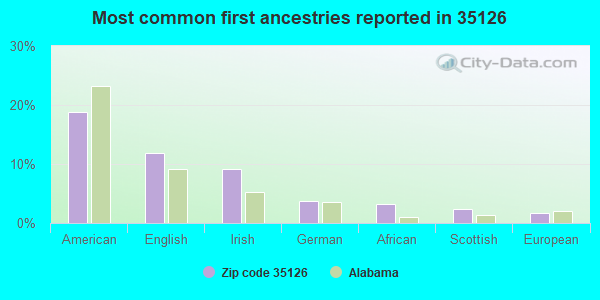
19%American
12%English
9%Irish
4%German
3%African
2%Scottish
2%European
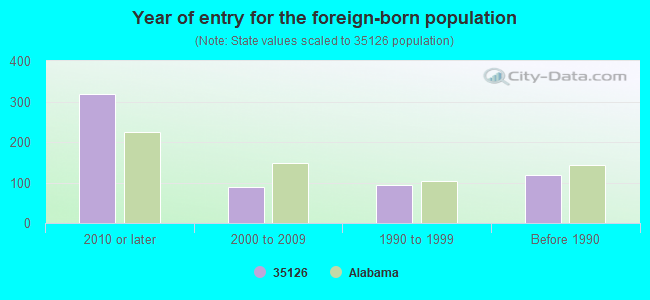
Year of entry for the foreign-born population
3192010 or later
892000 to 2009
941990 to 1999
118Before 1990
Major facilities with environmental interests located in this zip code:
ACME INDUSTRIAL COATINGS (RED HOLLOW RD. in PINSON, AL)
PINSON ELEMENTARY SCHOOL (4200 SCHOOL DR in PINSON, AL)
(Geographic Names Information System) (National Center for Education Statistics) - STATE ID-0700 Organizations: JEFFERSON COUNTY (SCHOOL DISTRICT)
ASPEN RIDGE (SALISBURY DEVELOPMENT CO LLC in PINSON, AL)
National Pollutant Discharge Elimination System NON-MAJOR (Tracking pollutant discharge elimination systems) - permit National Pollutant Discharge Elimination System NON-MAJOR (Tracking pollutant discharge elimination systems) - permit Business SIC classification: GENERAL CONTRACTORS-SINGLE-FAMILY HOUSES Alternative names: SALISBURY DEV CO ASPEN RIDGE
C AND L PLASTICS (GILMER INDUSTRIAL PARK in PINSON, AL)
National Pollutant Discharge Elimination System NON-MAJOR (Tracking pollutant discharge elimination systems) - permit (Resource Conservation and Recovery Act (tracking hazardous waste)) Business SIC classification: FABRICATED RUBBER PRODUCTS Business NAICS classification: UNLAMINATED PLASTICS FILM AND SHEET (EXCEPT PACKAGING) MANUFACTURING. Organizations: C AND L PLASTICS INC (CONTACT/OWNER)
, C & L PLASTICS INC (CONTACT/OWNER)
CLAY-CHALKVILLE HIGH SCHOOL (6623 ROE CHANDLER RD in PINSON, AL)
(National Center for Education Statistics) - STATE ID-0185 Organizations: JEFFERSON COUNTY (SCHOOL DISTRICT)
RUDD MIDDLE SCHOOL (4526 RUDD SCHOOL RD in PINSON, AL)
(National Center for Education Statistics) - STATE ID-0790 Organizations: JEFFERSON COUNTY (SCHOOL DISTRICT)
KERMIT JOHNSON SCHOOL (8300 KERMIT JOHNSON RD in PINSON, AL)
(National Center for Education Statistics) - STATE ID-0440 Organizations: JEFFERSON COUNTY (SCHOOL DISTRICT)
MIKE'S QUICK STOP, INC (7825 HWY 75 in PINSON, AL)
(Integrated Compliance Information System) - ICIS-HQ-1999-1197, FORMAL ENFORCEMENT ACTION Business SIC classification: GASOLINE SERVICE STATIONS
CARSON LANDING APARTMENTS (CARSON LANDING APARTMENTS LLC in PINSON, AL)
National Pollutant Discharge Elimination System NON-MAJOR (Tracking pollutant discharge elimination systems) - permit Business SIC classification: GENERAL CONTRACTORS-SINGLE-FAMILY HOUSES Alternative names: CARSON LANDING APARTMENTS LLC
CENTERPOINT ELEMENTARY SCHOOL (JEFFERSON CNTY BD OF EDUCATION in PINSON, AL)
National Pollutant Discharge Elimination System NON-MAJOR (Tracking pollutant discharge elimination systems) - permit Business SIC classification: GENERAL CONTRACTORS-NONRESIDENTIAL BUILDINGS, OTHER THAN INDUSTRIAL BUILDINGS AND WAREHOUSES Alternative names: CENTER POINT ELEMENTARY SCHOOL
PLYMOUNT TUBE CO (HWY 79 GILMER IND PARK in PINSON, AL)
(Resource Conservation and Recovery Act (tracking hazardous waste)) Business NAICS classification: IRON AND STEEL MILLS. Organizations: OPERNAME (CONTACT/OPERATOR)
, OWNERNAME (CONTACT/OWNER)
KERRI LANE ESTATES INCORP (WILLIAM A BRODRECHT in PINSON, AL)
National Pollutant Discharge Elimination System NON-MAJOR (Tracking pollutant discharge elimination systems) - permit Business SIC classification: GENERAL CONTRACTORS-SINGLE-FAMILY HOUSES
LIVINGSTON OAKS APARTMENST LLC (DAVID SUMRALL in PINSON, AL)
National Pollutant Discharge Elimination System NON-MAJOR (Tracking pollutant discharge elimination systems) - permit Business SIC classification: GENERAL CONTRACTORS-SINGLE-FAMILY HOUSES Organizations: LIVINGSTON OAKS APARTMENTS LLC (CONTACT/OPERATOR)
Alternative names: LIVINGSTON OAKS APRATMENTS LLC
Housing units lacking complete plumbing facilities: 0.5% Housing units lacking complete kitchen facilities: 0.6%
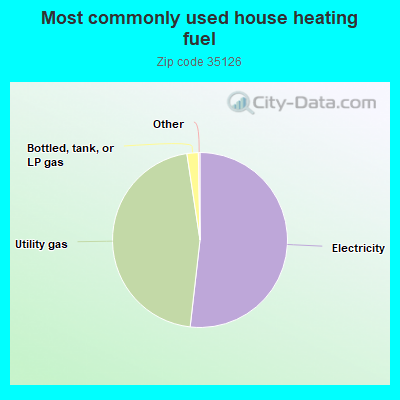
51.8%Electricity
45.8%Utility gas
2.1%Bottled, tank, or LP gas
Population in 1990: 17,068. Population change in the 1990s: +2,748 (+16.1%).
Place of birth for U.S.-born residents:
This state: 17,478
Northeast: 386
Midwest: 791
South: 2,240
West: 179
63% of the 35126 zip code residents lived in the same house 5 years ago. Out of people who lived in different houses, 72% lived in this county. Out of people who lived in different counties, 50% lived in Alabama.
93% of the 35126 zip code residents lived in the same house 1 year ago. Out of people who lived in different houses, 68% moved from this county. Out of people who lived in different houses, 14% moved from different county within same state. Out of people who lived in different houses, 13% moved from different state. Out of people who lived in different houses, 1% moved from abroad.
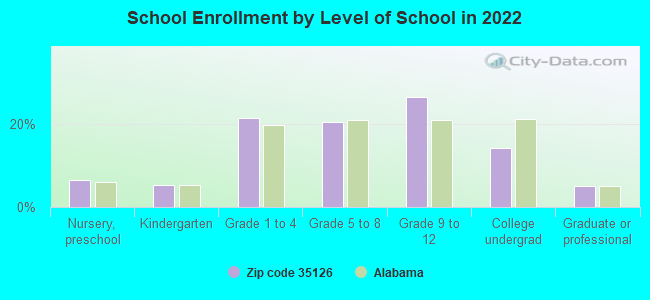
Private vs. public school enrollment:
Students in private schools in grades 1 to 8 (elementary and middle school): 449
Here:
22.7%
Alabama:
14.7%
Students in private schools in grades 9 to 12 (high school): 4
Here:
0.4%
Alabama:
16.3%
Students in private undergraduate colleges: 128
Here:
19.4%
Alabama:
14.6%
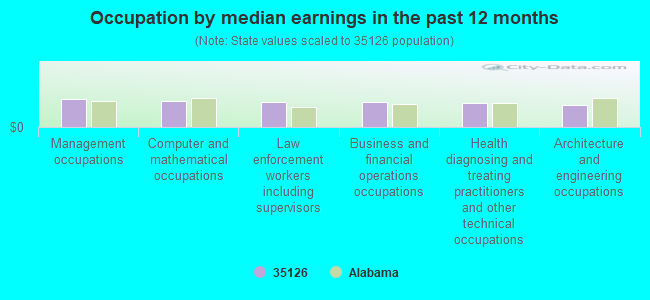
Occupation by median earnings in the past 12 months ($)
79,458Management occupations
73,725Computer and mathematical occupations
72,507Law enforcement workers including supervisors
72,205Business and financial operations occupations
68,265Health diagnosing and treating practitioners and other technical occupations
63,901Architecture and engineering occupations
Companies with federal contracts located in this zip code:
QUALLA CONTRACTORS, INC (8021 CEDAR MOUNTAIN RD in PINSON, AL; small business) : $307,595 in 4 contractsfrom 2005 to 2006
$179,061 with Navy for Construction of Structures and Facilities -- Exhibit Design (Non-Building). Taking place in TN. Signed on 2006-05-09. Completion date: 2006-09-06.
$113,426 with Navy for Site Preparation. Signed on 2005-08-11. Completion date: 2005-12-12.
$19,805 with Army for Miscellaneous Items. Signed on 2005-09-28. Completion date: 2005-10-28.
-$4,697 with Navy for Construction of Structures and Facilities -- Other Conservation and Development Facilities. Signed on 2005-10-06. Completion date: 2005-12-12.
AWTREY, ALVIN L JR (4201 COBBLESTONE CT in PINSON, AL; small business)
$6,450 with U.S. Army Corps of Engineers - civil program financing only for Recreation Site Maintenance Services (non-construction). Signed on 2003-03-14. Completion date: 2003-09-03.
Top industries in this zip code by the number of employees in 2005:
2004 - 2018 National Fire Incident Reporting System (NFIRS) incidents
According to the data from the years 2004 - 2018 the average number of fire incidents per year is 90. The highest number of reported fire incidents - 157 took place in 2010, and the least - 33 in 2012. The data has a declining trend.
When looking into fire subcategories, the most reports belonged to: Outside Fires (56.9%), and Structure Fires (26.6%).
Fire incident types reported to NFIRS in Zip Code 35126


 Nearest zip codes: 35215, 35235, 35116, 35133, 35173, 35172.


 According to the data from the years 2004 - 2018 the average number of fire incidents per year is 90. The highest number of reported fire incidents - 157 took place in 2010, and the least - 33 in 2012. The data has a declining trend.
 When looking into fire subcategories, the most reports belonged to: Outside Fires (56.9%), and Structure Fires (26.6%).