Estimated zip code population in 2022: 3,213 Zip code population in 2010: 3,635 Zip code population in 2000: 3,917
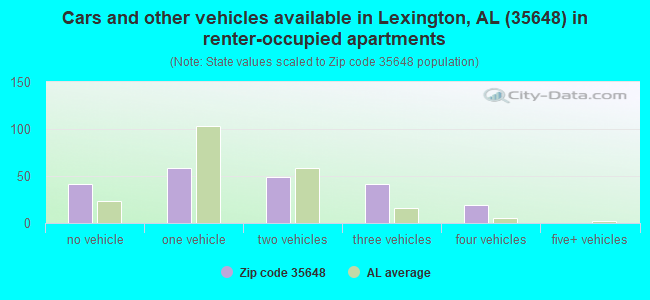
Houses and condos: 1,339 Renter-occupied apartments: 208
% of renters here:
17%
State:
30%
March 2022 cost of living index in zip code 35648: 80.5 (low, U.S. average is 100)
Land area: 58.1 sq. mi. Water area: 0.1 sq. mi.
Population density: 55 people per square mile
(very low).
OSM Map
General Map
Google Map
MSN Map
OSM Map
General Map
Google Map
MSN Map
OSM Map
General Map
Google Map
MSN Map
OSM Map
General Map
Google Map
MSN Map
Please wait while loading the map...
Real estate property taxes paid for housing units in 2022:
This zip code:
0.4% ($590)
Alabama:
0.4% ($718)
Median real estate property taxes paid for housing units with mortgages in 2022: $529 (0.3%) Median real estate property taxes paid for housing units with no mortgage in 2022: $739 (0.5%)
Business Search- 14 Million verified businesses
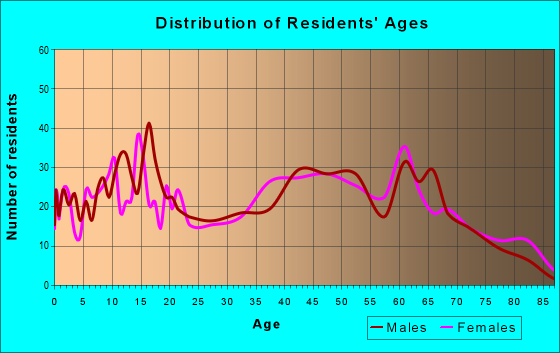
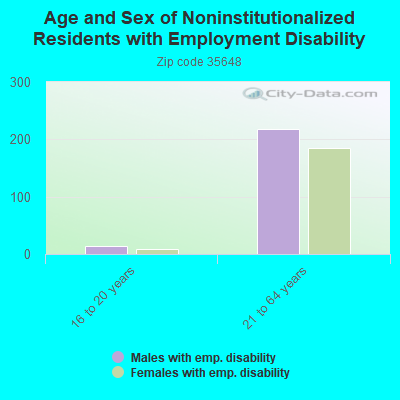
Males: 1,443
(44.9%)
Females: 1,769
(55.1%)
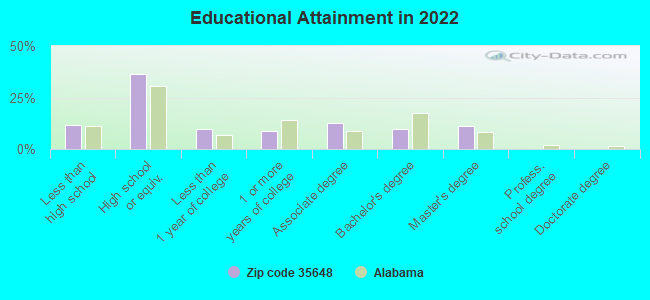
For population 25 years and over in 35648:
High school or higher: 88.4%
Bachelor's degree or higher: 20.6%
Graduate or professional degree: 11.0%
Unemployed: 2.9%
Mean travel time to work (commute): 37.8 minutes
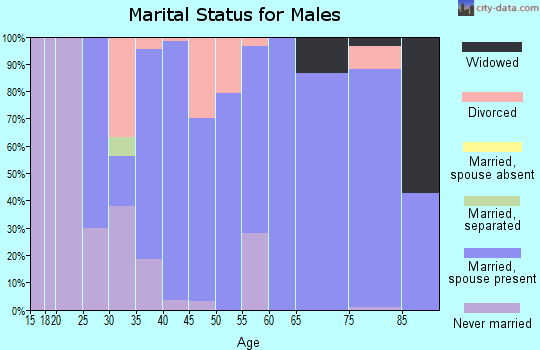
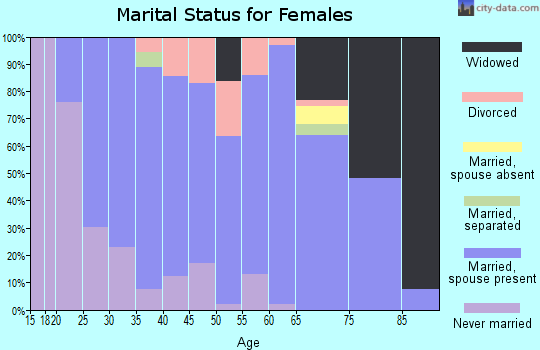
For population 15 years and over in 35648:
Never married: 24.6%
Now married: 60.8%
Separated: 0.1%
Widowed: 5.7%
Divorced: 8.8%
Zip code 35648 compared to state average:
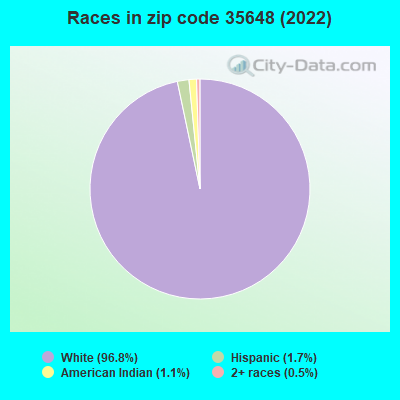
Black race population percentage significantly below state average.
Hispanic race population percentage below state average.
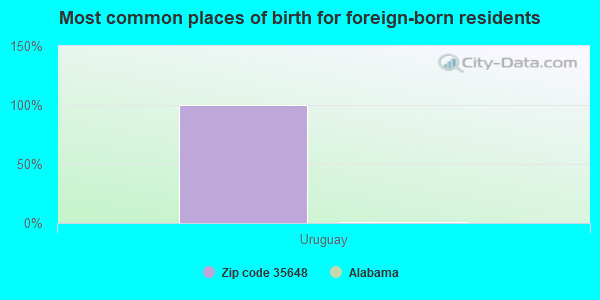
Foreign-born population percentage significantly below state average.
Renting percentage below state average.
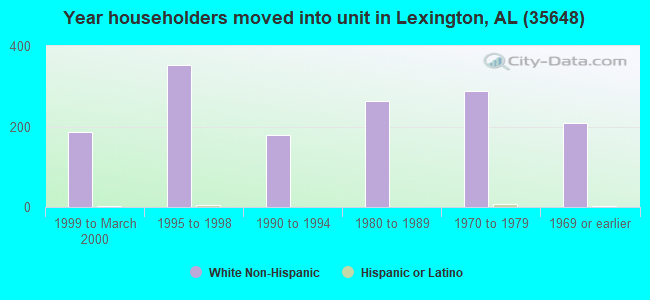
Length of stay since moving in significantly above state average.
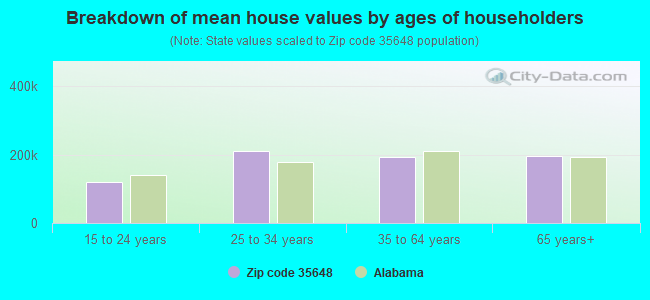
Estimated median house/condo value in 2022: $160,922
35648:
$160,922
Alabama:
$200,900
According to our research of Alabama and other state lists, there were 4 registered sex offenders living in 35648 zip code as of April 27, 2024. The ratio of all residents to sex offenders in zip code 35648 is 770 to 1. The ratio of registered sex offenders to all residents in this zip code is lower than the state average.
Median resident age:
This zip code:
42.6 years
Alabama median age:
39.6 years
Average household size:
This zip code:
2.6 people
Alabama:
2.5 people
Averages for the 2020 tax year for zip code 35648, filed in 2021:
Average Adjusted Gross Income (AGI) in 2020: $55,250 (Individual Income Tax Returns)
Here:
$55,250
State:
$63,984
Salary/wage: $53,743 (reported on 80.2% of returns)
Here:
$53,743
State:
$52,834
(% of AGI for various income ranges: 1175.5% for AGIs below $25k, 3611.6% for AGIs $25k-50k, 5982.6% for AGIs $50k-75k, 9382.7% for AGIs $75k-100k, 15041.3% for AGIs $100k-200k)
Taxable interest for individuals: $743 (reported on 38.9% of returns)
This zip code:
$743
Alabama:
$1,615
(% of AGI for various income ranges: 31.0% for AGIs below $25k, 41.6% for AGIs $25k-50k, 25.3% for AGIs $50k-75k, 27.3% for AGIs $75k-100k, 80.7% for AGIs $100k-200k)
Ordinary dividends: $1,441 (reported on 10.5% of returns)
Here:
$1,441
State:
$7,660
(% of AGI for various income ranges: 16.0% for AGIs below $25k, 8.1% for AGIs $25k-50k, 14.7% for AGIs $50k-75k, 34.7% for AGIs $75k-100k, 50.7% for AGIs $100k-200k)
Net capital gain/loss in AGI: +$4,328 (reported on 11.1% of returns)
Here:
+$4,328
State:
+$23,528
(% of AGI for various income ranges: 5.2% for AGIs below $25k, 14.8% for AGIs $25k-50k, 104.2% for AGIs $50k-75k, 94.0% for AGIs $75k-100k, 248.7% for AGIs $100k-200k)
Profit/loss from business: +$7,412 (reported on 15.4% of returns)
Here:
+$7,412
State:
+$9,534
(% of AGI for various income ranges: 171.8% for AGIs below $25k, 87.4% for AGIs $25k-50k, 98.4% for AGIs $50k-75k, 129.3% for AGIs $75k-100k, 342.7% for AGIs $100k-200k)
Taxable individual retirement arrangement distribution: $10,293 (reported on 8.6% of returns)
35648:
$10,293
Alabama:
$19,004
(% of AGI for various income ranges: 51.7% for AGIs below $25k, 93.2% for AGIs $25k-50k, 122.6% for AGIs $50k-75k, 240.7% for AGIs $75k-100k, 234.0% for AGIs $100k-200k)
Total itemized deductions: $25,967 (reported on 3.7% of returns)
Here:
$25,967
State:
$37,338
(% of AGI for various income ranges: 218.7% for AGIs $25k-50k, 586.7% for AGIs $100k-200k)
Charity contributions: $8,850 (reported on 2.5% of returns)
Here:
$8,850
State:
$18,005
(% of AGI for various income ranges: 236.0% for AGIs $100k-200k)
Taxes paid: $4,467 (reported on 3.7% of returns)
35648:
$4,467
State:
$6,484
(% of AGI for various income ranges: 22.6% for AGIs $25k-50k, 132.0% for AGIs $100k-200k)
Earned income credit: $2,381 (reported on 16.0% of returns)
Here:
$2,381
State:
$2,628
(% of AGI for various income ranges: 103.0% for AGIs below $25k, 66.8% for AGIs $25k-50k)
Percentage of individuals using paid preparers for their 2020 taxes: 96.3%
Here:
96%
State:
93%
(% for various income ranges: 96.3% for AGIs below $25k, 95.1% for AGIs $25k-50k, 95.8% for AGIs $50k-75k, 100.0% for AGIs $75k-100k, 95.0% for AGIs $100k-200k, 100.0% for AGIs over 200k)
Averages for the 2012 tax year for zip code 35648, filed in 2013:
Average Adjusted Gross Income (AGI) in 2012: $44,816 (Individual Income Tax Returns)
Here:
$44,816
State:
$52,001
Salary/wage: $44,534 (reported on 80.6% of returns)
Here:
$44,534
State:
$43,822
(% of AGI for various income ranges: 63.8% for AGIs below $25k, 77.8% for AGIs $25k-50k, 79.3% for AGIs $50k-75k, 86.9% for AGIs $75k-100k, 84.6% for AGIs $100k-200k)
Taxable interest for individuals: $936 (reported on 39.4% of returns)
This zip code:
$936
Alabama:
$1,592
(% of AGI for various income ranges: 2.6% for AGIs below $25k, 0.7% for AGIs $25k-50k, 0.5% for AGIs $50k-75k, 0.5% for AGIs $75k-100k, 0.7% for AGIs $100k-200k)
Ordinary dividends: $861 (reported on 11.6% of returns)
Here:
$861
State:
$5,697
(% of AGI for various income ranges: 0.6% for AGIs below $25k, 0.2% for AGIs $25k-50k, 0.2% for AGIs $50k-75k, 0.2% for AGIs $75k-100k, 0.1% for AGIs $100k-200k)
Net capital gain/loss in AGI: +$1,350 (reported on 11.6% of returns)
Here:
+$1,350
State:
+$13,286
(% of AGI for various income ranges: 0.6% for AGIs $25k-50k, 0.4% for AGIs $50k-75k, 0.3% for AGIs $75k-100k, 0.6% for AGIs $100k-200k)
Profit/loss from business: +$6,877 (reported on 16.8% of returns)
Here:
+$6,877
State:
+$9,151
(% of AGI for various income ranges: 10.9% for AGIs below $25k, 3.3% for AGIs $25k-50k, 0.5% for AGIs $50k-75k, 1.9% for AGIs $75k-100k, 0.9% for AGIs $100k-200k)
Taxable individual retirement arrangement distribution: $10,927 (reported on 9.7% of returns)
35648:
$10,927
Alabama:
$14,992
(% of AGI for various income ranges: 4.6% for AGIs below $25k, 2.7% for AGIs $25k-50k, 2.9% for AGIs $50k-75k, 3.3% for AGIs $75k-100k)
Total itemized deductions: $17,914 (23% of AGI, reported on 23.9% of returns)
Here:
$17,914
State:
$21,388
Here:
23.0% of AGI
State:
20.1% of AGI
(% of AGI for various income ranges: 6.8% for AGIs below $25k, 8.5% for AGIs $25k-50k, 9.7% for AGIs $50k-75k, 10.4% for AGIs $75k-100k, 10.7% for AGIs $100k-200k)
Charity contributions: $4,091 (reported on 20.6% of returns)
Here:
$4,091
State:
$5,925
(% of AGI for various income ranges: 1.1% for AGIs below $25k, 1.3% for AGIs $25k-50k, 1.7% for AGIs $50k-75k, 1.9% for AGIs $75k-100k, 2.7% for AGIs $100k-200k)
Taxes paid: $3,584 (reported on 23.9% of returns)
35648:
$3,584
State:
$5,272
(% of AGI for various income ranges: 0.5% for AGIs below $25k, 1.1% for AGIs $25k-50k, 1.6% for AGIs $50k-75k, 2.2% for AGIs $75k-100k, 3.2% for AGIs $100k-200k)
Earned income credit: $2,248 (reported on 20.0% of returns)
Here:
$2,248
State:
$2,646
(% of AGI for various income ranges: 6.8% for AGIs below $25k, 1.3% for AGIs $25k-50k)
Percentage of individuals using paid preparers for their 2012 taxes: 80.6%
Here:
81%
State:
60%
(% for various income ranges: 76.2% for AGIs below $25k, 83.3% for AGIs $25k-50k, 81.5% for AGIs $50k-75k, 86.7% for AGIs $75k-100k, 85.7% for AGIs $100k-200k)
Averages for the 2004 tax year for zip code 35648, filed in 2005:
Average Adjusted Gross Income (AGI) in 2004: $34,067 (Individual Income Tax Returns)
Here:
$34,067
State:
$42,302
Salary/wage: $34,929 (reported on 82.2% of returns)
Here:
$34,929
State:
$36,626
(% of AGI for various income ranges: 83.8% for AGIs below $10k, 68.3% for AGIs $10k-25k, 85.4% for AGIs $25k-50k, 87.0% for AGIs $50k-75k, 91.1% for AGIs $75k-100k, 85.5% for AGIs over 100k)
Taxable interest for individuals: $1,029 (reported on 54.7% of returns)
This zip code:
$1,029
Alabama:
$1,827
(% of AGI for various income ranges: 10.3% for AGIs below $10k, 3.5% for AGIs $10k-25k, 1.5% for AGIs $25k-50k, 0.9% for AGIs $50k-75k, 1.0% for AGIs $75k-100k, 0.6% for AGIs over 100k)
Taxable dividends: $639 (reported on 15.5% of returns)
Here:
$639
State:
$4,206
(% of AGI for various income ranges: 0.8% for AGIs below $10k, 1.1% for AGIs $10k-25k, 0.1% for AGIs $25k-50k, 0.2% for AGIs $50k-75k, 0.1% for AGIs $75k-100k, 0.2% for AGIs over 100k)
Net capital gain/loss: +$702 (reported on 12.3% of returns)
Here:
+$702
State:
+$13,031
(% of AGI for various income ranges: -1.0% for AGIs below $10k, 0.0% for AGIs $10k-25k, 0.2% for AGIs $25k-50k, 0.6% for AGIs $50k-75k, 0.3% for AGIs $75k-100k, 0.1% for AGIs over 100k)
Profit/loss from business: +$4,462 (reported on 17.2% of returns)
Here:
+$4,462
State:
+$8,302
(% of AGI for various income ranges: 13.8% for AGIs below $10k, 6.6% for AGIs $10k-25k, 1.2% for AGIs $25k-50k, 0.8% for AGIs $50k-75k, 2.3% for AGIs $75k-100k)
IRA payment deduction: $2,350 (reported on 1.3% of returns)
35648:
$2,350
Alabama:
$3,006
Total itemized deductions: $13,958 (25% of AGI, reported on 24.8% of returns)
Here:
$13,958
State:
$17,623
Here:
24.8% of AGI
State:
20.8% of AGI
(% of AGI for various income ranges: 13.4% for AGIs below $10k, 8.2% for AGIs $10k-25k, 10.1% for AGIs $25k-50k, 10.0% for AGIs $50k-75k, 12.1% for AGIs $75k-100k, 9.5% for AGIs over 100k)
Charity contributions deductions: $3,041 (5% of AGI, reported on 22.0% of returns)
Here:
$3,041
State:
$4,768
Here:
5.2% of AGI
State:
5.4% of AGI
(% of AGI for various income ranges: 1.4% for AGIs below $10k, 1.2% for AGIs $10k-25k, 1.7% for AGIs $25k-50k, 1.9% for AGIs $50k-75k, 2.6% for AGIs $75k-100k, 3.1% for AGIs over 100k)
Total tax: $3,532 (reported on 73.8% of returns)
35648:
$3,532
State:
$6,905
(% of AGI for various income ranges: 4.5% for AGIs below $10k, 3.7% for AGIs $10k-25k, 5.2% for AGIs $25k-50k, 7.8% for AGIs $50k-75k, 10.0% for AGIs $75k-100k, 15.2% for AGIs over 100k)
Earned income credit: $1,689 (reported on 18.6% of returns)
Here:
$1,689
State:
$2,048
Percentage of individuals using paid preparers for their 2004 taxes: 84.4%
Here:
84%
State:
65%
(% for various income ranges: 75.7% for AGIs below $10k, 87.1% for AGIs $10k-25k, 85.5% for AGIs $25k-50k, 86.0% for AGIs $50k-75k, 91.3% for AGIs $75k-100k, 84.3% for AGIs over 100k)
Household received Food Stamps/SNAP in the past 12 months: 152 Household did not receive Food Stamps/SNAP in the past 12 months: 1,075
Women who had a birth in the past 12 months: 14 (14 now married, 1 unmarried) Women who did not have a birth in the past 12 months: 871 (355 now married, 515 unmarried)
Housing units in zip code 35648 with a mortgage: 579 (4 second mortgage, 4 both second mortgage and home equity loan) Houses without a mortgage: 28
Median monthly owner costs for units with a mortgage: $1,109 Median monthly owner costs for units without a mortgage: $401
Residents with income below the poverty level in 2022:
This zip code:
7.5%
Whole state:
16.2%
Residents with income below 50% of the poverty level in 2022:
This zip code:
5.5%
Whole state:
8.6%
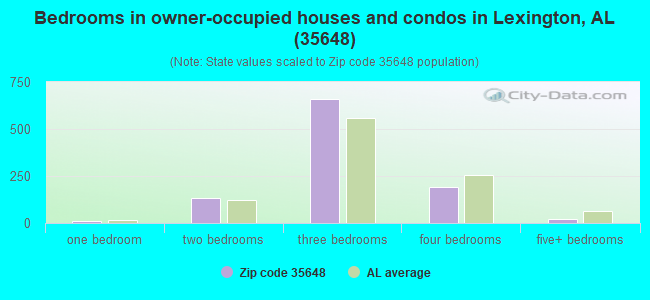
Median number of rooms in houses and condos:
Here:
6.6
State:
6.5
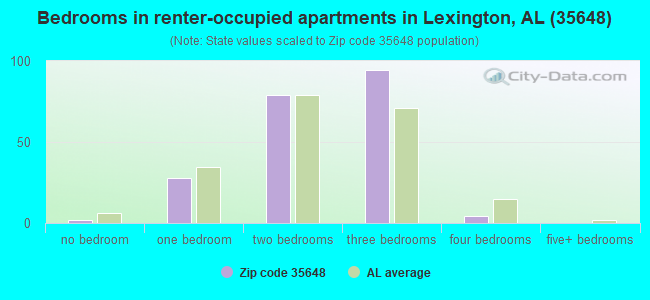
Median number of rooms in apartments:
Here:
5.1
State:
4.7
Notable locations in this zip code not listed on our city pages
Churches in zip code 35648 include: Locks Crossing Church of Christ (A), Nebo Cumberland Presbyterian Church (B), Mount Pleasant Baptist Church (C), Marys Chapel Church of the Nazarene (D), Richardson Chapel (E), Corum Chapel Missionary Baptist Church (F), Center Hill Church (G), Grassy Memorial Chapel Church (H), Richardson Chapel (I). Display/hide their locations on the map
Cemeteries: Corum Cemetery (1), Cox Cemetery (2), Portertown Cemetery (3), Crow Cemetery (4), Moore Cemetery (5), Perry Cemetery (6), Pettus Cemetery (7). Display/hide their locations on the map
Streams, rivers, and creeks: Old Fall Branch (A), Monk Branch (B), Shakerag Branch (C), Middle Fork Anderson Creek (D), Marshall Branch (E), Keaty Branch (F), Hurricane Creek (G), Hurn Spring Branch (H), East Fork Anderson Creek (I). Display/hide their locations on the map
Size of family households: 499 2-persons, 219 3-persons, 149 4-persons, 20 5-persons, 14 6-persons, 24 7-or-more-persons
Size of nonfamily households: 258 1-person, 39 2-persons, 2 3-persons
576 married couples with children.
87 single-parent households (5 men, 82 women).
99.1% of residents of 35648 zip code speak English at home.
0.1% of residents speak Spanish at home (100% very well).
0.4% of residents speak other Indo-European language at home (100% very well).
Foreign born population: 1 (0.0%) (100.0% of them are naturalized citizens)
This zip code:
0.0%
Whole state:
3.8%
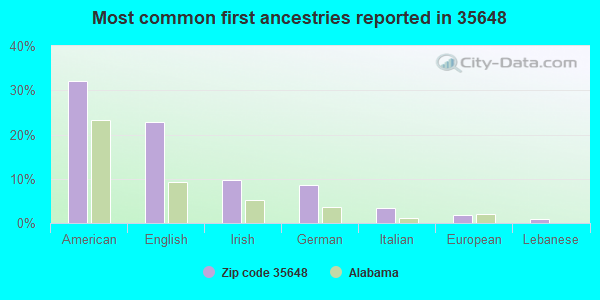
100%Uruguay
32%American
23%English
10%Irish
9%German
3%Italian
2%European
1%Lebanese
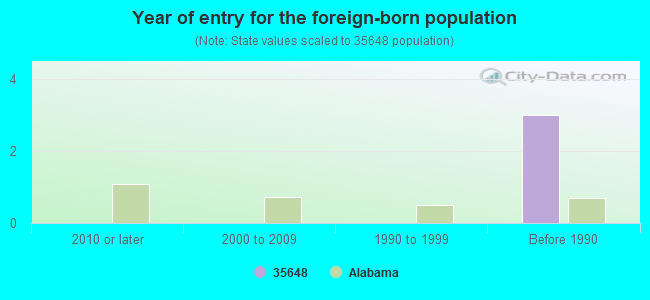
Year of entry for the foreign-born population
02010 or later
02000 to 2009
01990 to 1999
3Before 1990
Facilities with environmental interests located in this zip code:
LEXINGTON SCHOOL (101 SCHOOL ST in LEXINGTON, AL)
(Geographic Names Information System) (National Center for Education Statistics) - STATE ID-0080 Organizations: LAUDERDALE COUNTY (SCHOOL DISTRICT)
LEXINGTON LAGOON AND SPRAYFLD (TOWN OF LEXINGTON in LEXINGTON, AL)
National Pollutant Discharge Elimination System NON-MAJOR (Tracking pollutant discharge elimination systems) - permit Business SIC classification: SEWERAGE SYSTEMS Alternative names: LEXINGTON TOWN LAGOON SPRAY FL, LEXINGTON TOWN OF
C MART (DANLEY OIL CO INC in LEXINGTON, AL)
National Pollutant Discharge Elimination System NON-MAJOR (Tracking pollutant discharge elimination systems) - permit Business SIC classification: GASOLINE SERVICE STATIONS Organizations: DANLEY OIL CO INC (CONTACT/OWNER)
Alternative names: DANLEY OIL CO C MART
RICHARDS AUTO PARTS (CO RD 67 in LEXINGTON, AL)
National Pollutant Discharge Elimination System NON-MAJOR (Tracking pollutant discharge elimination systems) - permit Business SIC classification: MOTOR VEHICLE PARTS, USED
ADOT BR 3916 (ALABAMA DEPARTMENT OF TRANSPOR in LEXINGTON, AL)
National Pollutant Discharge Elimination System NON-MAJOR (Tracking pollutant discharge elimination systems) - permit Business SIC classification: HIGHWAY AND STREET CONSTRUCTION, EXCEPT ELEVATED HIGHWAYS
PAUL JOHNSON PROPERTY (ROUTE 2 BOX 244 in LEXINGTON, AL)
Conditionally Exempt Small Quantity Generators, less than 100 kg/month of hazardous waste (Resource Conservation and Recovery Act (tracking hazardous waste))
Housing units lacking complete plumbing facilities: 7.3% Housing units lacking complete kitchen facilities: 0.3%
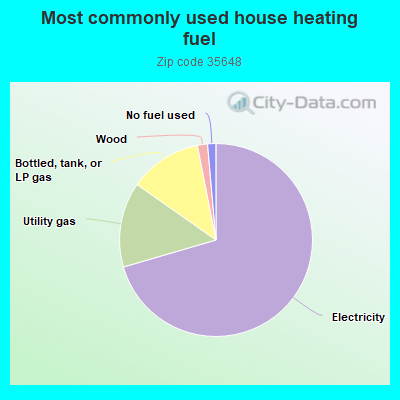
70.7%Electricity
14.3%Utility gas
12.2%Bottled, tank, or LP gas
1.7%Wood
1.4%No fuel used
Population in 1990: 2,241. Population change in the 1990s: +1,676 (+74.8%).
Place of birth for U.S.-born residents:
This state: 2,289
Northeast: 38
Midwest: 252
South: 510
West: 107
67% of the 35648 zip code residents lived in the same house 5 years ago. Out of people who lived in different houses, 67% lived in this county. Out of people who lived in different counties, 50% lived in Alabama.
94% of the 35648 zip code residents lived in the same house 1 year ago. Out of people who lived in different houses, 44% moved from this county. Out of people who lived in different houses, 9% moved from different county within same state. Out of people who lived in different houses, 29% moved from different state. Out of people who lived in different houses, 21% moved from abroad.
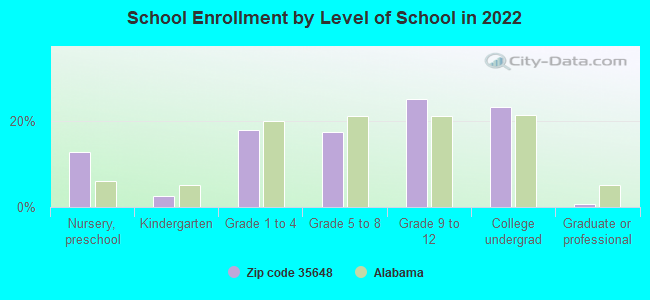
Private vs. public school enrollment:
Students in private schools in grades 1 to 8 (elementary and middle school):
Here:
0.0%
Alabama:
14.7%
Students in private schools in grades 9 to 12 (high school): 23
Here:
12.2%
Alabama:
16.3%
Students in private undergraduate colleges: 2
Here:
1.6%
Alabama:
14.6%
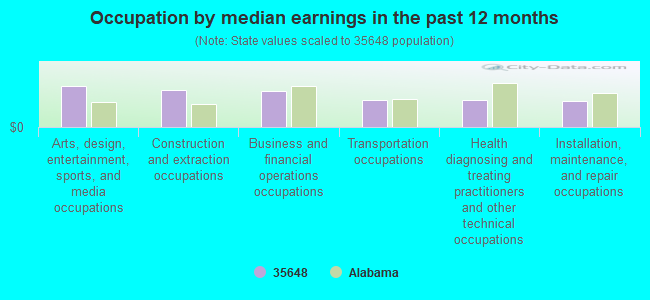
Occupation by median earnings in the past 12 months ($)
96,123Arts, design, entertainment, sports, and media occupations
86,923Construction and extraction occupations
85,185Business and financial operations occupations
63,458Transportation occupations
62,891Health diagnosing and treating practitioners and other technical occupations
60,268Installation, maintenance, and repair occupations
Top industries in this zip code by the number of employees in 2005:
Finance and Insurance: Insurance Agencies and Brokerages (10-19 employees: 1 establishment, 1-4 employees: 2 establishments)
Other Services (except Public Administration): Religious Organizations (5-9: 2, 1-4: 2)
Accommodation and Food Services: Full-Service Restaurants (10-19: 1)
Finance and Insurance: Commercial Banking (5-9: 2)
Construction: Masonry Contractors (5-9: 1)
Health Care and Social Assistance: Offices of Physicians (except Mental Health Specialists) (5-9: 1)
Fatal accident statistics in 2013:
Fatal accident count: 1
Vehicles involved in fatal accidents: 2
Fatal accidents caused by drunken drivers: 0
Fatalities: 1
Persons involved in fatal accidents: 2
Pedestrians involved in fatal accidents: 0
Fatal accident statistics in 2010:
Fatal accident count: 2
Vehicles involved in fatal accidents: 3
Fatal accidents caused by drunken drivers: 1
Fatalities: 2
Persons involved in fatal accidents: 3
Pedestrians involved in fatal accidents: 0
Home Mortgage Disclosure Act Aggregated Statistics For Year 2009 (Based on 3 partial tracts)
A) FHA, FSA/RHS & VA Home Purchase Loans
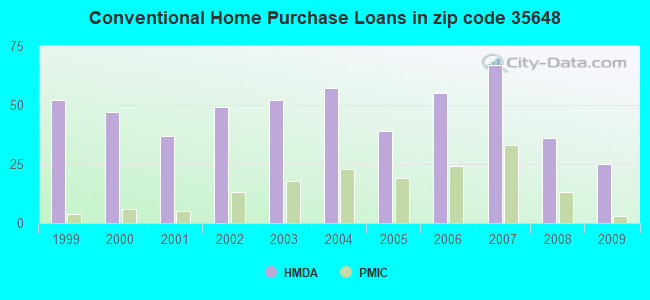
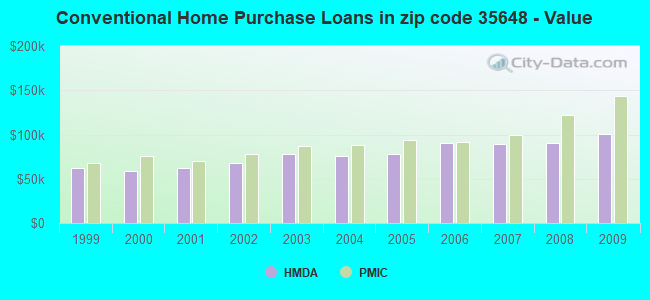
B) Conventional Home Purchase Loans
C) Refinancings
D) Home Improvement Loans
F) Non-occupant Loans on < 5 Family Dwellings (A B C & D)
G) Loans On Manufactured Home Dwelling (A B C & D)
Number
Average Value
Number
Average Value
Number
Average Value
Number
Average Value
Number
Average Value
Number
Average Value
LOANS ORIGINATED
8
$108,472
25
$100,907
91
$134,289
12
$23,860
13
$180,850
7
$24,006
APPLICATIONS APPROVED, NOT ACCEPTED
1
$52,270
4
$44,512
7
$91,727
0
$0
1
$23,470
4
$34,025
APPLICATIONS DENIED
2
$80,390
7
$68,956
32
$118,268
5
$33,938
2
$97,025
8
$38,246
APPLICATIONS WITHDRAWN
2
$201,670
2
$99,695
16
$112,872
0
$0
1
$61,470
0
$0
FILES CLOSED FOR INCOMPLETENESS
1
$44,860
0
$0
8
$164,454
1
$12,640
0
$0
0
$0
Aggregated Statistics For Year 2008 (Based on 3 partial tracts)
A) FHA, FSA/RHS & VA Home Purchase Loans
B) Conventional Home Purchase Loans
C) Refinancings
D) Home Improvement Loans
F) Non-occupant Loans on < 5 Family Dwellings (A B C & D)
G) Loans On Manufactured Home Dwelling (A B C & D)
Number
Average Value
Number
Average Value
Number
Average Value
Number
Average Value
Number
Average Value
Number
Average Value
LOANS ORIGINATED
9
$113,871
36
$90,558
69
$106,338
9
$27,449
18
$85,621
10
$33,158
APPLICATIONS APPROVED, NOT ACCEPTED
0
$0
4
$120,862
9
$120,774
3
$41,383
1
$85,510
3
$39,510
APPLICATIONS DENIED
1
$158,500
6
$63,037
35
$102,111
10
$43,747
1
$46,750
5
$38,982
APPLICATIONS WITHDRAWN
1
$123,380
2
$116,955
15
$108,867
1
$96,360
1
$90,560
0
$0
FILES CLOSED FOR INCOMPLETENESS
0
$0
1
$176,720
3
$161,453
0
$0
0
$0
0
$0
Aggregated Statistics For Year 2007 (Based on 3 partial tracts)
A) FHA, FSA/RHS & VA Home Purchase Loans
B) Conventional Home Purchase Loans
C) Refinancings
D) Home Improvement Loans
F) Non-occupant Loans on < 5 Family Dwellings (A B C & D)
G) Loans On Manufactured Home Dwelling (A B C & D)
Number
Average Value
Number
Average Value
Number
Average Value
Number
Average Value
Number
Average Value
Number
Average Value
LOANS ORIGINATED
3
$83,853
67
$88,766
72
$92,818
19
$23,784
17
$79,496
15
$35,761
APPLICATIONS APPROVED, NOT ACCEPTED
1
$84,570
7
$59,854
6
$100,070
2
$18,915
0
$0
5
$48,806
APPLICATIONS DENIED
0
$0
17
$54,202
35
$90,235
12
$51,406
2
$123,060
12
$42,397
APPLICATIONS WITHDRAWN
0
$0
3
$90,460
12
$120,762
4
$76,475
0
$0
1
$70,100
FILES CLOSED FOR INCOMPLETENESS
0
$0
2
$101,670
2
$131,205
0
$0
0
$0
0
$0
Aggregated Statistics For Year 2006 (Based on 3 partial tracts)
A) FHA, FSA/RHS & VA Home Purchase Loans
B) Conventional Home Purchase Loans
C) Refinancings
D) Home Improvement Loans
F) Non-occupant Loans on < 5 Family Dwellings (A B C & D)
G) Loans On Manufactured Home Dwelling (A B C & D)
Number
Average Value
Number
Average Value
Number
Average Value
Number
Average Value
Number
Average Value
Number
Average Value
LOANS ORIGINATED
4
$57,878
55
$90,135
67
$86,370
14
$27,184
13
$104,677
10
$35,054
APPLICATIONS APPROVED, NOT ACCEPTED
0
$0
5
$76,818
8
$63,132
2
$40,095
1
$41,390
2
$35,330
APPLICATIONS DENIED
1
$17,690
18
$73,538
34
$79,471
8
$36,160
2
$41,860
13
$41,237
APPLICATIONS WITHDRAWN
0
$0
2
$193,045
19
$95,964
2
$93,040
0
$0
0
$0
FILES CLOSED FOR INCOMPLETENESS
0
$0
2
$67,840
11
$97,756
0
$0
0
$0
1
$61,290
Aggregated Statistics For Year 2005 (Based on 3 partial tracts)
A) FHA, FSA/RHS & VA Home Purchase Loans
B) Conventional Home Purchase Loans
C) Refinancings
D) Home Improvement Loans
F) Non-occupant Loans on < 5 Family Dwellings (A B C & D)
G) Loans On Manufactured Home Dwelling (A B C & D)
Number
Average Value
Number
Average Value
Number
Average Value
Number
Average Value
Number
Average Value
Number
Average Value
LOANS ORIGINATED
2
$101,625
39
$78,344
63
$75,338
13
$24,854
13
$63,401
10
$31,512
APPLICATIONS APPROVED, NOT ACCEPTED
0
$0
6
$63,508
10
$84,136
1
$34,750
1
$57,310
2
$59,925
APPLICATIONS DENIED
1
$40,230
13
$56,512
34
$78,899
7
$37,147
1
$101,200
9
$41,216
APPLICATIONS WITHDRAWN
1
$72,140
5
$70,242
18
$104,498
3
$127,277
1
$104,070
2
$58,280
FILES CLOSED FOR INCOMPLETENESS
0
$0
1
$67,480
11
$105,891
1
$40,180
0
$0
1
$48,020
Aggregated Statistics For Year 2004 (Based on 3 partial tracts)
A) FHA, FSA/RHS & VA Home Purchase Loans
B) Conventional Home Purchase Loans
C) Refinancings
D) Home Improvement Loans
F) Non-occupant Loans on < 5 Family Dwellings (A B C & D)
G) Loans On Manufactured Home Dwelling (A B C & D)
Number
Average Value
Number
Average Value
Number
Average Value
Number
Average Value
Number
Average Value
Number
Average Value
LOANS ORIGINATED
1
$69,600
57
$75,288
98
$86,717
18
$26,313
15
$53,924
19
$28,684
APPLICATIONS APPROVED, NOT ACCEPTED
0
$0
7
$60,721
16
$94,847
1
$29,650
0
$0
4
$39,555
APPLICATIONS DENIED
0
$0
11
$64,715
53
$85,728
10
$42,104
1
$90,010
10
$36,712
APPLICATIONS WITHDRAWN
0
$0
2
$72,505
16
$86,859
3
$46,433
1
$40,190
1
$46,760
FILES CLOSED FOR INCOMPLETENESS
0
$0
2
$66,660
15
$98,030
0
$0
0
$0
0
$0
Aggregated Statistics For Year 2003 (Based on 3 partial tracts)
A) FHA, FSA/RHS & VA Home Purchase Loans
B) Conventional Home Purchase Loans
C) Refinancings
D) Home Improvement Loans
F) Non-occupant Loans on < 5 Family Dwellings (A B C & D)
Number
Average Value
Number
Average Value
Number
Average Value
Number
Average Value
Number
Average Value
LOANS ORIGINATED
3
$95,297
52
$78,216
163
$82,130
23
$12,658
17
$63,052
APPLICATIONS APPROVED, NOT ACCEPTED
0
$0
5
$50,186
28
$86,444
1
$4,720
1
$68,770
APPLICATIONS DENIED
1
$68,560
18
$50,167
65
$84,068
6
$12,915
3
$56,410
APPLICATIONS WITHDRAWN
0
$0
3
$75,590
15
$99,168
0
$0
0
$0
FILES CLOSED FOR INCOMPLETENESS
0
$0
2
$95,315
5
$85,196
0
$0
0
$0
Aggregated Statistics For Year 2002 (Based on 2 partial tracts)
A) FHA, FSA/RHS & VA Home Purchase Loans
B) Conventional Home Purchase Loans
C) Refinancings
D) Home Improvement Loans
F) Non-occupant Loans on < 5 Family Dwellings (A B C & D)
Number
Average Value
Number
Average Value
Number
Average Value
Number
Average Value
Number
Average Value
LOANS ORIGINATED
1
$68,770
49
$68,041
109
$77,818
19
$21,445
13
$52,202
APPLICATIONS APPROVED, NOT ACCEPTED
0
$0
6
$35,455
6
$75,545
0
$0
1
$46,760
APPLICATIONS DENIED
1
$53,080
18
$44,115
32
$79,597
3
$5,407
2
$46,340
APPLICATIONS WITHDRAWN
1
$30,330
2
$83,880
15
$81,983
0
$0
0
$0
FILES CLOSED FOR INCOMPLETENESS
0
$0
0
$0
5
$103,164
0
$0
0
$0
Aggregated Statistics For Year 2001 (Based on 2 partial tracts)
B) Conventional Home Purchase Loans
C) Refinancings
D) Home Improvement Loans
F) Non-occupant Loans on < 5 Family Dwellings (A B C & D)
Number
Average Value
Number
Average Value
Number
Average Value
Number
Average Value
LOANS ORIGINATED
37
$61,994
75
$73,985
20
$15,128
8
$49,378
APPLICATIONS APPROVED, NOT ACCEPTED
5
$35,426
9
$72,362
1
$7,160
2
$64,140
APPLICATIONS DENIED
29
$36,559
28
$76,664
4
$9,425
5
$54,596
APPLICATIONS WITHDRAWN
3
$48,650
12
$72,209
1
$53,820
1
$55,190
FILES CLOSED FOR INCOMPLETENESS
0
$0
3
$70,030
0
$0
0
$0
Aggregated Statistics For Year 2000 (Based on 2 partial tracts)
A) FHA, FSA/RHS & VA Home Purchase Loans
B) Conventional Home Purchase Loans
C) Refinancings
D) Home Improvement Loans
F) Non-occupant Loans on < 5 Family Dwellings (A B C & D)
Number
Average Value
Number
Average Value
Number
Average Value
Number
Average Value
Number
Average Value
LOANS ORIGINATED
2
$69,140
47
$59,085
39
$63,409
22
$9,287
10
$33,341
APPLICATIONS APPROVED, NOT ACCEPTED
1
$42,230
9
$40,803
4
$50,998
0
$0
1
$25,280
APPLICATIONS DENIED
0
$0
32
$33,602
14
$57,501
6
$11,040
2
$38,705
APPLICATIONS WITHDRAWN
1
$69,720
3
$61,257
6
$50,497
0
$0
0
$0
FILES CLOSED FOR INCOMPLETENESS
0
$0
1
$70,450
5
$49,832
0
$0
0
$0
Aggregated Statistics For Year 1999 (Based on 2 partial tracts)
A) FHA, FSA/RHS & VA Home Purchase Loans
B) Conventional Home Purchase Loans
C) Refinancings
D) Home Improvement Loans
F) Non-occupant Loans on < 5 Family Dwellings (A B C & D)
2002 - 2017 National Fire Incident Reporting System (NFIRS) incidents
According to the data from the years 2002 - 2017 the average number of fires per year is 12. The highest number of reported fire incidents - 32 took place in 2003, and the least - 0 in 2009. The data has a dropping trend.
When looking into fire subcategories, the most incidents belonged to: Outside Fires (42.2%), and Structure Fires (40.6%).
Fire incident types reported to NFIRS in Zip Code 35648
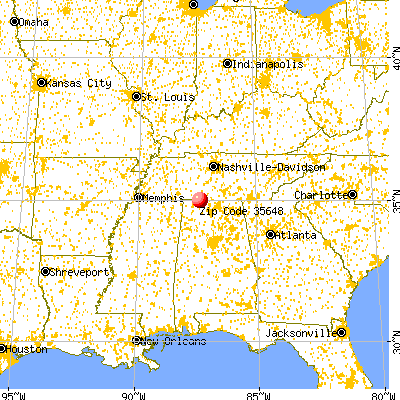


 Nearest zip codes: 38469, 38457, 35645, 38481, 35652, 35610.


 According to the data from the years 2002 - 2017 the average number of fires per year is 12. The highest number of reported fire incidents - 32 took place in 2003, and the least - 0 in 2009. The data has a dropping trend.
 When looking into fire subcategories, the most incidents belonged to: Outside Fires (42.2%), and Structure Fires (40.6%).