Estimated zip code population in 2022: 63,260 Zip code population in 2010: 49,035 Zip code population in 2000: 35,747
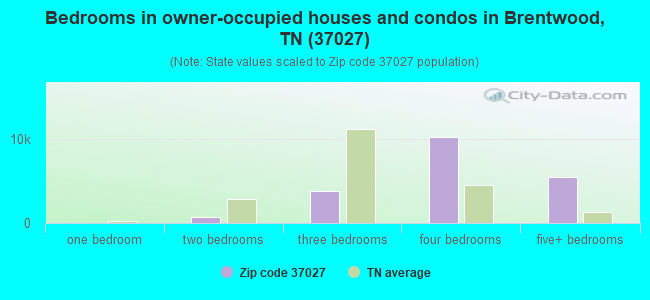
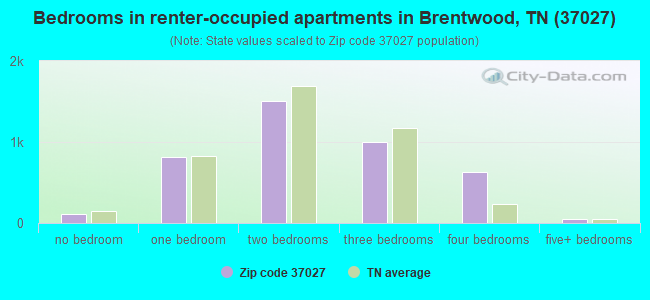
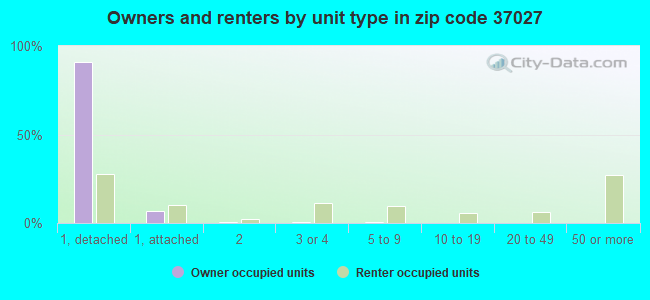
Houses and condos: 24,392 Renter-occupied apartments: 4,091
% of renters here:
17%
State:
33%
March 2022 cost of living index in zip code 37027: 93.6 (less than average, U.S. average is 100)
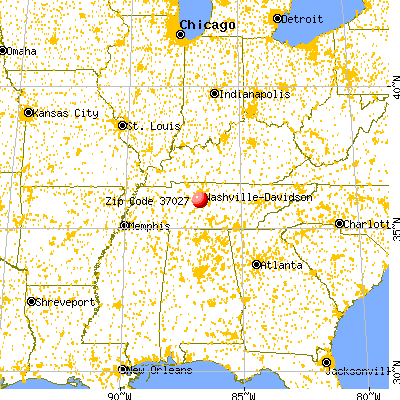
Land area: 55.1 sq. mi. Water area: 0.1 sq. mi.
Population density: 1,149 people per square mile
(low).
OSM Map
General Map
Google Map
MSN Map
OSM Map
General Map
Google Map
MSN Map
OSM Map
General Map
Google Map
MSN Map
OSM Map
General Map
Google Map
MSN Map
Please wait while loading the map...
Real estate property taxes paid for housing units in 2022:
This zip code:
0.4% ($3,858)
Tennessee:
0.5% ($1,376)
Median real estate property taxes paid for housing units with mortgages in 2022: $3,876 (0.4%) Median real estate property taxes paid for housing units with no mortgage in 2022: $3,847 (0.4%)
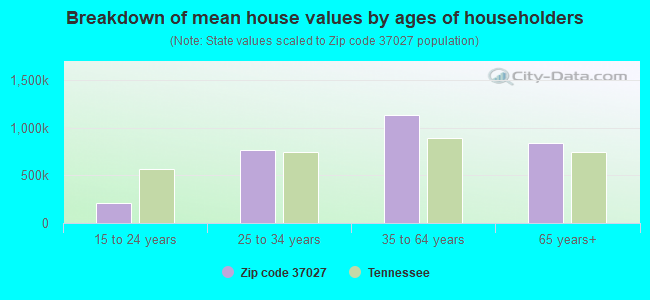
Estimated median house/condo value in 2022: $935,386
37027:
$935,386
Tennessee:
$284,800
According to our research of Tennessee and other state lists, there were 14 registered sex offenders living in 37027 zip code as of April 27, 2024. The ratio of all residents to sex offenders in zip code 37027 is 3,915 to 1. The ratio of registered sex offenders to all residents in this zip code is much lower than the state average.
Median resident age:
This zip code:
43.5 years
Tennessee median age:
39.2 years
Average household size:
This zip code:
2.7 people
Tennessee:
2.4 people
Averages for the 2020 tax year for zip code 37027, filed in 2021:
Average Adjusted Gross Income (AGI) in 2020: $218,395 (Individual Income Tax Returns)
Here:
$218,395
State:
$69,014
Salary/wage: $159,646 (reported on 78.1% of returns)
Here:
$159,646
State:
$55,872
(% of AGI for various income ranges: 1126.6% for AGIs below $25k, 3703.1% for AGIs $25k-50k, 6371.8% for AGIs $50k-75k, 9544.4% for AGIs $75k-100k, 19298.0% for AGIs $100k-200k, 108188.1% for AGIs over 200k)
Taxable interest for individuals: $4,597 (reported on 51.9% of returns)
This zip code:
$4,597
Tennessee:
$1,945
(% of AGI for various income ranges: 28.5% for AGIs below $25k, 60.7% for AGIs $25k-50k, 118.6% for AGIs $50k-75k, 224.2% for AGIs $75k-100k, 296.8% for AGIs $100k-200k, 2136.5% for AGIs over 200k)
Ordinary dividends: $14,167 (reported on 46.8% of returns)
Here:
$14,167
State:
$8,105
(% of AGI for various income ranges: 86.7% for AGIs below $25k, 162.0% for AGIs $25k-50k, 331.8% for AGIs $50k-75k, 631.4% for AGIs $75k-100k, 963.4% for AGIs $100k-200k, 5756.4% for AGIs over 200k)
Net capital gain/loss in AGI: +$63,362 (reported on 45.1% of returns)
Here:
+$63,362
State:
+$33,664
(% of AGI for various income ranges: 79.0% for AGIs below $25k, 143.2% for AGIs $25k-50k, 315.2% for AGIs $50k-75k, 553.6% for AGIs $75k-100k, 1219.7% for AGIs $100k-200k, 31181.4% for AGIs over 200k)
Profit/loss from business: +$57,037 (reported on 25.8% of returns)
Here:
+$57,037
State:
+$18,991
(% of AGI for various income ranges: 162.6% for AGIs below $25k, 434.8% for AGIs $25k-50k, 592.4% for AGIs $50k-75k, 1050.3% for AGIs $75k-100k, 1962.5% for AGIs $100k-200k, 13250.4% for AGIs over 200k)
Taxable individual retirement arrangement distribution: $34,548 (reported on 13.1% of returns)
37027:
$34,548
Tennessee:
$20,036
(% of AGI for various income ranges: 83.5% for AGIs below $25k, 215.0% for AGIs $25k-50k, 391.8% for AGIs $50k-75k, 736.3% for AGIs $75k-100k, 1341.3% for AGIs $100k-200k, 2702.1% for AGIs over 200k)
Self-employed (Keogh) retirement plans: $34,676 (reported on 4.2% of returns)
37027:
$34,676
Tennessee:
$28,955
(% of AGI for various income ranges: 10.3% for AGIs $25k-50k, 13.1% for AGIs $50k-75k, 36.8% for AGIs $75k-100k, 127.1% for AGIs $100k-200k, 1517.0% for AGIs over 200k)
Total itemized deductions: $49,845 (reported on 25.6% of returns)
Here:
$49,845
State:
$40,136
(% of AGI for various income ranges: 126.4% for AGIs below $25k, 336.7% for AGIs $25k-50k, 633.1% for AGIs $50k-75k, 1017.5% for AGIs $75k-100k, 1795.5% for AGIs $100k-200k, 11294.0% for AGIs over 200k)
Charity contributions: $23,848 (reported on 23.0% of returns)
Here:
$23,848
State:
$19,852
(% of AGI for various income ranges: 9.1% for AGIs below $25k, 48.2% for AGIs $25k-50k, 120.0% for AGIs $50k-75k, 254.7% for AGIs $75k-100k, 534.5% for AGIs $100k-200k, 5500.5% for AGIs over 200k)
Taxes paid: $7,495 (reported on 25.4% of returns)
37027:
$7,495
State:
$6,038
(% of AGI for various income ranges: 18.0% for AGIs below $25k, 46.0% for AGIs $25k-50k, 104.5% for AGIs $50k-75k, 169.0% for AGIs $75k-100k, 333.0% for AGIs $100k-200k, 1599.6% for AGIs over 200k)
Earned income credit: $1,682 (reported on 4.2% of returns)
Here:
$1,682
State:
$2,391
(% of AGI for various income ranges: 33.6% for AGIs below $25k, 32.0% for AGIs $25k-50k, 0.6% for AGIs $50k-75k)
Percentage of individuals using paid preparers for their 2020 taxes: 91.9%
Here:
92%
State:
93%
(% for various income ranges: 90.3% for AGIs below $25k, 90.2% for AGIs $25k-50k, 91.7% for AGIs $50k-75k, 90.3% for AGIs $75k-100k, 92.0% for AGIs $100k-200k, 94.4% for AGIs over 200k)
Averages for the 2012 tax year for zip code 37027, filed in 2013:
Average Adjusted Gross Income (AGI) in 2012: $163,485 (Individual Income Tax Returns)
Here:
$163,485
State:
$53,767
Salary/wage: $135,671 (reported on 80.8% of returns)
Here:
$135,671
State:
$45,421
(% of AGI for various income ranges: 71.6% for AGIs below $25k, 69.5% for AGIs $25k-50k, 65.3% for AGIs $50k-75k, 63.9% for AGIs $75k-100k, 73.3% for AGIs $100k-200k, 65.4% for AGIs over 200k)
Taxable interest for individuals: $3,372 (reported on 54.6% of returns)
This zip code:
$3,372
Tennessee:
$1,732
(% of AGI for various income ranges: 2.4% for AGIs below $25k, 1.5% for AGIs $25k-50k, 1.5% for AGIs $50k-75k, 1.4% for AGIs $75k-100k, 0.9% for AGIs $100k-200k, 1.1% for AGIs over 200k)
Ordinary dividends: $10,723 (reported on 44.4% of returns)
Here:
$10,723
State:
$6,739
(% of AGI for various income ranges: 5.6% for AGIs below $25k, 3.1% for AGIs $25k-50k, 3.2% for AGIs $50k-75k, 3.0% for AGIs $75k-100k, 2.2% for AGIs $100k-200k, 3.0% for AGIs over 200k)
Net capital gain/loss in AGI: +$37,756 (reported on 39.8% of returns)
Here:
+$37,756
State:
+$19,082
(% of AGI for various income ranges: 0.9% for AGIs below $25k, 1.4% for AGIs $25k-50k, 1.0% for AGIs $50k-75k, 1.5% for AGIs $75k-100k, 1.6% for AGIs $100k-200k, 12.9% for AGIs over 200k)
Profit/loss from business: +$40,266 (reported on 24.6% of returns)
Here:
+$40,266
State:
+$15,240
(% of AGI for various income ranges: 8.5% for AGIs below $25k, 8.4% for AGIs $25k-50k, 8.1% for AGIs $50k-75k, 8.2% for AGIs $75k-100k, 6.9% for AGIs $100k-200k, 5.4% for AGIs over 200k)
Taxable individual retirement arrangement distribution: $27,378 (reported on 14.0% of returns)
37027:
$27,378
Tennessee:
$15,505
(% of AGI for various income ranges: 4.5% for AGIs below $25k, 4.3% for AGIs $25k-50k, 5.2% for AGIs $50k-75k, 4.6% for AGIs $75k-100k, 3.7% for AGIs $100k-200k, 1.5% for AGIs over 200k)
Self-employment retirement plans: $25,584 (reported on 3.8% of returns)
37027:
$25,584
Tennessee:
$22,567
(% of AGI for various income ranges: 0.3% for AGIs $25k-50k, 0.4% for AGIs $75k-100k, 0.5% for AGIs $100k-200k, 0.7% for AGIs over 200k)
Total itemized deductions: $33,015 (13% of AGI, reported on 55.3% of returns)
Here:
$33,015
State:
$21,976
Here:
12.9% of AGI
State:
17.8% of AGI
(% of AGI for various income ranges: 20.4% for AGIs below $25k, 16.8% for AGIs $25k-50k, 18.3% for AGIs $50k-75k, 17.4% for AGIs $75k-100k, 14.9% for AGIs $100k-200k, 8.8% for AGIs over 200k)
Charity contributions: $9,990 (reported on 50.0% of returns)
Here:
$9,990
State:
$6,709
(% of AGI for various income ranges: 1.7% for AGIs below $25k, 2.2% for AGIs $25k-50k, 2.9% for AGIs $50k-75k, 3.4% for AGIs $75k-100k, 3.2% for AGIs $100k-200k, 3.1% for AGIs over 200k)
Taxes paid: $7,985 (reported on 54.9% of returns)
37027:
$7,985
State:
$4,829
(% of AGI for various income ranges: 3.6% for AGIs below $25k, 3.5% for AGIs $25k-50k, 3.9% for AGIs $50k-75k, 3.8% for AGIs $75k-100k, 3.6% for AGIs $100k-200k, 2.2% for AGIs over 200k)
Earned income credit: $1,592 (reported on 4.8% of returns)
Here:
$1,592
State:
$2,404
(% of AGI for various income ranges: 2.3% for AGIs below $25k, 0.5% for AGIs $25k-50k)
Percentage of individuals using paid preparers for their 2012 taxes: 53.7%
Here:
54%
State:
52%
(% for various income ranges: 45.7% for AGIs below $25k, 46.2% for AGIs $25k-50k, 51.8% for AGIs $50k-75k, 54.3% for AGIs $75k-100k, 53.0% for AGIs $100k-200k, 69.6% for AGIs over 200k)
Averages for the 2004 tax year for zip code 37027, filed in 2005:
Average Adjusted Gross Income (AGI) in 2004: $128,331 (Individual Income Tax Returns)
Here:
$128,331
State:
$44,088
Salary/wage: $105,389 (reported on 80.9% of returns)
Here:
$105,389
State:
$38,825
(% of AGI for various income ranges: 65.6% for AGIs $10k-25k, 71.3% for AGIs $25k-50k, 69.3% for AGIs $50k-75k, 73.6% for AGIs $75k-100k, 64.5% for AGIs over 100k)
Taxable interest for individuals: $3,018 (reported on 64.7% of returns)
This zip code:
$3,018
Tennessee:
$1,802
(% of AGI for various income ranges: 4.3% for AGIs $10k-25k, 2.7% for AGIs $25k-50k, 2.2% for AGIs $50k-75k, 1.6% for AGIs $75k-100k, 1.3% for AGIs over 100k)
Taxable dividends: $4,838 (reported on 50.9% of returns)
Here:
$4,838
State:
$3,727
(% of AGI for various income ranges: 4.0% for AGIs $10k-25k, 2.5% for AGIs $25k-50k, 2.2% for AGIs $50k-75k, 2.0% for AGIs $75k-100k, 1.7% for AGIs over 100k)
Net capital gain/loss: +$37,785 (reported on 45.9% of returns)
Here:
+$37,785
State:
+$15,776
(% of AGI for various income ranges: 2.0% for AGIs $10k-25k, 2.0% for AGIs $25k-50k, 1.3% for AGIs $50k-75k, 1.9% for AGIs $75k-100k, 15.8% for AGIs over 100k)
Profit/loss from business: +$37,659 (reported on 24.7% of returns)
Here:
+$37,659
State:
+$12,882
(% of AGI for various income ranges: 10.3% for AGIs $10k-25k, 9.1% for AGIs $25k-50k, 9.1% for AGIs $50k-75k, 7.9% for AGIs $75k-100k, 6.9% for AGIs over 100k)
IRA payment deduction: $3,759 (reported on 3.6% of returns)
37027:
$3,759
Tennessee:
$2,934
(% of AGI for various income ranges: 0.3% for AGIs $10k-25k, 0.4% for AGIs $25k-50k, 0.3% for AGIs $50k-75k, 0.2% for AGIs $75k-100k, 0.1% for AGIs over 100k)
Self-employed pension: $19,017 (reported on 4.7% of returns)
Here:
$19,017
Tennessee:
$16,857
(% of AGI for various income ranges: 0.1% for AGIs $10k-25k, 0.3% for AGIs $25k-50k, 0.4% for AGIs $50k-75k, 0.6% for AGIs $75k-100k, 0.7% for AGIs over 100k)
Total itemized deductions: $25,967 (15% of AGI, reported on 55.7% of returns)
Here:
$25,967
State:
$18,035
Here:
14.7% of AGI
State:
19.9% of AGI
(% of AGI for various income ranges: 22.6% for AGIs $10k-25k, 20.7% for AGIs $25k-50k, 20.4% for AGIs $50k-75k, 18.5% for AGIs $75k-100k, 9.3% for AGIs over 100k)
Charity contributions deductions: $7,647 (4% of AGI, reported on 51.6% of returns)
Here:
$7,647
State:
$5,167
Here:
4.2% of AGI
State:
5.3% of AGI
(% of AGI for various income ranges: 2.7% for AGIs $10k-25k, 3.3% for AGIs $25k-50k, 3.7% for AGIs $50k-75k, 3.7% for AGIs $75k-100k, 3.0% for AGIs over 100k)
Total tax: $31,441 (reported on 83.1% of returns)
37027:
$31,441
State:
$7,482
(% of AGI for various income ranges: 5.8% for AGIs $10k-25k, 8.4% for AGIs $25k-50k, 9.9% for AGIs $50k-75k, 11.3% for AGIs $75k-100k, 22.4% for AGIs over 100k)
Earned income credit: $1,342 (reported on 3.3% of returns)
Here:
$1,342
State:
$1,826
Percentage of individuals using paid preparers for their 2004 taxes: 55.1%
Here:
55%
State:
60%
(% for various income ranges: 48.8% for AGIs below $10k, 52.6% for AGIs $10k-25k, 52.8% for AGIs $25k-50k, 55.2% for AGIs $50k-75k, 51.7% for AGIs $75k-100k, 61.3% for AGIs over 100k)
Likely homosexual households (counted as self-reported same-sex unmarried-partner households)
Lesbian couples: 0.2% of all households
Gay men: 0.2% of all households
Household received Food Stamps/SNAP in the past 12 months: 119 Household did not receive Food Stamps/SNAP in the past 12 months: 23,841
Women who had a birth in the past 12 months: 408 (369 now married, 44 unmarried) Women who did not have a birth in the past 12 months: 13,789 (7,077 now married, 6,714 unmarried)
Housing units in zip code 37027 with a mortgage: 12,316 (2,821 second mortgage, 119 home equity loan, 2,303 both second mortgage and home equity loan) Houses without a mortgage: 640
Median monthly owner costs for units with a mortgage: $3,099 Median monthly owner costs for units without a mortgage: $818
Residents with income below the poverty level in 2022:
This zip code:
3.0%
Whole state:
13.3%
Residents with income below 50% of the poverty level in 2022:
This zip code:
1.2%
Whole state:
7.1%
Median number of rooms in houses and condos:
Here:
10.0
State:
6.5
Median number of rooms in apartments:
Here:
4.6
State:
4.4
Notable locations in this zip code not listed on our city pages
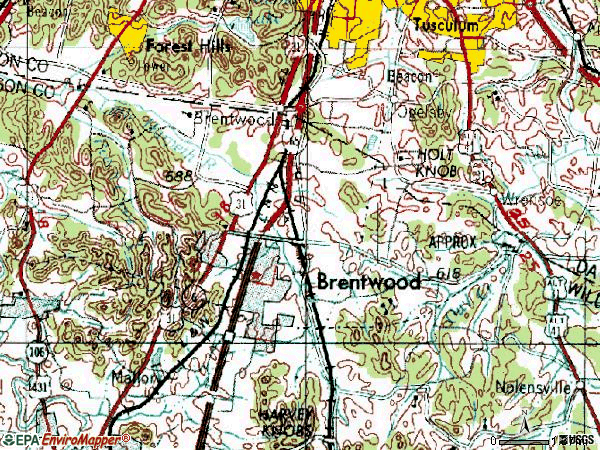
Notable locations in zip code 37027: Oak Hall (A), Crockett Springs National Golf and Country Club (B), Vanderbilt University Observatory (C), Overlook Business Park (D), Brentwood Country Club (E), Brentwood Business Center (F), Edmondson Pike Branch Nashville and Davidson Public Library (G), Brentwood Fire Department (H), Brentwood Fire Department Station 2 (I), Brentwood Fire Department Station 3 (J), Brentwood Fire Department Station 4 (K), Tennessee Baptist Orphans Home (L). Display/hide their locations on the map
Shopping Centers: Liberty Place Mall (1), Maryland Farms Shopping Center (2), Peachtree Village Shopping Center (3), Liberty Place Shopping Center (4), Brentwood Place Shopping Center (5), Brentwood House Shopping Center (6), Brentwood Mall Shopping Center (7), Cool Springs Pointe Shopping Center (8). Display/hide their locations on the map
Churches in zip code 37027 include: Harpeth Hills Church (A), Liberty Church (B), Greater Pleasant View Church (C), Johnson Church (D), Harpeth Church (E), Community Bible Church (F), Mount Lebanon Missionary Baptist Church (G), Holt Chapel (H), Owens Chapel (I). Display/hide their locations on the map
Cemeteries: Brooks Cemetery (1), Butt Cemetery (2), Hamor Cemetery (3), Primm Cemetery (4), Green Hill Cemetery (5), Crockett Cemetery (6), Johnson Chapel Cemetery (7). Display/hide their locations on the map
Streams, rivers, and creeks: Holt Creek (A), Fulton Creek (B), Edmondson Branch (C), Beech Creek (D), East Seward Hills Branch (E), North Sliders Branch (F), West Seward Hills Branch (G), Splitlog Creek (H), Little Harpeth West Branch (I). Display/hide their locations on the map
13,099 married couples with children.
1,235 single-parent households (214 men, 1,021 women).
89.6% of residents of 37027 zip code speak English at home.
1.7% of residents speak Spanish at home (75% very well, 19% well, 5% not well, 1% not at all).
3.3% of residents speak other Indo-European language at home (79% very well, 16% well, 5% not well).
4.7% of residents speak Asian or Pacific Island language at home (79% very well, 17% well, 1% not well, 3% not at all).
0.6% of residents speak other language at home (69% very well, 23% well, 8% not well).
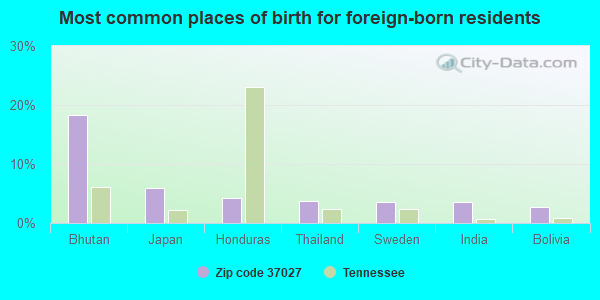
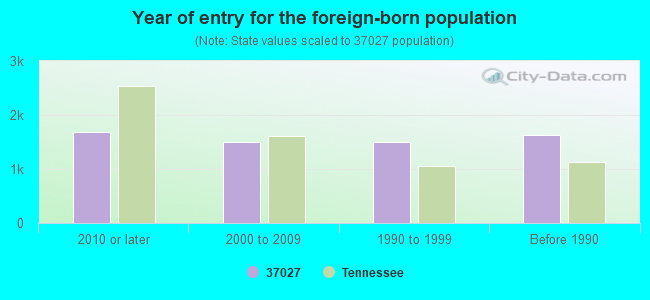
Foreign born population: 6,008 (9.5%) (65.5% of them are naturalized citizens)
Major facilities with environmental interests located in this zip code:
BRENTWOOD HIGH SCHOOL (5304 MURRAY LA in BRENTWOOD, TN)
(Geographic Names Information System) (National Center for Education Statistics) - STATE ID-0012 Organizations: WILLIAMSON COUNTY SCHOOL DIST (SCHOOL DISTRICT)
DRY CLEAN USA (157 FRANKLIN ROAD in BRENTWOOD, TN)
AIR MINOR (AIRS/AFS) (Resource Conservation and Recovery Act (tracking hazardous waste)) Business SIC classification: COIN-OPERATED LAUNDRIES AND DRYCLEANING Alternative names: DRY CLEAN USA #518
BRENTWOOD MIDDLE SCHOOL (5324 MURRAY LA in BRENTWOOD, TN)
(National Center for Education Statistics) - STATE ID-0067 Organizations: WILLIAMSON COUNTY SCHOOL DIST (SCHOOL DISTRICT)
CROCKETT ELEMENTARY SCHOOL (9019 CROCKETT RD in BRENTWOOD, TN)
(National Center for Education Statistics) - STATE ID-0028 Organizations: WILLIAMSON COUNTY SCHOOL DIST (SCHOOL DISTRICT)
CARRIAGE HOUSE CLEANERS (128 FRANKLIN RD in BRENTWOOD, TN)
AIR MINOR (AIRS/AFS) Conditionally Exempt Small Quantity Generators, less than 100 kg/month of hazardous waste (Resource Conservation and Recovery Act (tracking hazardous waste)) - notification Business SIC classification: COIN-OPERATED LAUNDRIES AND DRYCLEANING Organizations: ROBERT DOUVILLE (CONTACT/OPERATOR)
, ROBERT DOUVILLE & DOUG ADAMS (CONTACT/OWNER)
COSTCO WHOLESALE # 386 (98 SEABOARD LANE in BRENTWOOD, TN)
HAZARDOUS WASTE BIENNIAL REPORTER (Resource Conservation and Recovery Act (tracking hazardous waste)) (Resource Conservation and Recovery Act (tracking hazardous waste)) Business NAICS classification: ONE-HOUR PHOTOFINISHING. Organizations: SCOTT WOODS (CONTACT/OPERATOR)
, COSTOCO WHOLESALE CORPORATION (CONTACT/OWNER)
Alternative names: COSTOCO WHOLESALE CORPORATION DBA COSTCO, COSTOCO WHOLESALE CORPORATION DBA COSTCO
COMPREHENSIVE AUTOMOTIVE RESOURCES AUTO (1615 FRANKLIN RD in BRENTWOOD, TN)
(Resource Conservation and Recovery Act (tracking hazardous waste)) Business NAICS classification: GENERAL AUTOMOTIVE REPAIR. Organizations: GARY ENGBERG (CONTACT/OWNER)
A & A CONSTRUCTION, INC. (230 WILSON PIKE CIRCLE in BRENTWOOD, TN)
(Resource Conservation and Recovery Act (tracking hazardous waste))
A1 CLEANERS (493 OLD HICKORY BLVD. in BRENTWOOD, TN)
AIR MINOR (AIRS/AFS) Business SIC classification: DRYCLEANING PLANTS, EXCEPT RUG CLEANING
(Resource Conservation and Recovery Act (tracking hazardous waste)) Business NAICS classification: SURGICAL APPLIANCE AND SUPPLIES MANUFACTURING.
ATLANTIC RICHFIELD CO INC (NEAR ROUTE 3 in BRENTWOOD, TN)
(Resource Conservation and Recovery Act (tracking hazardous waste))
AUDIO VIDEO CORPORATION AMER* (ROUTE 3 in BRENTWOOD, TN)
(Resource Conservation and Recovery Act (tracking hazardous waste)) Business NAICS classification: ALL OTHER PUBLISHERS.
AZCON CORPORATION (PO BOX 535 in BRENTWOOD, TN)
(Resource Conservation and Recovery Act (tracking hazardous waste))
Housing units lacking complete plumbing facilities: 0.1% Housing units lacking complete kitchen facilities: 1.0%
73.3%Utility gas
25.1%Electricity
1.2%Bottled, tank, or LP gas
Population in 1990: 24,280. Population change in the 1990s: +11,467 (+47.2%).
Place of birth for U.S.-born residents:
This state: 24,999
Northeast: 4,773
Midwest: 8,285
South: 14,602
West: 4,699
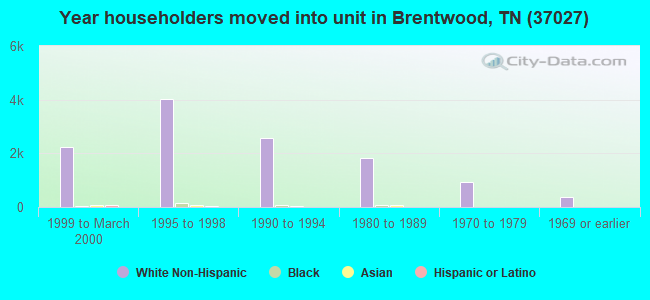
52% of the 37027 zip code residents lived in the same house 5 years ago. Out of people who lived in different houses, 32% lived in this county. Out of people who lived in different counties, 50% lived in Tennessee.
91% of the 37027 zip code residents lived in the same house 1 year ago. Out of people who lived in different houses, 40% moved from this county. Out of people who lived in different houses, 32% moved from different county within same state. Out of people who lived in different houses, 27% moved from different state. Out of people who lived in different houses, 3% moved from abroad.
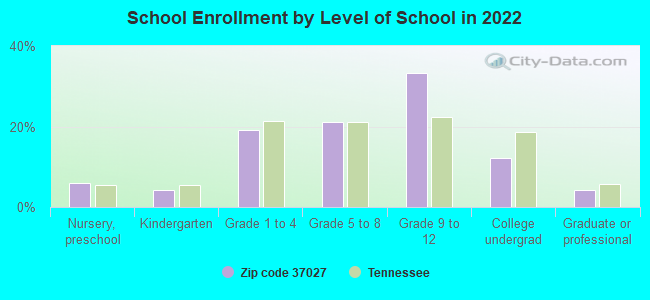
Private vs. public school enrollment:
Students in private schools in grades 1 to 8 (elementary and middle school): 1,837
Here:
26.5%
Tennessee:
15.0%
Students in private schools in grades 9 to 12 (high school): 1,427
Here:
25.0%
Tennessee:
16.2%
Students in private undergraduate colleges: 672
Here:
32.8%
Tennessee:
23.5%
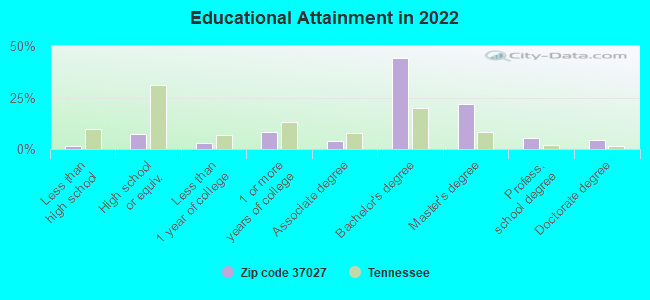
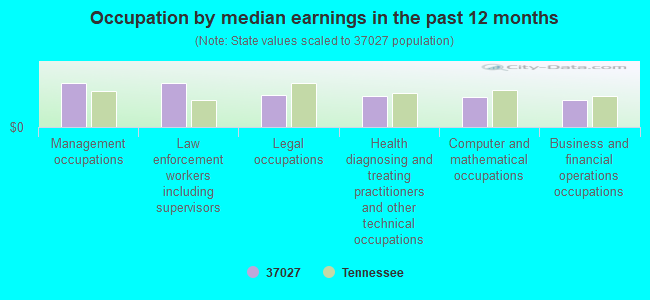
Occupation by median earnings in the past 12 months ($)
154,524Management occupations
154,308Law enforcement workers including supervisors
112,395Legal occupations
110,346Health diagnosing and treating practitioners and other technical occupations
105,851Computer and mathematical occupations
93,229Business and financial operations occupations
Companies with biggest federal contracts located in this zip code (BRENTWOOD, TN):
RAY BELL CONSTRUCTION CO INC (255 WILSON PIKE CIRCLE) : $29,474,471 in 95 contractsfrom 1999 to 2006
Contracts for Construction of Structures and Facilities -- Other Airfield Structures, Construction of Structures and Facilities -- Airport Service Roads, Construction of Structures and Facilities -- Penal Facilities, Maintenance, Repair or Alteration of Real Property -- Other Administrative Facilities and Service Buildings, and moreby Army, Bureau of Prisoners/Federal Prison System Signed by year:2000: $2,370,175; 2001: $1,536,216; 2002: $1,164,688; 2003: $12,419,992; 2004: $11,413,923; 2005: $313,372; 2006: $215,105.
Biggest contracts:
$11,812,000 with Army for Construction of Structures and Facilities -- Other Airfield Structures. Signed on 2003-02-28. Completion date: 2004-09-14.
$11,343,498, same as above.Signed on 2004-02-09. Completion date: 2004-09-14.
$516,500 with Army for Construction of Structures and Facilities -- Airport Service Roads. Signed on 2003-09-23. Completion date: 2004-07-08.
$368,000 with Bureau of Prisoners/Federal Prison System for Construction of Structures and Facilities -- Penal Facilities. Taking place in VA. Signed on 2002-04-15. Completion date: 2002-04-15.
VEXTEC CORPORATION (750 OLD HICKORY BLVD # 270; small business) : $5,871,746 in 34 contractsfrom 2000 to 2006
Contracts for Defense Electronics and Communication Equipment -- Applied Research and Exploratory Development (R&D), Defense Aircraft -- Applied Research and Exploratory Development (R&D), Defense Aircraft -- Advanced Development (R&D), Other Defense -- Operational Systems Development (R&D), and moreby Navy, Air Force, Army, NASA, and others Signed by year:2000: $98,065; 2001: $544,000; 2002: $1,010,717; 2003: $1,081,165; 2004: $1,491,982; 2005: $1,050,857; 2006: $594,960.
Biggest contracts:
$500,000 with Navy for Defense Electronics and Communication Equipment -- Applied Research and Exploratory Development (R&D). Signed on 2005-02-10. Completion date: 2006-08-15.
$375,000 with Air Force for Defense Aircraft -- Applied Research and Exploratory Development (R&D). Signed on 2006-04-06. Completion date: 2008-08-31.
$375,000 with Navy for Defense Electronics and Communication Equipment -- Applied Research and Exploratory Development (R&D). Signed on 2004-04-30. Completion date: 2006-04-29.
$375,000 with Air Force for Defense Aircraft -- Advanced Development (R&D). Signed on 2004-04-08. Completion date: 2006-08-01.
METADATA COMPANY LLC (5409 MARYLAND WAY; small business) : $1,949,864 in 3 contractsfrom 2005 to 2006
$999,999 with Navy for Data Collection Services. Taking place in SC. Signed on 2006-06-26. Completion date: 2007-01-26.
$849,915 with Navy for ADP Input/Output and Storage Devices. Taking place in CA. Signed on 2005-07-27. Completion date: 2006-02-17.
$99,950 with Navy for Programming Services. Taking place in CA. Signed on 2005-04-14. Completion date: 2005-06-17.
WIMBERLY SALES CORPORATION (7105 PEACH CT.; small business)
$1,115,000 with Air Force for Modification of Equipment -- Refrigeration, Air Conditioning, and Air Circulating Equipment. Signed on 2000-01-21. Completion date: 2000-05-15.
BRENTWOOD TECHNOLOGIES (BRENTE (5123 VIRGINIA WAY, SUITE C; small business) : $743,461 in 2 contractsfrom 2000 to 2001
$375,000 with Air Force for Defense Aircraft -- Applied Research and Exploratory Development (R&D). Signed on 2000-07-12. Completion date: 2003-03-29.
$368,461, same as above.Signed on 2001-02-23. Completion date: 2003-03-29.
SANSOFT, INC (1616 WESTGATE CIRCLE) : $582,644 in 10 contractsfrom 1999 to 2005
Contracts for ADP Software, ADP System Acquisition Support Services. Includes preparation of statement of work, benchmarks, specifications, etc., Systems Engineering Services, Maintenance, Repair and Rebuilding of Equipment -- Automatic Data Processing Equipment (Including Firmware), Software, Supplies and Support Equipment by Air Force, Offices, Boards and Divisions (includes Attorney General, Deputy Attorney General, etc.) Signed by year:2000: $75,653; 2001: $117,654; 2002: $79,425; 2003: $79,425; 2004: $39,713; 2005: $79,425; 2006: $0.
Biggest contracts:
$79,425 with Air Force for ADP Software. Taking place in AL. Signed on 2002-11-26. Completion date: 2003-09-30.
$79,425 with Air Force for ADP Software. Signed on 2005-03-07. Completion date: 2005-04-01.
$79,425, same as above.Signed on 2003-11-04. Completion date: 2004-10-06.
$75,654 with Air Force for ADP System Acquisition Support Services. Includes preparation of statement of work, benchmarks, specifications, etc.. Signed on 2001-11-27. Completion date: 2002-09-30.
SAFETY & SECURITY INTERNATIONA (1664 MALLORY LN; small business) : $534,907 in 38 contractsfrom 2004 to 2006
Contracts for Miscellaneous Weapons, ADP Support Equipment, Safety and Rescue Equipment, Individual Equipment, and moreby Air Force, Department of State, Department of Defense, Navy, and others Signed by year:2000: $0; 2001: $0; 2002: $0; 2003: $0; 2004: $197,268; 2005: $296,974; 2006: $40,665.
Biggest contracts:
$95,575 with Air Force for Miscellaneous Weapons. Signed on 2004-09-20. Completion date: 2004-12-27.
$52,615 with Department of State for ADP Support Equipment. Signed on 2004-02-04. Completion date: 2004-03-30.
$50,736 with Department of Defense for Miscellaneous Weapons. Signed on 2005-02-23. Completion date: 2005-04-17.
$44,169 with Navy for Safety and Rescue Equipment. Signed on 2005-09-09. Completion date: 2005-10-11.
ENVIRONMENTAL RESOURCES MANAGE (7106 CROSSROADS BLVD ,SUIT) : $433,694 in 16 contractsfrom 2000 to 2002
Contracts for Other Non-Building Structures, Other Buildings, Other Environmental Services, Studies, and Analytical Support, Other Architect and Engineering Services by Army, U.S. Army Corps of Engineers - civil program financing only Signed by year:2000: $142,583; 2001: $130,516; 2002: $160,595; 2003: $0; 2004: $0; 2005: $0; 2006: $0.
Biggest contracts:
$81,839 with Army for Other Non-Building Structures. Signed on 2002-09-28. Completion date: 2003-05-12.
$75,100 with Army for Other Buildings. Signed on 2001-09-26. Completion date: 2001-04-13.
$44,040 with Army for Other Environmental Services, Studies, and Analytical Support. Signed on 2002-09-25. Completion date: 2003-03-14.
$36,155 with U.S. Army Corps of Engineers - civil program financing only for Other Architect and Engineering Services. Signed on 2000-03-16. Completion date: 1999-12-31.
SOUTHERN SPECIALTY BRANDS (100 WINNERS CIR N STE 158; small business) : $417,269 in 12 contractsfrom 2004 to 2005
Contracts for Food Items For Resale, Non-Food Items For Resale by Defense Commissary Agency Signed by year:2000: $0; 2001: $0; 2002: $0; 2003: $0; 2004: $118,100; 2005: $299,169; 2006: $0.
Biggest contracts:
$94,725 with Defense Commissary Agency for Food Items For Resale. Signed on 2005-04-01. Completion date: 2005-08-31.
$71,845 with Defense Commissary Agency for Non-Food Items For Resale. Signed on 2005-10-01. Completion date: 2005-12-31.
$63,212 with Defense Commissary Agency for Food Items For Resale. Signed on 2004-10-01. Completion date: 2005-02-28.
$51,721, same as above.Signed on 2005-01-01. Completion date: 2005-03-31.
BHATE ENVIRONMENTAL ASSOCIATES (5115 MARYLAND WAY; small business) : $314,855 in 7 contractsfrom 2000 to 2001
Contracts for Other Architect and Engineering Services by U.S. Army Corps of Engineers - civil program financing only Signed by year:2000: $228,570; 2001: $86,285; 2002: $0; 2003: $0; 2004: $0; 2005: $0; 2006: $0.
Biggest contracts:
$67,000 with U.S. Army Corps of Engineers - civil program financing only for Other Architect and Engineering Services. Signed on 2000-08-24. Completion date: 2000-05-23.
$65,300, same as above.Signed on 2000-08-24. Completion date: 2000-05-23.
$48,500 with U.S. Army Corps of Engineers - civil program financing only for Other Architect and Engineering Services. Taking place in AL. Signed on 2001-06-21. Completion date: 2001-10-31.
$48,270 with U.S. Army Corps of Engineers - civil program financing only for Other Architect and Engineering Services. Signed on 2000-01-27. Completion date: 1999-12-31.
Top industries in this zip code by the number of employees in 2005:
Administrative and Support and Waste Management and Remediation Services: Professional Employer Organizations (over 1000 employees: 1 establishment, 500-999 employees: 1 establishment, 250-499 employees: 2 establishments, 20-49 employees: 1 establishment, 5-9 employees: 1 establishment)
Management of Companies and Enterprises: Corporate, Subsidiary, and Regional Managing Offices (250-499: 3, 100-249: 7, 50-99: 4, 20-49: 9, 10-19: 5, 5-9: 4, 1-4: 8)
Health Care and Social Assistance: Offices of Physicians (except Mental Health Specialists) (500-999: 1, 100-249: 1, 50-99: 2, 20-49: 14, 10-19: 22, 5-9: 38, 1-4: 49)
Finance and Insurance: Financial Transactions Processing, Reserve, and Clearinghouse Activities (over 1000: 1, 50-99: 1, 10-19: 1, 1-4: 3)
Administrative and Support and Waste Management and Remediation Services: Office Administrative Services (250-499: 1, 100-249: 5, 50-99: 3, 20-49: 3, 10-19: 2, 5-9: 5, 1-4: 13)
Professional, Scientific, and Technical Services: Administrative Management and General Management Consulting Services (250-499: 2, 50-99: 1, 20-49: 2, 10-19: 4, 5-9: 10, 1-4: 31)
Administrative and Support and Waste Management and Remediation Services: Temporary Help Services (100-249: 2, 50-99: 6, 20-49: 5, 10-19: 3, 5-9: 1, 1-4: 13)
Administrative and Support and Waste Management and Remediation Services: Janitorial Services (500-999: 1, 20-49: 2, 10-19: 2, 5-9: 3, 1-4: 7)
People in group quarters in 2010:
275 people in nursing facilities/skilled-nursing facilities
37 people in group homes for juveniles (non-correctional)
22 people in workers' group living quarters and job corps centers
15 people in emergency and transitional shelters (with sleeping facilities) for people experiencing homelessness
People in group quarters in 2000:
120 people in other group homes
86 people in other noninstitutional group quarters
72 people in homes for abused, dependent, and neglected children
9 people in other nonhousehold living situations
Fatal accident statistics in 2013:
Fatal accident count: 1
Vehicles involved in fatal accidents: 1
Fatal accidents caused by drunken drivers: 0
Fatalities: 2
Persons involved in fatal accidents: 2
Pedestrians involved in fatal accidents: 2
Fatal accident statistics in 2012:
Fatal accident count: 4
Vehicles involved in fatal accidents: 7
Fatal accidents caused by drunken drivers: 2
Fatalities: 4
Persons involved in fatal accidents: 7
Pedestrians involved in fatal accidents: 1
Home Mortgage Disclosure Act Aggregated Statistics For Year 2009 (Based on 5 full and 8 partial tracts)
A) FHA, FSA/RHS & VA Home Purchase Loans
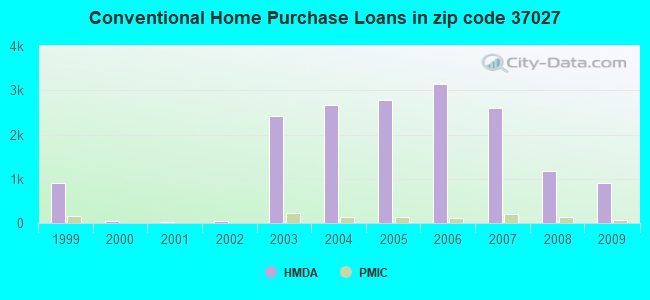
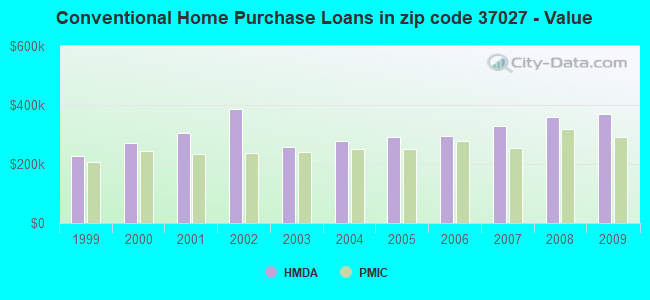
B) Conventional Home Purchase Loans
C) Refinancings
D) Home Improvement Loans
F) Non-occupant Loans on < 5 Family Dwellings (A B C & D)
G) Loans On Manufactured Home Dwelling (A B C & D)
Number
Average Value
Number
Average Value
Number
Average Value
Number
Average Value
Number
Average Value
Number
Average Value
LOANS ORIGINATED
205
$277,758
898
$369,877
3,947
$304,082
59
$200,253
115
$329,298
1
$360,840
APPLICATIONS APPROVED, NOT ACCEPTED
4
$223,252
76
$372,950
267
$304,406
10
$150,011
8
$128,092
0
$0
APPLICATIONS DENIED
22
$282,297
79
$486,353
699
$365,757
37
$78,754
22
$194,410
0
$0
APPLICATIONS WITHDRAWN
24
$348,362
196
$410,327
639
$318,182
20
$255,458
15
$296,397
0
$0
FILES CLOSED FOR INCOMPLETENESS
3
$171,273
22
$463,640
140
$333,339
11
$124,369
2
$154,750
0
$0
Aggregated Statistics For Year 2008 (Based on 5 full and 8 partial tracts)
A) FHA, FSA/RHS & VA Home Purchase Loans
B) Conventional Home Purchase Loans
C) Refinancings
D) Home Improvement Loans
F) Non-occupant Loans on < 5 Family Dwellings (A B C & D)
G) Loans On Manufactured Home Dwelling (A B C & D)
Number
Average Value
Number
Average Value
Number
Average Value
Number
Average Value
Number
Average Value
Number
Average Value
LOANS ORIGINATED
92
$272,142
1,173
$360,855
1,752
$313,579
124
$139,005
162
$315,991
1
$766,950
APPLICATIONS APPROVED, NOT ACCEPTED
3
$351,747
130
$346,614
171
$304,596
25
$143,580
30
$276,455
1
$171,000
APPLICATIONS DENIED
9
$223,068
123
$336,185
453
$412,511
55
$101,099
22
$492,547
3
$82,767
APPLICATIONS WITHDRAWN
22
$262,545
204
$321,975
356
$320,118
15
$224,233
26
$222,517
0
$0
FILES CLOSED FOR INCOMPLETENESS
3
$422,197
24
$416,787
91
$372,995
6
$183,445
3
$288,630
0
$0
Aggregated Statistics For Year 2007 (Based on 5 full and 8 partial tracts)
A) FHA, FSA/RHS & VA Home Purchase Loans
B) Conventional Home Purchase Loans
C) Refinancings
D) Home Improvement Loans
E) Loans on Dwellings For 5+ Families
F) Non-occupant Loans on < 5 Family Dwellings (A B C & D)
G) Loans On Manufactured Home Dwelling (A B C & D)
Number
Average Value
Number
Average Value
Number
Average Value
Number
Average Value
Number
Average Value
Number
Average Value
Number
Average Value
LOANS ORIGINATED
23
$206,279
2,609
$327,991
1,415
$303,457
142
$108,371
0
$0
248
$259,017
0
$0
APPLICATIONS APPROVED, NOT ACCEPTED
2
$364,415
313
$336,032
239
$307,773
31
$113,744
0
$0
36
$237,106
0
$0
APPLICATIONS DENIED
9
$113,869
256
$334,023
485
$359,153
84
$114,899
0
$0
20
$366,150
2
$245,535
APPLICATIONS WITHDRAWN
13
$187,372
367
$295,204
290
$358,676
25
$181,562
2
$8,773,200
33
$193,144
0
$0
FILES CLOSED FOR INCOMPLETENESS
0
$0
51
$443,241
123
$334,450
10
$191,446
0
$0
0
$0
0
$0
Aggregated Statistics For Year 2006 (Based on 5 full and 8 partial tracts)
A) FHA, FSA/RHS & VA Home Purchase Loans
B) Conventional Home Purchase Loans
C) Refinancings
D) Home Improvement Loans
F) Non-occupant Loans on < 5 Family Dwellings (A B C & D)
G) Loans On Manufactured Home Dwelling (A B C & D)
Number
Average Value
Number
Average Value
Number
Average Value
Number
Average Value
Number
Average Value
Number
Average Value
LOANS ORIGINATED
31
$208,758
3,145
$294,641
1,363
$310,437
145
$152,372
295
$222,689
1
$47,980
APPLICATIONS APPROVED, NOT ACCEPTED
0
$0
378
$278,030
246
$272,718
47
$115,478
41
$265,993
0
$0
APPLICATIONS DENIED
0
$0
263
$354,131
383
$335,092
70
$95,286
34
$346,419
2
$277,115
APPLICATIONS WITHDRAWN
2
$190,670
448
$273,102
420
$329,202
25
$130,569
46
$250,321
0
$0
FILES CLOSED FOR INCOMPLETENESS
0
$0
57
$336,451
111
$314,163
1
$477,460
10
$195,052
0
$0
Aggregated Statistics For Year 2005 (Based on 5 full and 8 partial tracts)
A) FHA, FSA/RHS & VA Home Purchase Loans
B) Conventional Home Purchase Loans
C) Refinancings
D) Home Improvement Loans
F) Non-occupant Loans on < 5 Family Dwellings (A B C & D)
G) Loans On Manufactured Home Dwelling (A B C & D)
Number
Average Value
Number
Average Value
Number
Average Value
Number
Average Value
Number
Average Value
Number
Average Value
LOANS ORIGINATED
23
$215,793
2,773
$292,358
1,711
$280,536
125
$131,287
238
$203,221
0
$0
APPLICATIONS APPROVED, NOT ACCEPTED
2
$97,845
265
$293,566
243
$230,334
22
$92,158
21
$242,721
7
$66,853
APPLICATIONS DENIED
2
$223,230
231
$284,255
520
$301,071
71
$88,771
35
$200,998
3
$44,510
APPLICATIONS WITHDRAWN
5
$147,794
318
$310,794
576
$278,895
48
$221,107
30
$220,046
0
$0
FILES CLOSED FOR INCOMPLETENESS
0
$0
71
$343,132
107
$274,509
9
$145,938
5
$433,560
0
$0
Aggregated Statistics For Year 2004 (Based on 5 full and 8 partial tracts)
A) FHA, FSA/RHS & VA Home Purchase Loans
B) Conventional Home Purchase Loans
C) Refinancings
D) Home Improvement Loans
E) Loans on Dwellings For 5+ Families
F) Non-occupant Loans on < 5 Family Dwellings (A B C & D)
G) Loans On Manufactured Home Dwelling (A B C & D)
Number
Average Value
Number
Average Value
Number
Average Value
Number
Average Value
Number
Average Value
Number
Average Value
Number
Average Value
LOANS ORIGINATED
52
$158,293
2,658
$276,866
1,896
$254,981
77
$113,784
0
$0
143
$189,169
3
$14,010
APPLICATIONS APPROVED, NOT ACCEPTED
2
$145,765
257
$301,292
248
$254,990
27
$94,015
2
$68,095
16
$262,882
2
$26,320
APPLICATIONS DENIED
7
$142,799
254
$273,799
557
$301,637
54
$130,336
0
$0
28
$183,617
2
$102,145
APPLICATIONS WITHDRAWN
13
$179,715
351
$260,378
510
$273,661
12
$42,980
0
$0
20
$137,039
0
$0
FILES CLOSED FOR INCOMPLETENESS
2
$212,935
53
$239,082
84
$296,357
4
$54,818
0
$0
1
$177,360
0
$0
Aggregated Statistics For Year 2003 (Based on 5 full and 8 partial tracts)
A) FHA, FSA/RHS & VA Home Purchase Loans
B) Conventional Home Purchase Loans
C) Refinancings
D) Home Improvement Loans
E) Loans on Dwellings For 5+ Families
F) Non-occupant Loans on < 5 Family Dwellings (A B C & D)
Number
Average Value
Number
Average Value
Number
Average Value
Number
Average Value
Number
Average Value
Number
Average Value
LOANS ORIGINATED
67
$161,650
2,422
$259,160
5,832
$224,457
67
$62,893
3
$236,407
182
$170,009
APPLICATIONS APPROVED, NOT ACCEPTED
6
$213,537
164
$289,495
478
$232,227
20
$24,728
0
$0
9
$182,901
APPLICATIONS DENIED
17
$149,353
158
$235,280
569
$271,658
27
$43,969
0
$0
33
$199,838
APPLICATIONS WITHDRAWN
8
$136,542
294
$297,251
601
$247,803
17
$144,989
0
$0
26
$168,947
FILES CLOSED FOR INCOMPLETENESS
3
$162,987
67
$241,890
146
$272,902
4
$32,447
0
$0
9
$255,054
Aggregated Statistics For Year 2002 (Based on 2 partial tracts)
A) FHA, FSA/RHS & VA Home Purchase Loans
B) Conventional Home Purchase Loans
C) Refinancings
D) Home Improvement Loans
F) Non-occupant Loans on < 5 Family Dwellings (A B C & D)
Number
Average Value
Number
Average Value
Number
Average Value
Number
Average Value
Number
Average Value
LOANS ORIGINATED
1
$105,000
42
$387,741
110
$289,325
2
$102,920
3
$304,113
APPLICATIONS APPROVED, NOT ACCEPTED
0
$0
3
$307,277
10
$238,051
0
$0
1
$106,780
APPLICATIONS DENIED
0
$0
2
$152,750
9
$307,871
0
$0
2
$166,095
APPLICATIONS WITHDRAWN
0
$0
5
$350,344
8
$313,506
0
$0
1
$137,620
FILES CLOSED FOR INCOMPLETENESS
0
$0
2
$419,390
2
$433,630
0
$0
0
$0
Aggregated Statistics For Year 2001 (Based on 2 partial tracts)
B) Conventional Home Purchase Loans
C) Refinancings
D) Home Improvement Loans
F) Non-occupant Loans on < 5 Family Dwellings (A B C & D)
Number
Average Value
Number
Average Value
Number
Average Value
Number
Average Value
LOANS ORIGINATED
23
$304,647
77
$297,324
2
$192,790
2
$201,985
APPLICATIONS APPROVED, NOT ACCEPTED
2
$278,505
2
$505,705
0
$0
0
$0
APPLICATIONS DENIED
2
$366,895
13
$216,062
2
$56,055
1
$157,790
APPLICATIONS WITHDRAWN
3
$167,083
5
$121,724
0
$0
1
$40,340
FILES CLOSED FOR INCOMPLETENESS
0
$0
2
$236,390
0
$0
0
$0
Aggregated Statistics For Year 2000 (Based on 2 partial tracts)
A) FHA, FSA/RHS & VA Home Purchase Loans
B) Conventional Home Purchase Loans
C) Refinancings
D) Home Improvement Loans
F) Non-occupant Loans on < 5 Family Dwellings (A B C & D)
Number
Average Value
Number
Average Value
Number
Average Value
Number
Average Value
Number
Average Value
LOANS ORIGINATED
0
$0
44
$270,405
21
$250,924
7
$69,913
2
$141,180
APPLICATIONS APPROVED, NOT ACCEPTED
0
$0
5
$260,534
4
$248,848
2
$65,250
0
$0
APPLICATIONS DENIED
1
$89,570
7
$280,160
9
$342,474
1
$8,900
0
$0
APPLICATIONS WITHDRAWN
0
$0
7
$280,499
8
$350,359
1
$17,200
0
$0
FILES CLOSED FOR INCOMPLETENESS
0
$0
1
$426,510
2
$261,600
0
$0
0
$0
Aggregated Statistics For Year 1999 (Based on 5 partial tracts)
A) FHA, FSA/RHS & VA Home Purchase Loans
B) Conventional Home Purchase Loans
C) Refinancings
D) Home Improvement Loans
F) Non-occupant Loans on < 5 Family Dwellings (A B C & D)
2002 - 2018 National Fire Incident Reporting System (NFIRS) incidents
Based on the data from the years 2002 - 2018 the average number of fire incidents per year is 87. The highest number of reported fires - 101 took place in 2007, and the least - 67 in 2008. The data has a growing trend.
When looking into fire subcategories, the most reports belonged to: Outside Fires (43.2%), and Structure Fires (31.3%).
Fire incident types reported to NFIRS in Zip Code 37027


 Nearest zip codes: 37220, 37067, 37211, 37215, 37204, 37069.


 Based on the data from the years 2002 - 2018 the average number of fire incidents per year is 87. The highest number of reported fires - 101 took place in 2007, and the least - 67 in 2008. The data has a growing trend.
 When looking into fire subcategories, the most reports belonged to: Outside Fires (43.2%), and Structure Fires (31.3%).