Estimated zip code population in 2022: 75,759 Zip code population in 2010: 74,755 Zip code population in 2000: 64,753
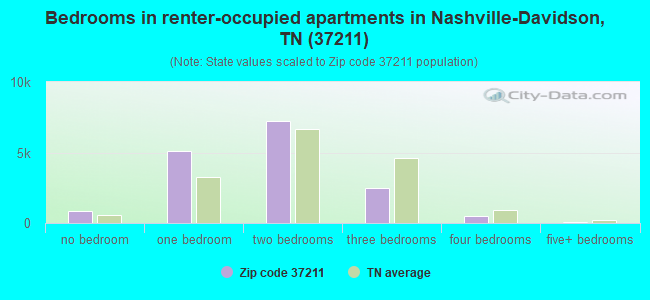
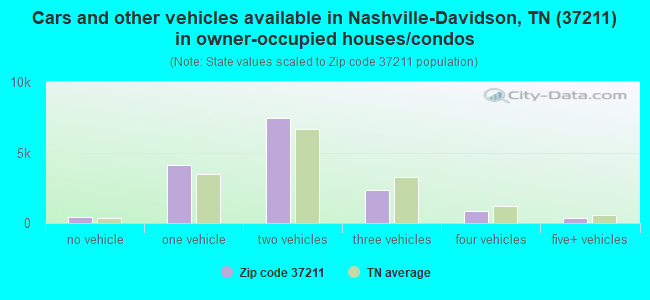
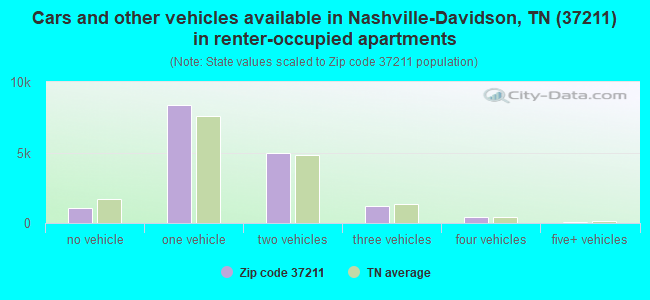
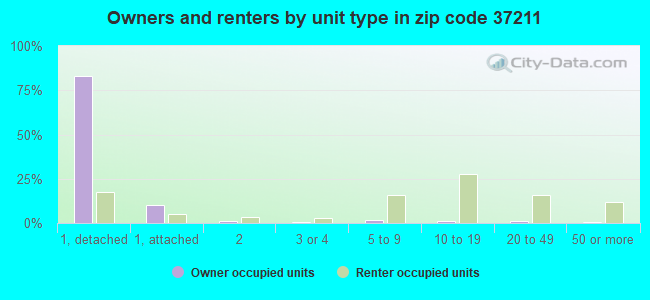
Houses and condos: 34,241 Renter-occupied apartments: 16,042
% of renters here:
51%
State:
33%
March 2022 cost of living index in zip code 37211: 91.2 (less than average, U.S. average is 100)
Land area: 21.4 sq. mi. Water area: 0.0 sq. mi.
Population density: 3,545 people per square mile
(average).
OSM Map
General Map
Google Map
MSN Map
OSM Map
General Map
Google Map
MSN Map
OSM Map
General Map
Google Map
MSN Map
OSM Map
General Map
Google Map
MSN Map
Please wait while loading the map...
Real estate property taxes paid for housing units in 2022:
This zip code:
0.5% ($2,089)
Tennessee:
0.5% ($1,376)
Median real estate property taxes paid for housing units with mortgages in 2022: $2,077 (0.5%) Median real estate property taxes paid for housing units with no mortgage in 2022: $2,132 (0.6%)
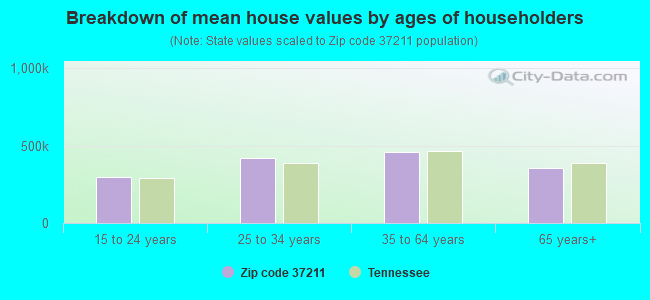
Estimated median house/condo value in 2022: $413,518
37211:
$413,518
Tennessee:
$284,800
According to our research of Tennessee and other state lists, there were 95 registered sex offenders living in 37211 zip code as of April 27, 2024. The ratio of all residents to sex offenders in zip code 37211 is 830 to 1. The ratio of registered sex offenders to all residents in this zip code is lower than the state average.
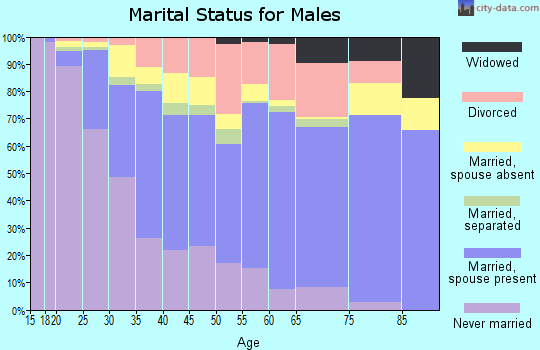
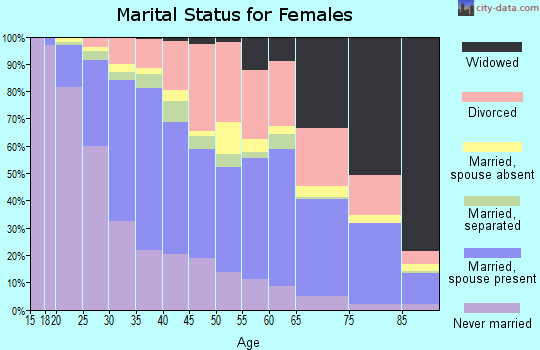
Median resident age:
This zip code:
33.1 years
Tennessee median age:
39.2 years
Average household size:
This zip code:
2.4 people
Tennessee:
2.4 people
Averages for the 2020 tax year for zip code 37211, filed in 2021:
Average Adjusted Gross Income (AGI) in 2020: $55,215 (Individual Income Tax Returns)
Here:
$55,215
State:
$69,014
Salary/wage: $51,177 (reported on 82.4% of returns)
Here:
$51,177
State:
$55,872
(% of AGI for various income ranges: 1192.2% for AGIs below $25k, 3859.6% for AGIs $25k-50k, 7023.4% for AGIs $50k-75k, 10459.8% for AGIs $75k-100k, 19118.3% for AGIs $100k-200k, 82613.3% for AGIs over 200k)
Taxable interest for individuals: $1,016 (reported on 18.6% of returns)
This zip code:
$1,016
Tennessee:
$1,945
(% of AGI for various income ranges: 7.9% for AGIs below $25k, 9.3% for AGIs $25k-50k, 19.5% for AGIs $50k-75k, 31.0% for AGIs $75k-100k, 72.2% for AGIs $100k-200k, 933.7% for AGIs over 200k)
Ordinary dividends: $2,476 (reported on 13.6% of returns)
Here:
$2,476
State:
$8,105
(% of AGI for various income ranges: 10.2% for AGIs below $25k, 14.5% for AGIs $25k-50k, 37.1% for AGIs $50k-75k, 74.4% for AGIs $75k-100k, 189.3% for AGIs $100k-200k, 1234.1% for AGIs over 200k)
Net capital gain/loss in AGI: +$8,441 (reported on 12.9% of returns)
Here:
+$8,441
State:
+$33,664
(% of AGI for various income ranges: 6.4% for AGIs below $25k, 15.5% for AGIs $25k-50k, 49.9% for AGIs $50k-75k, 159.0% for AGIs $75k-100k, 462.7% for AGIs $100k-200k, 8591.5% for AGIs over 200k)
Profit/loss from business: +$15,773 (reported on 25.1% of returns)
Here:
+$15,773
State:
+$18,991
(% of AGI for various income ranges: 330.4% for AGIs below $25k, 373.9% for AGIs $25k-50k, 484.0% for AGIs $50k-75k, 656.4% for AGIs $75k-100k, 1261.3% for AGIs $100k-200k, 9265.9% for AGIs over 200k)
Taxable individual retirement arrangement distribution: $15,785 (reported on 4.5% of returns)
37211:
$15,785
Tennessee:
$20,036
(% of AGI for various income ranges: 25.1% for AGIs below $25k, 38.0% for AGIs $25k-50k, 82.9% for AGIs $50k-75k, 180.5% for AGIs $75k-100k, 435.6% for AGIs $100k-200k, 1624.4% for AGIs over 200k)
Self-employed (Keogh) retirement plans: $18,747 (reported on 0.4% of returns)
37211:
$18,747
Tennessee:
$28,955
(% of AGI for various income ranges: 8.2% for AGIs $50k-75k, 38.9% for AGIs $100k-200k, 623.3% for AGIs over 200k)
Total itemized deductions: $26,945 (reported on 4.9% of returns)
Here:
$26,945
State:
$40,136
(% of AGI for various income ranges: 29.0% for AGIs below $25k, 63.4% for AGIs $25k-50k, 193.5% for AGIs $50k-75k, 325.3% for AGIs $75k-100k, 699.0% for AGIs $100k-200k, 4315.9% for AGIs over 200k)
Charity contributions: $10,508 (reported on 3.9% of returns)
Here:
$10,508
State:
$19,852
(% of AGI for various income ranges: 3.0% for AGIs below $25k, 13.0% for AGIs $25k-50k, 41.7% for AGIs $50k-75k, 92.5% for AGIs $75k-100k, 244.9% for AGIs $100k-200k, 1811.5% for AGIs over 200k)
Taxes paid: $4,825 (reported on 4.6% of returns)
37211:
$4,825
State:
$6,038
(% of AGI for various income ranges: 3.0% for AGIs below $25k, 9.6% for AGIs $25k-50k, 31.8% for AGIs $50k-75k, 61.2% for AGIs $75k-100k, 131.4% for AGIs $100k-200k, 711.1% for AGIs over 200k)
Earned income credit: $2,310 (reported on 16.9% of returns)
Here:
$2,310
State:
$2,391
(% of AGI for various income ranges: 102.2% for AGIs below $25k, 59.8% for AGIs $25k-50k, 0.7% for AGIs $50k-75k)
Percentage of individuals using paid preparers for their 2020 taxes: 90.0%
Here:
90%
State:
93%
(% for various income ranges: 85.4% for AGIs below $25k, 91.6% for AGIs $25k-50k, 93.2% for AGIs $50k-75k, 92.8% for AGIs $75k-100k, 93.4% for AGIs $100k-200k, 93.8% for AGIs over 200k)
Averages for the 2012 tax year for zip code 37211, filed in 2013:
Average Adjusted Gross Income (AGI) in 2012: $40,027 (Individual Income Tax Returns)
Here:
$40,027
State:
$53,767
Salary/wage: $38,284 (reported on 87.0% of returns)
Here:
$38,284
State:
$45,421
(% of AGI for various income ranges: 79.6% for AGIs below $25k, 88.1% for AGIs $25k-50k, 84.6% for AGIs $50k-75k, 83.7% for AGIs $75k-100k, 81.9% for AGIs $100k-200k, 73.5% for AGIs over 200k)
Taxable interest for individuals: $780 (reported on 19.2% of returns)
This zip code:
$780
Tennessee:
$1,732
(% of AGI for various income ranges: 0.5% for AGIs below $25k, 0.3% for AGIs $25k-50k, 0.3% for AGIs $50k-75k, 0.4% for AGIs $75k-100k, 0.4% for AGIs $100k-200k, 0.6% for AGIs over 200k)
Ordinary dividends: $2,508 (reported on 10.3% of returns)
Here:
$2,508
State:
$6,739
(% of AGI for various income ranges: 0.6% for AGIs below $25k, 0.3% for AGIs $25k-50k, 0.5% for AGIs $50k-75k, 0.7% for AGIs $75k-100k, 0.8% for AGIs $100k-200k, 1.5% for AGIs over 200k)
Net capital gain/loss in AGI: +$3,255 (reported on 7.8% of returns)
Here:
+$3,255
State:
+$19,082
(% of AGI for various income ranges: 0.3% for AGIs $50k-75k, 0.4% for AGIs $75k-100k, 1.2% for AGIs $100k-200k, 3.3% for AGIs over 200k)
Profit/loss from business: +$11,573 (reported on 19.5% of returns)
Here:
+$11,573
State:
+$15,240
(% of AGI for various income ranges: 13.2% for AGIs below $25k, 4.7% for AGIs $25k-50k, 4.1% for AGIs $50k-75k, 3.6% for AGIs $75k-100k, 3.8% for AGIs $100k-200k, 5.5% for AGIs over 200k)
Taxable individual retirement arrangement distribution: $11,986 (reported on 5.4% of returns)
37211:
$11,986
Tennessee:
$15,505
(% of AGI for various income ranges: 1.4% for AGIs below $25k, 1.1% for AGIs $25k-50k, 1.4% for AGIs $50k-75k, 2.2% for AGIs $75k-100k, 2.0% for AGIs $100k-200k, 2.0% for AGIs over 200k)
Self-employment retirement plans: $11,582 (reported on 0.3% of returns)
37211:
$11,582
Tennessee:
$22,567
(% of AGI for various income ranges: 0.1% for AGIs $50k-75k, 0.1% for AGIs $100k-200k, 0.5% for AGIs over 200k)
Total itemized deductions: $16,910 (21% of AGI, reported on 20.4% of returns)
Here:
$16,910
State:
$21,976
Here:
21.1% of AGI
State:
17.8% of AGI
(% of AGI for various income ranges: 5.1% for AGIs below $25k, 6.8% for AGIs $25k-50k, 10.0% for AGIs $50k-75k, 10.8% for AGIs $75k-100k, 11.3% for AGIs $100k-200k, 8.3% for AGIs over 200k)
Charity contributions: $4,193 (reported on 16.1% of returns)
Here:
$4,193
State:
$6,709
(% of AGI for various income ranges: 0.5% for AGIs below $25k, 0.9% for AGIs $25k-50k, 1.7% for AGIs $50k-75k, 2.2% for AGIs $75k-100k, 3.0% for AGIs $100k-200k, 2.4% for AGIs over 200k)
Taxes paid: $3,837 (reported on 19.9% of returns)
37211:
$3,837
State:
$4,829
(% of AGI for various income ranges: 0.8% for AGIs below $25k, 1.3% for AGIs $25k-50k, 2.1% for AGIs $50k-75k, 2.5% for AGIs $75k-100k, 2.7% for AGIs $100k-200k, 2.4% for AGIs over 200k)
Earned income credit: $2,382 (reported on 21.8% of returns)
Here:
$2,382
State:
$2,404
(% of AGI for various income ranges: 6.9% for AGIs below $25k, 1.0% for AGIs $25k-50k)
Percentage of individuals using paid preparers for their 2012 taxes: 44.1%
Here:
44%
State:
52%
(% for various income ranges: 46.2% for AGIs below $25k, 41.0% for AGIs $25k-50k, 41.3% for AGIs $50k-75k, 42.7% for AGIs $75k-100k, 47.4% for AGIs $100k-200k, 63.9% for AGIs over 200k)
Averages for the 2004 tax year for zip code 37211, filed in 2005:
Average Adjusted Gross Income (AGI) in 2004: $35,448 (Individual Income Tax Returns)
Here:
$35,448
State:
$44,088
Salary/wage: $34,340 (reported on 88.6% of returns)
Here:
$34,340
State:
$38,825
(% of AGI for various income ranges: 106.7% for AGIs below $10k, 84.6% for AGIs $10k-25k, 89.5% for AGIs $25k-50k, 86.3% for AGIs $50k-75k, 86.6% for AGIs $75k-100k, 78.1% for AGIs over 100k)
Taxable interest for individuals: $969 (reported on 28.4% of returns)
This zip code:
$969
Tennessee:
$1,802
(% of AGI for various income ranges: 2.2% for AGIs below $10k, 1.0% for AGIs $10k-25k, 0.6% for AGIs $25k-50k, 0.7% for AGIs $50k-75k, 0.7% for AGIs $75k-100k, 0.9% for AGIs over 100k)
Taxable dividends: $1,510 (reported on 13.7% of returns)
Here:
$1,510
State:
$3,727
(% of AGI for various income ranges: 1.3% for AGIs below $10k, 0.4% for AGIs $10k-25k, 0.4% for AGIs $25k-50k, 0.5% for AGIs $50k-75k, 0.5% for AGIs $75k-100k, 1.1% for AGIs over 100k)
Net capital gain/loss: +$4,078 (reported on 10.8% of returns)
Here:
+$4,078
State:
+$15,776
(% of AGI for various income ranges: -0.4% for AGIs below $10k, 0.0% for AGIs $10k-25k, 0.2% for AGIs $25k-50k, 0.5% for AGIs $50k-75k, 0.9% for AGIs $75k-100k, 4.7% for AGIs over 100k)
Profit/loss from business: +$9,606 (reported on 15.6% of returns)
Here:
+$9,606
State:
+$12,882
(% of AGI for various income ranges: 8.1% for AGIs below $10k, 6.2% for AGIs $10k-25k, 3.4% for AGIs $25k-50k, 3.5% for AGIs $50k-75k, 3.6% for AGIs $75k-100k, 4.7% for AGIs over 100k)
IRA payment deduction: $2,610 (reported on 1.6% of returns)
37211:
$2,610
Tennessee:
$2,934
(% of AGI for various income ranges: 0.1% for AGIs below $10k, 0.1% for AGIs $10k-25k, 0.1% for AGIs $25k-50k, 0.1% for AGIs $50k-75k, 0.1% for AGIs $75k-100k, 0.1% for AGIs over 100k)
Self-employed pension: $8,816 (reported on 0.5% of returns)
Here:
$8,816
Tennessee:
$16,857
(% of AGI for various income ranges: 0.0% for AGIs $25k-50k, 0.1% for AGIs $50k-75k, 0.2% for AGIs $75k-100k, 0.3% for AGIs over 100k)
Total itemized deductions: $14,780 (23% of AGI, reported on 25.0% of returns)
Here:
$14,780
State:
$18,035
Here:
22.6% of AGI
State:
19.9% of AGI
(% of AGI for various income ranges: 9.9% for AGIs below $10k, 5.9% for AGIs $10k-25k, 8.9% for AGIs $25k-50k, 12.7% for AGIs $50k-75k, 13.8% for AGIs $75k-100k, 11.5% for AGIs over 100k)
Charity contributions deductions: $3,454 (5% of AGI, reported on 21.0% of returns)
Here:
$3,454
State:
$5,167
Here:
5.0% of AGI
State:
5.3% of AGI
(% of AGI for various income ranges: 0.8% for AGIs below $10k, 0.8% for AGIs $10k-25k, 1.4% for AGIs $25k-50k, 2.4% for AGIs $50k-75k, 2.9% for AGIs $75k-100k, 3.1% for AGIs over 100k)
Total tax: $4,977 (reported on 72.3% of returns)
37211:
$4,977
State:
$7,482
(% of AGI for various income ranges: 3.3% for AGIs below $10k, 4.1% for AGIs $10k-25k, 7.5% for AGIs $25k-50k, 10.3% for AGIs $50k-75k, 11.7% for AGIs $75k-100k, 17.9% for AGIs over 100k)
Earned income credit: $1,743 (reported on 18.4% of returns)
Here:
$1,743
State:
$1,826
Percentage of individuals using paid preparers for their 2004 taxes: 49.1%
Here:
49%
State:
60%
(% for various income ranges: 48.3% for AGIs below $10k, 53.5% for AGIs $10k-25k, 45.4% for AGIs $25k-50k, 46.9% for AGIs $50k-75k, 46.3% for AGIs $75k-100k, 56.0% for AGIs over 100k)
Likely homosexual households (counted as self-reported same-sex unmarried-partner households)
Lesbian couples: 0.2% of all households
Gay men: 0.4% of all households
Household received Food Stamps/SNAP in the past 12 months: 2,463 Household did not receive Food Stamps/SNAP in the past 12 months: 29,206
Women who had a birth in the past 12 months: 1,133 (888 now married, 251 unmarried) Women who did not have a birth in the past 12 months: 18,529 (8,445 now married, 10,085 unmarried)
Housing units in zip code 37211 with a mortgage: 10,505 (779 second mortgage, 31 home equity loan, 667 both second mortgage and home equity loan) Houses without a mortgage: 356
Median monthly owner costs for units with a mortgage: $1,664 Median monthly owner costs for units without a mortgage: $491
Residents with income below the poverty level in 2022:
This zip code:
16.8%
Whole state:
13.3%
Residents with income below 50% of the poverty level in 2022:
This zip code:
7.6%
Whole state:
7.1%
Median number of rooms in houses and condos:
Here:
6.2
State:
6.5
Median number of rooms in apartments:
Here:
3.9
State:
4.4
Notable locations in this zip code not listed on our city pages
Notable locations in zip code 37211: Ellington Agriculture Center (A), Crievewood Baptist Church Christian Recreation Center (B), Tusculum Church of Christ Teen Life Center (C), Nashville Fire Department Station 4 (D), Nashville Fire Department Station 6 (E), Nashville Fire Department Station 10 (F), Nashville Fire Department Station 21 (G), Nashville Fire Department Station 27 (H), DeBerry Correctional Institutue (I), Saint Thomas Emergency Medical Services (J), Rural / Metro Ambulance Davidson County (K). Display/hide their locations on the map
Shopping Centers: Perimeter Park Center Shopping Center (1), Windlands Shopping Center (2), Tusculum Shopping Center (3), Hickory Plaza Shopping Center (4), Harding Plaza Shopping Center (5), Harding Mall Shopping Center (6), Fairlane Shopping Center (7), Elysian Plaza Shopping Center (8), Elysian Fields Shopping Center (9). Display/hide their locations on the map
Churches in zip code 37211 include: Rosedale Church (A), Saint Matthias Church (B), Mount Pisgah Church (C), Mill Creek Church (D), Meads Chapel (E), Hillcrest Church (F), Crievewood Church (G), Antioch Community Church of God (H), Glencliff United Methodist Church (I). Display/hide their locations on the map
9,184 married couples with children.
4,578 single-parent households (1,513 men, 3,065 women).
66.6% of residents of 37211 zip code speak English at home.
20.5% of residents speak Spanish at home (28% very well, 24% well, 34% not well, 14% not at all).
5.3% of residents speak other Indo-European language at home (65% very well, 18% well, 13% not well, 5% not at all).
3.9% of residents speak Asian or Pacific Island language at home (44% very well, 20% well, 32% not well, 5% not at all).
5.1% of residents speak other language at home (50% very well, 14% well, 28% not well, 8% not at all).
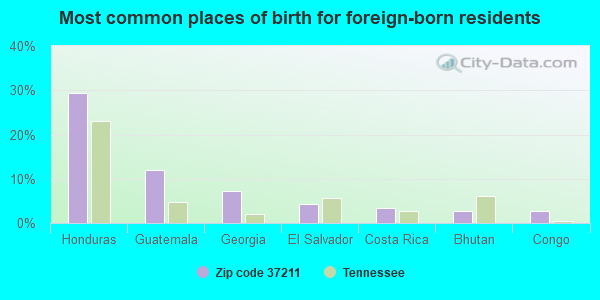
Foreign born population: 19,504 (25.7%) (28.9% of them are naturalized citizens)
This zip code:
25.7%
Whole state:
5.6%
29%Honduras
12%Guatemala
7%Georgia
4%El Salvador
3%Costa Rica
3%Bhutan
3%Congo
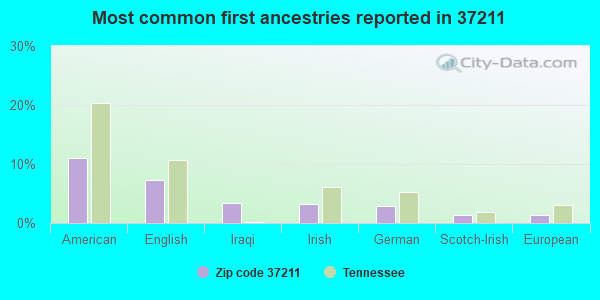
11%American
7%English
3%Iraqi
3%Irish
3%German
1%Scotch-Irish
1%European
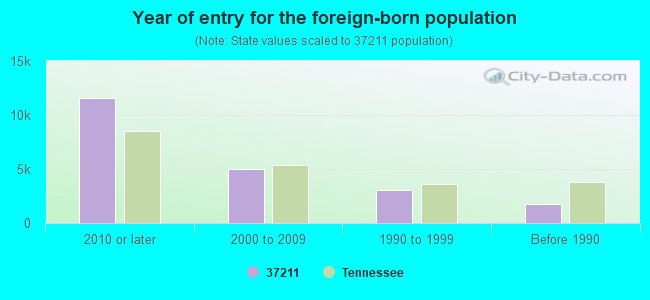
Year of entry for the foreign-born population
11,5432010 or later
4,9762000 to 2009
3,0201990 to 1999
1,773Before 1990
Major facilities with environmental interests located in this zip code:
CSX TRANSPORTATION (3661 SEABOARD DRIVE in NASHVILLE, TN)
AIR MINOR (AIRS/AFS) CRITERIA AND HAZARDOUS AIR POLLUTANT INVENTORY (Inventory of air pollution sources) National Pollutant Discharge Elimination System NON-MAJOR (Tracking pollutant discharge elimination systems) - permit Business SIC classification: RAILROADS, LINE-HAUL OPERATING; RAILROAD SWITCHING AND TERMINAL ESTABLISHMENTS; PETROLEUM BULK STATIONS AND TERMINALS Organizations: CSX TRANSPORTATION INC (CONTACT/OPERATOR)
, C.A. GERHARDSTEIN (CONTACT/OWNER)
Alternative names: C S X TRANSPORTATION, INC., CSX TRANSPORTATION-RADNOR YARD
CONCORD CUSTOM CLEANERS #094 (15554 OLD HICKORY BOULEVARD in NASHVILLE, TN)
AIR MINOR (AIRS/AFS) (Resource Conservation and Recovery Act (tracking hazardous waste)) Business SIC classification: LAUNDRY AND GARMENT SERVICES Alternative names: CONCORD CUSTOMS CLEANERS
CAPITOL DRY CLEANERS (2632 NOLENSVILLE RD in NASHVILLE, TN)
AIR MINOR (AIRS/AFS) (Resource Conservation and Recovery Act (tracking hazardous waste)) Business SIC classification: DRYCLEANING PLANTS, EXCEPT RUG CLEANING
CLOPAY PLASTICS PRODUCTS CO., INC. (555 HARDING INDUSTRIAL DRIVE in NASHVILLE, TN)
AIR SYNTHETIC MINOR (AIRS/AFS) Large Quantity Generators, more that 1000 kg of hazardous waste/month (Resource Conservation and Recovery Act (tracking hazardous waste)) Business SIC classification: COMMERCIAL PRINTING Business NAICS classification: COMMERCIAL FLEXOGRAPHIC PRINTING. Organizations: VANCE GREEN (CONTACT/OPERATOR)
, GRIFFON CORPORATION (CONTACT/OWNER)
Alternative names: CLOPAY PLASTIC PRODUCTS
A. SCHULMAN INCORPORATED - NASHVILLE PLANT (481 ALLIED DRIVE in NASHVILLE, TN)
AIR MINOR (AIRS/AFS) CRITERIA AND HAZARDOUS AIR POLLUTANT INVENTORY (Inventory of air pollution sources) TRI REPORTER (Tracking of toxic chemicals releasing facilities) Business SIC classification: CUSTOM COMPOUNDING OF PURCHASED PLASTICS RESINS Business NAICS classification: CUSTOM COMPOUNDING OF PURCHASED RESINS. Alternative names: A. SCHULMAN INC. NASHVILLE PLANT, COMALLOY INTL. CO.
CSX TRANSPORTATION, INCORPORATED (3800 SEABOARD DR in NASHVILLE, TN)
(Resource Conservation and Recovery Act (tracking hazardous waste)) Business NAICS classification: LINE-HAUL RAILROADS. Organizations: CARL A GERHARDSTEIN (CONTACT/OPERATOR)
BUMPER RECYCLERS INC (2209 DUNN AVE in NASHVILLE, TN)
AIR MINOR (AIRS/AFS) CRITERIA AND HAZARDOUS AIR POLLUTANT INVENTORY (Inventory of air pollution sources) Business SIC classification: MOTOR VEHICLE PARTS AND ACCESSORIES
COMMERCIAL REFURBISHING INC (2154 UTOPIA AVENUE in NASHVILLE, TN)
(Resource Conservation and Recovery Act (tracking hazardous waste))
COTTON CLEANERS (5551 EDMONDSON PIKE in NASHVILLE, TN)
AIR MAJOR ("Best Available" air pollution technologies tracking) Conditionally Exempt Small Quantity Generators, less than 100 kg/month of hazardous waste (Resource Conservation and Recovery Act (tracking hazardous waste)) - notification Business SIC classification: CROP PLANTING, CULTIVATING, AND PROTECTING Organizations: JUNG HYUM LEE (CONTACT/OPERATOR)
CREATIVE DISPLAY (408 HARDING INDUSTRIAL DRIVE in NASHVILLE, TN)
AIR MINOR (AIRS/AFS) CRITERIA AND HAZARDOUS AIR POLLUTANT INVENTORY (Inventory of air pollution sources) Business SIC classification: WOOD OFFICE AND STORE FIXTURES, PARTITIONS, SHELVING, AND LOCKERS
DIXIE GRAPHICS (636 GRASSMERE PK in NASHVILLE, TN)
HAZARDOUS WASTE BIENNIAL REPORTER (Resource Conservation and Recovery Act (tracking hazardous waste)) Small Quantity Generators, between 100 kg and 1000 kg of hazardous waste/month (Resource Conservation and Recovery Act (tracking hazardous waste)) Business NAICS classification: ELECTROPLATING, PLATING, POLISHING, ANODIZING, AND COLORING.; PRINTING MACHINERY AND EQUIPMENT MANUFACTURING. Organizations: LARRY SPINKLES (CONTACT/OPERATOR)
, JAMES R MEADOWS JR (CONTACT/OWNER)
DODGE CLEANERS #13 (367-C HARDING PLACE in NASHVILLE, TN)
(Resource Conservation and Recovery Act (tracking hazardous waste)) Organizations: JOHNSON GROUP INC (CONTACT/OWNER)
DOUGLAS PRINTING INC. (2601 WINFORD AVE. in NASHVILLE, TN)
AIR MINOR (AIRS/AFS) CRITERIA AND HAZARDOUS AIR POLLUTANT INVENTORY (Inventory of air pollution sources) Business SIC classification: PERIODICALS: PUBLISHING, OR PUBLISHING AND PRINTING
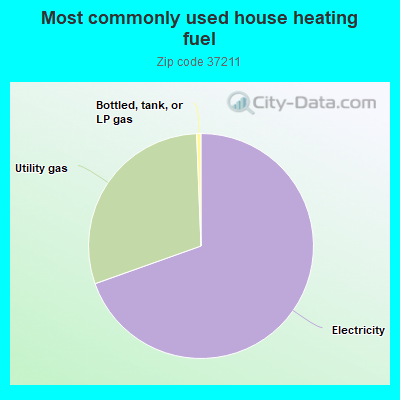
Housing units lacking complete plumbing facilities: 0.5% Housing units lacking complete kitchen facilities: 0.5%
69.0%Electricity
29.6%Utility gas
0.6%Bottled, tank, or LP gas
Population in 1990: 51,478. Population change in the 1990s: +13,275 (+25.8%).
Place of birth for U.S.-born residents:
This state: 29,491
Northeast: 3,276
Midwest: 7,054
South: 12,595
West: 3,634
42% of the 37211 zip code residents lived in the same house 5 years ago. Out of people who lived in different houses, 56% lived in this county. Out of people who lived in different counties, 50% lived in Tennessee.
80% of the 37211 zip code residents lived in the same house 1 year ago. Out of people who lived in different houses, 51% moved from this county. Out of people who lived in different houses, 16% moved from different county within same state. Out of people who lived in different houses, 21% moved from different state. Out of people who lived in different houses, 11% moved from abroad.
Private vs. public school enrollment:
Students in private schools in grades 1 to 8 (elementary and middle school): 643
Here:
10.0%
Tennessee:
15.0%
Students in private schools in grades 9 to 12 (high school): 286
Here:
11.2%
Tennessee:
16.2%
Students in private undergraduate colleges: 964
Here:
38.0%
Tennessee:
23.5%
Occupation by median earnings in the past 12 months ($)
85,570Legal occupations
80,601Computer and mathematical occupations
74,254Management occupations
70,930Architecture and engineering occupations
65,066Business and financial operations occupations
63,913Life, physical, and social science occupations
Companies with biggest federal contracts located in this zip code (NASHVILLE, TN):
SABRE DEFENSE INDUSTRIES, LLC (450 ALLIED DR; small business) : $40,216,413 in 51 contractsfrom 2003 to 2006
Contracts for Guns, through 30 mm, Miscellaneous Weapons by Army, Defense Logistics Agency, Navy Signed by year:2000: $0; 2001: $0; 2002: $0; 2003: $6,223,280; 2004: $13,335,227; 2005: $10,935,064; 2006: $9,722,842.
Biggest contracts:
$4,250,000 with Army for Guns, through 30 mm. Signed on 2006-02-27. Completion date: 2007-12-31.
$3,352,000, same as above.Signed on 2004-10-19. Completion date: 2007-12-31.
$3,276,000, same as above.Signed on 2004-02-17. Completion date: 2005-09-30.
$2,918,000, same as above.Signed on 2005-04-06. Completion date: 2008-12-31.
AMEC EARTH & ENVIRONMENTAL, IN (3800 EZELL ROAD) : $7,874,544 in 141 contractsfrom 2001 to 2006
Contracts for Architect - Engineer Services (including landscaping, interior layout, and designing), Other Architect and Engineering Services, Policy Review/Development Services, Environmental Studies and Assessments, and moreby Army, U.S. Army Corps of Engineers - civil program financing only, Navy Signed by year:2000: $0; 2001: $171,373; 2002: $1,112,848; 2003: $2,046,293; 2004: $2,109,577; 2005: $1,344,231; 2006: $1,090,222.
Biggest contracts:
$496,909 with Army for Architect - Engineer Services (including landscaping, interior layout, and designing). Taking place in KY. Signed on 2006-01-17. Completion date: 2006-04-07.
$432,509, same as above.Signed on 2003-11-20. Completion date: 2004-03-26.
$432,509 with U.S. Army Corps of Engineers - civil program financing only for Architect - Engineer Services (including landscaping, interior layout, and designing). Taking place in KY. Signed on 2003-11-20. Completion date: 2004-03-26.
$278,217 with Navy for Other Architect and Engineering Services. Taking place in FL. Signed on 2002-03-29. Completion date: 2003-03-31.
OGDEN ENVIRONMENTAL AND ENERGY (3800 EZELL RD SUITE 100) : $3,503,546 in 70 contractsfrom 1999 to 2005
Contracts for Other Architect and Engineering Services, Highways, Roads, Streets, Bridges, and Railways, Architect - Engineer Services (including landscaping, interior layout, and designing) by Navy, U.S. Army Corps of Engineers - civil program financing only Signed by year:2000: $1,334,171; 2001: $2,141,537; 2002: -$12,362; 2003: -$1; 2004: $0; 2005: $30,201; 2006: $0.
Biggest contracts:
$304,339 with Navy for Other Architect and Engineering Services. Taking place in NC. Signed on 2001-07-02. Completion date: 2002-06-30.
$211,054 with U.S. Army Corps of Engineers - civil program financing only for Highways, Roads, Streets, Bridges, and Railways. Signed on 2000-09-14. Completion date: 2001-03-31.
$180,321 with U.S. Army Corps of Engineers - civil program financing only for Architect - Engineer Services (including landscaping, interior layout, and designing). Taking place in AL. Signed on 2001-05-25. Completion date: 2001-09-25.
$154,876 with U.S. Army Corps of Engineers - civil program financing only for Architect - Engineer Services (including landscaping, interior layout, and designing). Signed on 2000-08-08. Completion date: 2001-02-09.
RAMO DEFENSE SYSTEMS, LLC (450 ALLIED DR; small business) : $3,007,355 in 15 contractsfrom 2001 to 2005
Contracts for Guns, through 30 mm by Army, Defense Logistics Agency, Navy, Air Force, and others Signed by year:2000: $0; 2001: $2,826,625; 2002: $3,030; 2003: $0; 2004: $88,000; 2005: $89,700; 2006: $0.
Biggest contracts:
$1,499,875 with Army for Guns, through 30 mm. Signed on 2001-10-24. Completion date: 2003-03-31.
$528,125, same as above.Signed on 2001-06-12. Completion date: 2003-03-31.
$320,908 with Defense Logistics Agency for Guns, through 30 mm. Signed on 2001-06-19. Completion date: 2002-01-05.
$213,500, same as above.Signed on 2002-05-15. Completion date: 2002-09-13.
GREER STOP NUT, INC (481 MCNALLY DR; small business) : $1,407,672 in 48 contractsfrom 2000 to 2006
Contracts for Nuts and Washers by Defense Logistics Agency, Navy Signed by year:2000: $507,443; 2001: $539,677; 2002: $71,223; 2003: $0; 2004: $118,729; 2005: $160,827; 2006: $9,773.
Biggest contracts:
$90,000 with Defense Logistics Agency for Nuts and Washers. Signed on 2000-10-19. Completion date: 2000-10-20.
$88,000, same as above.Signed on 2000-03-18. Completion date: 2000-07-12.
$86,339 with Navy for Nuts and Washers. Signed on 2001-05-24. Completion date: 2001-05-24.
$81,472 with Defense Logistics Agency for Nuts and Washers. Signed on 2001-04-17. Completion date: 2001-08-17.
RAMO DEFENSE SYSTEMS, LLC (450 ALLIED DR.; small business) : $1,168,846 in 3 contractsin 2000
$1,000,538 with Defense Logistics Agency for Guns, through 30 mm. Signed on 2000-08-04. Completion date: 2001-08-19.
$106,814, same as above.Signed on 2000-05-25. Completion date: 2000-12-29.
$61,494, same as above.Signed on 2000-07-25. Completion date: 2001-06-13.
ANDERSON PIPING INC (422 ROSEDALE AVE; small business) : $1,094,562 in 3 contractsin 2000
$1,082,000 with Department of Veterans Affairs for Maintenance, Repair or Alteration of Real Property -- Hospitals and Infirmaries. Signed on 2000-09-15. Completion date: 2001-04-15.
$6,281 with Army for Maintenance, Repair or Alteration of Real Property -- Office Buildings. Signed on 2000-10-28. Completion date: 2001-03-13.
$6,281, same as above.Signed on 2000-09-28. Completion date: 2001-03-03.
PREMIER GLOBAL PRODUCTION COMP (208 SPACE PARK DRIVE S; small business) : $704,300 in 5 contractsfrom 2004 to 2006
Contracts for Fencing, Fences, Gates and Components, Lease or Rental of Equipment -- Miscellaneous, Guard Services by Public Buildings Service, Army, Bureau of Immigration and Customs Enforcement Signed by year:2000: $0; 2001: $0; 2002: $0; 2003: $0; 2004: $625,000; 2005: $25,200; 2006: $54,100.
Biggest contracts:
$625,000 with Public Buildings Service for Fencing, Fences, Gates and Components. Taking place in GA. Signed on 2004-05-27. Completion date: 2004-06-05.
$39,600 with Army for Lease or Rental of Equipment -- Miscellaneous. Taking place in MS. Signed on 2006-04-14. Completion date: 2005-12-08.
$25,200 with Bureau of Immigration and Customs Enforcement for Guard Services. Taking place in MS. Signed on 2005-09-17. Completion date: 2005-12-16.
$14,500 with Bureau of Immigration and Customs Enforcement for Fencing, Fences, Gates and Components. Taking place in GA. Signed on 2006-02-09. Completion date: 2006-03-03.
KEY TEL, INC (2845 LOGAN STREET; small business) : $296,939 in 4 contractsfrom 2000 to 2001
$135,816 with Department of Defense for ADP Support Equipment. Signed on 2001-09-24. Completion date: 2001-11-30.
$89,786 with Department of Defense for Telephone and Telegraph Equipment. Signed on 2001-08-23. Completion date: 2002-08-22.
$43,070 with Department of Defense for Lease or Rental of Equipment -- Communication, Detection, and Coherent Radiation Equipment. Signed on 2000-11-29. Completion date: 2000-11-29.
$28,267, same as above.Signed on 2000-09-25. Completion date: 2000-08-18.
CARDIAC SERVICES INC (618 GRASSMERE PARK STE 17; small business) : $213,000 in 2 contractsin 2003
$114,000 with Air Force for Lease or Rental of Equipment -- Medical, Dental, and Veterinary Equipment and Supplies. Taking place in MS. Signed on 2003-10-01. Completion date: 2003-12-17.
$99,000, same as above.Signed on 2003-08-06. Completion date: 2003-09-30.
Top industries in this zip code by the number of employees in 2005:
Administrative and Support and Waste Management and Remediation Services: Temporary Help Services (250-499: 1, 100-249: 1, 50-99: 4, 20-49: 2, 5-9: 1, 1-4: 4)
Health Care and Social Assistance: Services for the Elderly and Persons with Disabilities (250-499: 2, 50-99: 2, 1-4: 1)
Administrative and Support and Waste Management and Remediation Services: Security Guards and Patrol Services (100-249: 3, 50-99: 2, 10-19: 1, 5-9: 1, 1-4: 2)
People in group quarters in 2010:
1,147 people in state prisons
1,081 people in local jails and other municipal confinement facilities
190 people in correctional residential facilities
47 people in group homes for juveniles (non-correctional)
35 people in group homes intended for adults
2 people in other noninstitutional facilities
People in group quarters in 2000:
1,711 people in local jails and other confinement facilities (including police lockups)
222 people in nursing homes
93 people in wards in general hospitals for patients who have no usual home elsewhere
31 people in other group homes
Fatal accident statistics in 2014:
Fatal accident count: 7
Vehicles involved in fatal accidents: 8
Fatal accidents caused by drunken drivers: 2
Fatalities: 7
Persons involved in fatal accidents: 10
Pedestrians involved in fatal accidents: 3
Fatal accident statistics in 2013:
Fatal accident count: 7
Vehicles involved in fatal accidents: 13
Fatal accidents caused by drunken drivers: 1
Fatalities: 8
Persons involved in fatal accidents: 19
Pedestrians involved in fatal accidents: 0
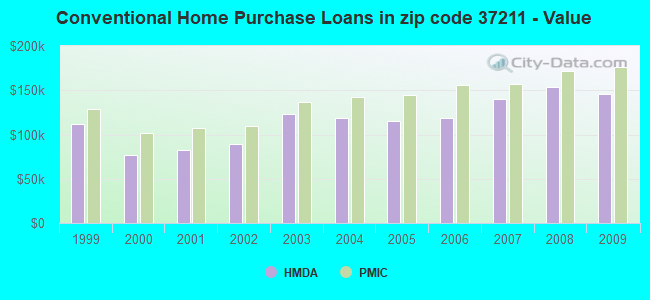
Home Mortgage Disclosure Act Aggregated Statistics For Year 2009 (Based on 13 full and 20 partial tracts)
A) FHA, FSA/RHS & VA Home Purchase Loans
B) Conventional Home Purchase Loans
C) Refinancings
D) Home Improvement Loans
E) Loans on Dwellings For 5+ Families
F) Non-occupant Loans on < 5 Family Dwellings (A B C & D)
G) Loans On Manufactured Home Dwelling (A B C & D)
Number
Average Value
Number
Average Value
Number
Average Value
Number
Average Value
Number
Average Value
Number
Average Value
Number
Average Value
LOANS ORIGINATED
632
$160,700
378
$145,228
1,709
$162,648
71
$47,473
4
$2,560,405
117
$100,281
2
$136,065
APPLICATIONS APPROVED, NOT ACCEPTED
22
$138,932
34
$131,386
173
$152,663
13
$49,295
0
$0
13
$94,630
0
$0
APPLICATIONS DENIED
58
$145,042
66
$125,772
658
$151,443
81
$35,706
0
$0
50
$85,033
0
$0
APPLICATIONS WITHDRAWN
95
$162,828
79
$173,525
395
$167,768
12
$99,740
0
$0
26
$72,490
0
$0
FILES CLOSED FOR INCOMPLETENESS
7
$162,151
9
$105,774
90
$145,326
2
$67,500
1
$6,500,000
5
$66,924
0
$0
Aggregated Statistics For Year 2008 (Based on 13 full and 20 partial tracts)
A) FHA, FSA/RHS & VA Home Purchase Loans
B) Conventional Home Purchase Loans
C) Refinancings
D) Home Improvement Loans
E) Loans on Dwellings For 5+ Families
F) Non-occupant Loans on < 5 Family Dwellings (A B C & D)
G) Loans On Manufactured Home Dwelling (A B C & D)
Number
Average Value
Number
Average Value
Number
Average Value
Number
Average Value
Number
Average Value
Number
Average Value
Number
Average Value
LOANS ORIGINATED
392
$154,707
792
$153,500
1,112
$148,976
84
$46,025
7
$2,079,549
238
$99,477
0
$0
APPLICATIONS APPROVED, NOT ACCEPTED
14
$132,886
65
$147,107
163
$128,654
19
$40,442
0
$0
28
$110,073
2
$71,500
APPLICATIONS DENIED
63
$160,197
113
$116,358
593
$139,113
163
$39,853
0
$0
65
$95,149
7
$39,283
APPLICATIONS WITHDRAWN
60
$161,375
118
$159,607
353
$154,733
15
$91,131
2
$2,349,500
40
$110,660
0
$0
FILES CLOSED FOR INCOMPLETENESS
15
$116,665
29
$132,154
60
$166,436
13
$87,635
0
$0
5
$115,630
0
$0
Aggregated Statistics For Year 2007 (Based on 13 full and 20 partial tracts)
A) FHA, FSA/RHS & VA Home Purchase Loans
B) Conventional Home Purchase Loans
C) Refinancings
D) Home Improvement Loans
E) Loans on Dwellings For 5+ Families
F) Non-occupant Loans on < 5 Family Dwellings (A B C & D)
G) Loans On Manufactured Home Dwelling (A B C & D)
Number
Average Value
Number
Average Value
Number
Average Value
Number
Average Value
Number
Average Value
Number
Average Value
Number
Average Value
LOANS ORIGINATED
180
$146,464
2,193
$139,754
1,102
$131,037
112
$49,740
2
$9,014,520
374
$111,964
0
$0
APPLICATIONS APPROVED, NOT ACCEPTED
10
$131,494
263
$116,756
241
$136,891
50
$53,379
0
$0
53
$84,124
0
$0
APPLICATIONS DENIED
34
$141,074
307
$127,263
785
$133,476
192
$54,849
2
$827,050
102
$86,691
7
$81,240
APPLICATIONS WITHDRAWN
32
$141,362
218
$125,504
384
$154,438
30
$65,908
3
$1,848,873
45
$103,682
2
$171,270
FILES CLOSED FOR INCOMPLETENESS
7
$152,744
48
$140,553
182
$159,045
0
$0
0
$0
14
$123,368
0
$0
Aggregated Statistics For Year 2006 (Based on 13 full and 20 partial tracts)
A) FHA, FSA/RHS & VA Home Purchase Loans
B) Conventional Home Purchase Loans
C) Refinancings
D) Home Improvement Loans
E) Loans on Dwellings For 5+ Families
F) Non-occupant Loans on < 5 Family Dwellings (A B C & D)
G) Loans On Manufactured Home Dwelling (A B C & D)
Number
Average Value
Number
Average Value
Number
Average Value
Number
Average Value
Number
Average Value
Number
Average Value
Number
Average Value
LOANS ORIGINATED
204
$146,673
2,766
$119,036
1,148
$120,864
144
$36,722
12
$7,136,450
466
$94,471
9
$43,786
APPLICATIONS APPROVED, NOT ACCEPTED
8
$132,275
291
$104,328
271
$114,152
47
$41,296
1
$11,000
56
$105,609
14
$43,679
APPLICATIONS DENIED
30
$133,749
504
$101,721
926
$120,863
199
$44,019
3
$2,612,667
149
$86,233
20
$53,895
APPLICATIONS WITHDRAWN
32
$126,494
348
$111,952
547
$123,695
37
$65,311
0
$0
63
$99,940
1
$92,520
FILES CLOSED FOR INCOMPLETENESS
3
$155,443
78
$106,567
177
$131,325
4
$22,072
0
$0
17
$82,962
0
$0
Aggregated Statistics For Year 2005 (Based on 13 full and 20 partial tracts)
A) FHA, FSA/RHS & VA Home Purchase Loans
B) Conventional Home Purchase Loans
C) Refinancings
D) Home Improvement Loans
E) Loans on Dwellings For 5+ Families
F) Non-occupant Loans on < 5 Family Dwellings (A B C & D)
G) Loans On Manufactured Home Dwelling (A B C & D)
Number
Average Value
Number
Average Value
Number
Average Value
Number
Average Value
Number
Average Value
Number
Average Value
Number
Average Value
LOANS ORIGINATED
272
$125,438
2,527
$114,859
1,395
$118,219
129
$45,341
13
$2,787,998
487
$86,226
8
$30,464
APPLICATIONS APPROVED, NOT ACCEPTED
14
$122,441
293
$88,977
347
$108,558
26
$41,625
1
$11,850,000
40
$71,416
18
$43,291
APPLICATIONS DENIED
29
$128,717
463
$96,829
1,075
$119,318
170
$39,789
0
$0
109
$89,721
40
$47,058
APPLICATIONS WITHDRAWN
41
$124,780
381
$123,009
848
$130,054
58
$120,909
0
$0
88
$104,795
1
$42,000
FILES CLOSED FOR INCOMPLETENESS
2
$163,000
144
$89,967
140
$129,326
8
$59,409
0
$0
15
$92,233
2
$95,500
Aggregated Statistics For Year 2004 (Based on 13 full and 20 partial tracts)
A) FHA, FSA/RHS & VA Home Purchase Loans
B) Conventional Home Purchase Loans
C) Refinancings
D) Home Improvement Loans
E) Loans on Dwellings For 5+ Families
F) Non-occupant Loans on < 5 Family Dwellings (A B C & D)
G) Loans On Manufactured Home Dwelling (A B C & D)
Number
Average Value
Number
Average Value
Number
Average Value
Number
Average Value
Number
Average Value
Number
Average Value
Number
Average Value
LOANS ORIGINATED
372
$127,276
1,975
$118,985
1,648
$116,477
125
$39,223
3
$1,291,953
350
$81,516
4
$54,750
APPLICATIONS APPROVED, NOT ACCEPTED
12
$146,105
219
$101,682
375
$112,675
25
$36,224
2
$4,378,500
52
$89,605
18
$36,202
APPLICATIONS DENIED
84
$112,177
404
$99,710
1,054
$111,615
174
$35,131
2
$1,425,455
90
$86,900
44
$40,682
APPLICATIONS WITHDRAWN
56
$145,149
270
$122,211
718
$118,957
20
$62,170
2
$19,865
62
$86,234
0
$0
FILES CLOSED FOR INCOMPLETENESS
9
$105,697
100
$101,452
128
$114,011
3
$68,857
0
$0
13
$78,385
1
$57,310
Aggregated Statistics For Year 2003 (Based on 13 full and 20 partial tracts)
A) FHA, FSA/RHS & VA Home Purchase Loans
B) Conventional Home Purchase Loans
C) Refinancings
D) Home Improvement Loans
E) Loans on Dwellings For 5+ Families
F) Non-occupant Loans on < 5 Family Dwellings (A B C & D)
Number
Average Value
Number
Average Value
Number
Average Value
Number
Average Value
Number
Average Value
Number
Average Value
LOANS ORIGINATED
467
$129,406
1,489
$123,671
3,822
$118,888
101
$19,640
7
$4,381,943
348
$82,637
APPLICATIONS APPROVED, NOT ACCEPTED
15
$125,691
156
$112,752
573
$110,675
30
$41,350
0
$0
33
$78,294
APPLICATIONS DENIED
87
$129,547
292
$92,491
1,113
$106,707
118
$21,002
0
$0
140
$80,614
APPLICATIONS WITHDRAWN
55
$119,199
185
$124,779
752
$118,633
7
$20,543
0
$0
44
$90,562
FILES CLOSED FOR INCOMPLETENESS
2
$143,185
79
$86,119
169
$108,827
2
$23,630
0
$0
15
$72,864
Aggregated Statistics For Year 2002 (Based on 6 full and 8 partial tracts)
A) FHA, FSA/RHS & VA Home Purchase Loans
B) Conventional Home Purchase Loans
C) Refinancings
D) Home Improvement Loans
F) Non-occupant Loans on < 5 Family Dwellings (A B C & D)
Number
Average Value
Number
Average Value
Number
Average Value
Number
Average Value
Number
Average Value
LOANS ORIGINATED
156
$112,882
337
$89,163
781
$89,754
37
$22,620
169
$60,869
APPLICATIONS APPROVED, NOT ACCEPTED
0
$0
41
$89,009
127
$90,741
8
$10,279
16
$64,246
APPLICATIONS DENIED
49
$106,859
105
$73,368
309
$81,052
54
$15,486
37
$60,210
APPLICATIONS WITHDRAWN
10
$101,347
46
$104,945
167
$83,555
5
$23,558
12
$83,534
FILES CLOSED FOR INCOMPLETENESS
2
$83,680
9
$93,843
41
$82,742
0
$0
5
$63,596
Aggregated Statistics For Year 2001 (Based on 6 full and 8 partial tracts)
A) FHA, FSA/RHS & VA Home Purchase Loans
B) Conventional Home Purchase Loans
C) Refinancings
D) Home Improvement Loans
E) Loans on Dwellings For 5+ Families
F) Non-occupant Loans on < 5 Family Dwellings (A B C & D)
Number
Average Value
Number
Average Value
Number
Average Value
Number
Average Value
Number
Average Value
Number
Average Value
LOANS ORIGINATED
199
$106,496
369
$83,004
659
$94,912
77
$15,193
5
$2,842,562
133
$74,252
APPLICATIONS APPROVED, NOT ACCEPTED
3
$126,570
55
$76,266
123
$78,338
16
$16,672
0
$0
30
$66,367
APPLICATIONS DENIED
15
$105,399
112
$72,497
339
$73,357
43
$16,782
0
$0
27
$63,452
APPLICATIONS WITHDRAWN
14
$103,452
46
$80,900
167
$78,446
9
$15,496
0
$0
7
$123,111
FILES CLOSED FOR INCOMPLETENESS
2
$172,000
31
$66,235
53
$84,401
2
$20,000
0
$0
4
$63,612
Aggregated Statistics For Year 2000 (Based on 6 full and 8 partial tracts)
A) FHA, FSA/RHS & VA Home Purchase Loans
B) Conventional Home Purchase Loans
C) Refinancings
D) Home Improvement Loans
F) Non-occupant Loans on < 5 Family Dwellings (A B C & D)
Number
Average Value
Number
Average Value
Number
Average Value
Number
Average Value
Number
Average Value
LOANS ORIGINATED
179
$101,465
348
$76,989
263
$70,364
53
$16,888
68
$78,203
APPLICATIONS APPROVED, NOT ACCEPTED
8
$82,929
63
$54,437
78
$110,447
14
$9,258
19
$231,854
APPLICATIONS DENIED
30
$82,449
202
$57,930
287
$76,266
63
$26,872
54
$63,754
APPLICATIONS WITHDRAWN
16
$109,973
48
$76,228
150
$60,974
12
$21,241
12
$55,982
FILES CLOSED FOR INCOMPLETENESS
3
$103,843
28
$61,444
44
$70,704
0
$0
9
$52,661
Aggregated Statistics For Year 1999 (Based on 6 full and 8 partial tracts)
A) FHA, FSA/RHS & VA Home Purchase Loans
B) Conventional Home Purchase Loans
C) Refinancings
D) Home Improvement Loans
F) Non-occupant Loans on < 5 Family Dwellings (A B C & D)
2003 - 2018 National Fire Incident Reporting System (NFIRS) incidents
Based on the data from the years 2003 - 2018 the average number of fire incidents per year is 165. The highest number of fire incidents - 283 took place in 2007, and the least - 81 in 2004. The data has a decreasing trend.
When looking into fire subcategories, the most reports belonged to: Outside Fires (43.6%), and Structure Fires (28.8%).
Fire incident types reported to NFIRS in Zip Code 37211

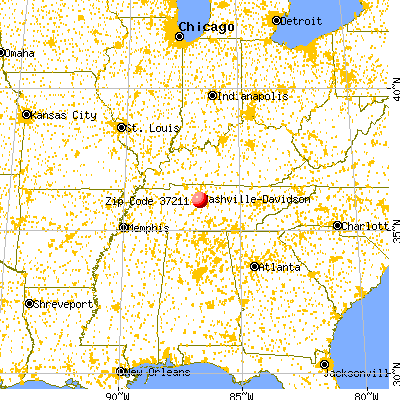


 Nearest zip codes: 37204, 37220, 37217, 37210, 37027, 37013.


 Based on the data from the years 2003 - 2018 the average number of fire incidents per year is 165. The highest number of fire incidents - 283 took place in 2007, and the least - 81 in 2004. The data has a decreasing trend.
 When looking into fire subcategories, the most reports belonged to: Outside Fires (43.6%), and Structure Fires (28.8%).