Estimated zip code population in 2022: 22,775 Zip code population in 2010: 21,190 Zip code population in 2000: 22,112
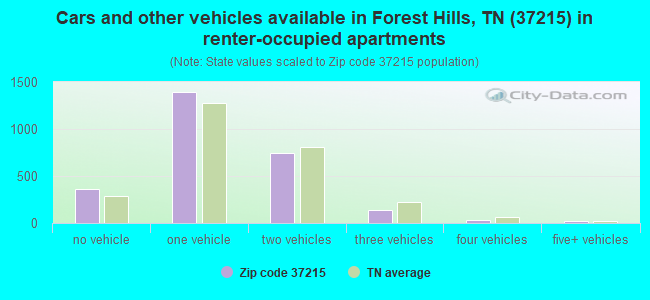
Houses and condos: 11,737 Renter-occupied apartments: 2,700
% of renters here:
25%
State:
33%
March 2022 cost of living index in zip code 37215: 93.6 (less than average, U.S. average is 100)
Land area: 15.6 sq. mi. Water area: 0.0 sq. mi.
Population density: 1,459 people per square mile
(low).
OSM Map
General Map
Google Map
MSN Map
OSM Map
General Map
Google Map
MSN Map
OSM Map
General Map
Google Map
MSN Map
OSM Map
General Map
Google Map
MSN Map
Please wait while loading the map...
Real estate property taxes paid for housing units in 2022:
This zip code:
0.6% ($5,835)
Tennessee:
0.5% ($1,376)
Median real estate property taxes paid for housing units with mortgages in 2022: $6,091 (0.6%) Median real estate property taxes paid for housing units with no mortgage in 2022: $5,406 (0.6%)
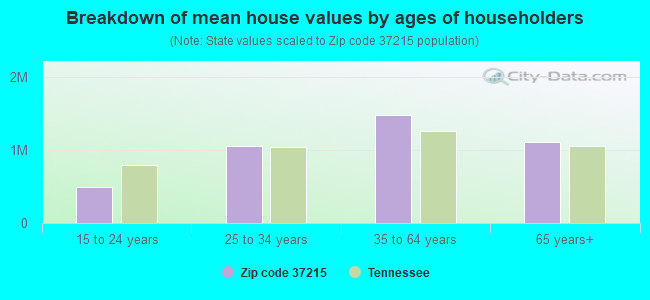
Estimated median house/condo value in 2022: $1,045,207
37215:
$1,045,207
Tennessee:
$284,800
According to our research of Tennessee and other state lists, there were 2 registered sex offenders living in 37215 zip code as of April 27, 2024. The ratio of all residents to sex offenders in zip code 37215 is 10,915 to 1. The ratio of registered sex offenders to all residents in this zip code is much lower than the state average.
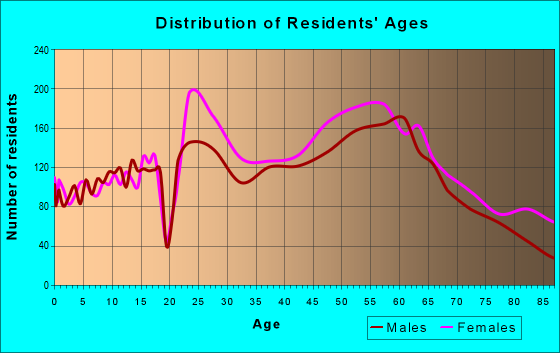
Median resident age:
This zip code:
44.1 years
Tennessee median age:
39.2 years
Average household size:
This zip code:
2.1 people
Tennessee:
2.4 people
Averages for the 2020 tax year for zip code 37215, filed in 2021:
Average Adjusted Gross Income (AGI) in 2020: $307,930 (Individual Income Tax Returns)
Here:
$307,930
State:
$69,014
Salary/wage: $189,369 (reported on 70.2% of returns)
Here:
$189,369
State:
$55,872
(% of AGI for various income ranges: 1098.0% for AGIs below $25k, 3791.2% for AGIs $25k-50k, 6284.5% for AGIs $50k-75k, 9201.5% for AGIs $75k-100k, 18452.2% for AGIs $100k-200k, 130776.1% for AGIs over 200k)
Taxable interest for individuals: $9,276 (reported on 59.5% of returns)
This zip code:
$9,276
Tennessee:
$1,945
(% of AGI for various income ranges: 45.4% for AGIs below $25k, 112.1% for AGIs $25k-50k, 155.9% for AGIs $50k-75k, 229.1% for AGIs $75k-100k, 533.2% for AGIs $100k-200k, 5834.3% for AGIs over 200k)
Ordinary dividends: $29,048 (reported on 58.9% of returns)
Here:
$29,048
State:
$8,105
(% of AGI for various income ranges: 216.6% for AGIs below $25k, 335.7% for AGIs $25k-50k, 608.9% for AGIs $50k-75k, 1074.5% for AGIs $75k-100k, 2343.7% for AGIs $100k-200k, 17126.4% for AGIs over 200k)
Net capital gain/loss in AGI: +$139,792 (reported on 55.8% of returns)
Here:
+$139,792
State:
+$33,664
(% of AGI for various income ranges: 118.7% for AGIs below $25k, 270.8% for AGIs $25k-50k, 407.6% for AGIs $50k-75k, 824.9% for AGIs $75k-100k, 2302.3% for AGIs $100k-200k, 91675.9% for AGIs over 200k)
Profit/loss from business: +$79,975 (reported on 28.9% of returns)
Here:
+$79,975
State:
+$18,991
(% of AGI for various income ranges: 236.2% for AGIs below $25k, 449.6% for AGIs $25k-50k, 538.5% for AGIs $50k-75k, 1097.4% for AGIs $75k-100k, 2957.2% for AGIs $100k-200k, 23826.8% for AGIs over 200k)
Taxable individual retirement arrangement distribution: $41,612 (reported on 14.9% of returns)
37215:
$41,612
Tennessee:
$20,036
(% of AGI for various income ranges: 102.9% for AGIs below $25k, 218.8% for AGIs $25k-50k, 369.1% for AGIs $50k-75k, 906.0% for AGIs $75k-100k, 1881.4% for AGIs $100k-200k, 4813.9% for AGIs over 200k)
Self-employed (Keogh) retirement plans: $37,752 (reported on 6.3% of returns)
37215:
$37,752
Tennessee:
$28,955
(% of AGI for various income ranges: 23.6% for AGIs $25k-50k, 44.7% for AGIs $75k-100k, 265.1% for AGIs $100k-200k, 2607.4% for AGIs over 200k)
Total itemized deductions: $63,070 (reported on 32.6% of returns)
Here:
$63,070
State:
$40,136
(% of AGI for various income ranges: 227.5% for AGIs below $25k, 470.7% for AGIs $25k-50k, 798.9% for AGIs $50k-75k, 1421.3% for AGIs $75k-100k, 3008.7% for AGIs $100k-200k, 20230.9% for AGIs over 200k)
Charity contributions: $35,806 (reported on 28.9% of returns)
Here:
$35,806
State:
$19,852
(% of AGI for various income ranges: 18.5% for AGIs below $25k, 46.2% for AGIs $25k-50k, 132.8% for AGIs $50k-75k, 283.6% for AGIs $75k-100k, 807.6% for AGIs $100k-200k, 11542.6% for AGIs over 200k)
Taxes paid: $8,255 (reported on 32.4% of returns)
37215:
$8,255
State:
$6,038
(% of AGI for various income ranges: 39.2% for AGIs below $25k, 77.9% for AGIs $25k-50k, 144.9% for AGIs $50k-75k, 258.7% for AGIs $75k-100k, 617.0% for AGIs $100k-200k, 2338.6% for AGIs over 200k)
Earned income credit: $1,000 (reported on 3.2% of returns)
Here:
$1,000
State:
$2,391
(% of AGI for various income ranges: 22.4% for AGIs below $25k, 10.9% for AGIs $25k-50k)
Percentage of individuals using paid preparers for their 2020 taxes: 92.8%
Here:
93%
State:
93%
(% for various income ranges: 90.4% for AGIs below $25k, 91.3% for AGIs $25k-50k, 93.4% for AGIs $50k-75k, 92.2% for AGIs $75k-100k, 92.4% for AGIs $100k-200k, 95.0% for AGIs over 200k)
Averages for the 2012 tax year for zip code 37215, filed in 2013:
Average Adjusted Gross Income (AGI) in 2012: $218,331 (Individual Income Tax Returns)
Here:
$218,331
State:
$53,767
Salary/wage: $134,957 (reported on 72.1% of returns)
Here:
$134,957
State:
$45,421
(% of AGI for various income ranges: 63.2% for AGIs below $25k, 69.1% for AGIs $25k-50k, 60.4% for AGIs $50k-75k, 57.3% for AGIs $75k-100k, 57.5% for AGIs $100k-200k, 40.5% for AGIs over 200k)
Taxable interest for individuals: $6,055 (reported on 56.9% of returns)
This zip code:
$6,055
Tennessee:
$1,732
(% of AGI for various income ranges: 2.9% for AGIs below $25k, 1.7% for AGIs $25k-50k, 2.3% for AGIs $50k-75k, 2.1% for AGIs $75k-100k, 1.5% for AGIs $100k-200k, 1.5% for AGIs over 200k)
Ordinary dividends: $34,825 (reported on 52.1% of returns)
Here:
$34,825
State:
$6,739
(% of AGI for various income ranges: 10.7% for AGIs below $25k, 5.3% for AGIs $25k-50k, 5.8% for AGIs $50k-75k, 6.4% for AGIs $75k-100k, 5.7% for AGIs $100k-200k, 8.9% for AGIs over 200k)
Net capital gain/loss in AGI: +$90,651 (reported on 47.3% of returns)
Here:
+$90,651
State:
+$19,082
(% of AGI for various income ranges: 1.6% for AGIs below $25k, 1.6% for AGIs $25k-50k, 1.6% for AGIs $50k-75k, 2.9% for AGIs $75k-100k, 4.0% for AGIs $100k-200k, 24.1% for AGIs over 200k)
Profit/loss from business: +$53,445 (reported on 27.4% of returns)
Here:
+$53,445
State:
+$15,240
(% of AGI for various income ranges: 10.8% for AGIs below $25k, 7.3% for AGIs $25k-50k, 7.8% for AGIs $50k-75k, 7.8% for AGIs $75k-100k, 10.4% for AGIs $100k-200k, 6.0% for AGIs over 200k)
Taxable individual retirement arrangement distribution: $34,394 (reported on 17.4% of returns)
37215:
$34,394
Tennessee:
$15,505
(% of AGI for various income ranges: 4.1% for AGIs below $25k, 3.0% for AGIs $25k-50k, 4.1% for AGIs $50k-75k, 6.1% for AGIs $75k-100k, 5.3% for AGIs $100k-200k, 2.2% for AGIs over 200k)
Self-employment retirement plans: $25,957 (reported on 5.6% of returns)
37215:
$25,957
Tennessee:
$22,567
(% of AGI for various income ranges: 0.5% for AGIs $25k-50k, 0.5% for AGIs $75k-100k, 0.8% for AGIs $100k-200k, 0.7% for AGIs over 200k)
Total itemized deductions: $42,335 (11% of AGI, reported on 53.3% of returns)
Here:
$42,335
State:
$21,976
Here:
11.4% of AGI
State:
17.8% of AGI
(% of AGI for various income ranges: 25.9% for AGIs below $25k, 17.5% for AGIs $25k-50k, 17.8% for AGIs $50k-75k, 19.4% for AGIs $75k-100k, 15.8% for AGIs $100k-200k, 8.4% for AGIs over 200k)
Charity contributions: $14,749 (reported on 48.0% of returns)
Here:
$14,749
State:
$6,709
(% of AGI for various income ranges: 2.2% for AGIs below $25k, 1.9% for AGIs $25k-50k, 2.6% for AGIs $50k-75k, 3.3% for AGIs $75k-100k, 3.4% for AGIs $100k-200k, 3.3% for AGIs over 200k)
Taxes paid: $10,985 (reported on 52.9% of returns)
37215:
$10,985
State:
$4,829
(% of AGI for various income ranges: 5.3% for AGIs below $25k, 3.6% for AGIs $25k-50k, 4.8% for AGIs $50k-75k, 4.8% for AGIs $75k-100k, 4.8% for AGIs $100k-200k, 2.1% for AGIs over 200k)
Earned income credit: $972 (reported on 4.4% of returns)
Here:
$972
State:
$2,404
(% of AGI for various income ranges: 1.2% for AGIs below $25k, 0.1% for AGIs $25k-50k)
Percentage of individuals using paid preparers for their 2012 taxes: 60.9%
Here:
61%
State:
52%
(% for various income ranges: 50.6% for AGIs below $25k, 46.7% for AGIs $25k-50k, 55.6% for AGIs $50k-75k, 61.5% for AGIs $75k-100k, 67.2% for AGIs $100k-200k, 82.6% for AGIs over 200k)
Averages for the 2004 tax year for zip code 37215, filed in 2005:
Average Adjusted Gross Income (AGI) in 2004: $142,315 (Individual Income Tax Returns)
Here:
$142,315
State:
$44,088
Salary/wage: $105,957 (reported on 70.2% of returns)
Here:
$105,957
State:
$38,825
(% of AGI for various income ranges: 61.2% for AGIs $10k-25k, 68.8% for AGIs $25k-50k, 61.3% for AGIs $50k-75k, 58.6% for AGIs $75k-100k, 49.5% for AGIs over 100k)
Taxable interest for individuals: $5,571 (reported on 66.1% of returns)
This zip code:
$5,571
Tennessee:
$1,802
(% of AGI for various income ranges: 5.6% for AGIs $10k-25k, 3.7% for AGIs $25k-50k, 3.5% for AGIs $50k-75k, 3.5% for AGIs $75k-100k, 2.2% for AGIs over 100k)
Taxable dividends: $11,505 (reported on 58.3% of returns)
Here:
$11,505
State:
$3,727
(% of AGI for various income ranges: 7.2% for AGIs $10k-25k, 4.5% for AGIs $25k-50k, 5.2% for AGIs $50k-75k, 5.1% for AGIs $75k-100k, 4.5% for AGIs over 100k)
Net capital gain/loss: +$53,612 (reported on 52.5% of returns)
Here:
+$53,612
State:
+$15,776
(% of AGI for various income ranges: 3.1% for AGIs $10k-25k, 2.2% for AGIs $25k-50k, 2.9% for AGIs $50k-75k, 4.8% for AGIs $75k-100k, 22.8% for AGIs over 100k)
Profit/loss from business: +$35,884 (reported on 25.7% of returns)
Here:
+$35,884
State:
+$12,882
(% of AGI for various income ranges: 8.2% for AGIs $10k-25k, 6.6% for AGIs $25k-50k, 6.7% for AGIs $50k-75k, 8.9% for AGIs $75k-100k, 6.4% for AGIs over 100k)
IRA payment deduction: $3,455 (reported on 2.9% of returns)
37215:
$3,455
Tennessee:
$2,934
(% of AGI for various income ranges: 0.3% for AGIs $10k-25k, 0.3% for AGIs $25k-50k, 0.2% for AGIs $50k-75k, 0.1% for AGIs $75k-100k, 0.0% for AGIs over 100k)
Self-employed pension: $20,648 (reported on 6.2% of returns)
Here:
$20,648
Tennessee:
$16,857
(% of AGI for various income ranges: 0.2% for AGIs $10k-25k, 0.3% for AGIs $25k-50k, 0.5% for AGIs $50k-75k, 0.6% for AGIs $75k-100k, 1.0% for AGIs over 100k)
Total itemized deductions: $30,851 (13% of AGI, reported on 52.0% of returns)
Here:
$30,851
State:
$18,035
Here:
13.3% of AGI
State:
19.9% of AGI
(% of AGI for various income ranges: 19.9% for AGIs $10k-25k, 16.2% for AGIs $25k-50k, 18.9% for AGIs $50k-75k, 18.4% for AGIs $75k-100k, 9.8% for AGIs over 100k)
Charity contributions deductions: $13,134 (5% of AGI, reported on 47.6% of returns)
Here:
$13,134
State:
$5,167
Here:
5.3% of AGI
State:
5.3% of AGI
(% of AGI for various income ranges: 2.0% for AGIs $10k-25k, 2.4% for AGIs $25k-50k, 3.3% for AGIs $50k-75k, 3.8% for AGIs $75k-100k, 4.6% for AGIs over 100k)
Total tax: $35,060 (reported on 85.4% of returns)
37215:
$35,060
State:
$7,482
(% of AGI for various income ranges: 6.0% for AGIs $10k-25k, 9.2% for AGIs $25k-50k, 11.9% for AGIs $50k-75k, 12.8% for AGIs $75k-100k, 22.9% for AGIs over 100k)
Earned income credit: $822 (reported on 3.3% of returns)
Here:
$822
State:
$1,826
Percentage of individuals using paid preparers for their 2004 taxes: 62.4%
Here:
62%
State:
60%
(% for various income ranges: 60.2% for AGIs below $10k, 52.6% for AGIs $10k-25k, 51.1% for AGIs $25k-50k, 60.0% for AGIs $50k-75k, 63.2% for AGIs $75k-100k, 75.7% for AGIs over 100k)
Likely homosexual households (counted as self-reported same-sex unmarried-partner households)
Lesbian couples: 0.1% of all households
Gay men: 0.9% of all households
Household received Food Stamps/SNAP in the past 12 months: 93 Household did not receive Food Stamps/SNAP in the past 12 months: 10,730
Women who had a birth in the past 12 months: 304 (310 now married, 0 unmarried) Women who did not have a birth in the past 12 months: 5,174 (2,092 now married, 3,081 unmarried)
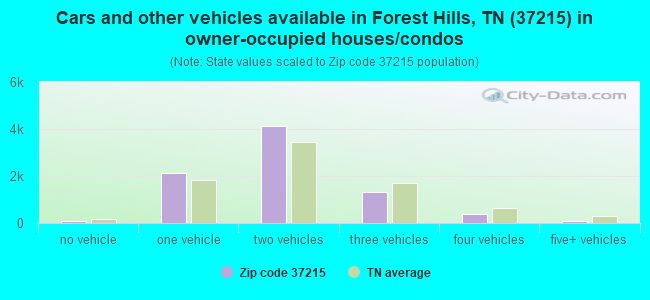
Housing units in zip code 37215 with a mortgage: 4,889 (622 second mortgage, 576 both second mortgage and home equity loan) Houses without a mortgage: 135
Median monthly owner costs for units with a mortgage: $3,491 Median monthly owner costs for units without a mortgage: $1,012
Residents with income below the poverty level in 2022:
This zip code:
5.8%
Whole state:
13.3%
Residents with income below 50% of the poverty level in 2022:
This zip code:
1.4%
Whole state:
7.1%
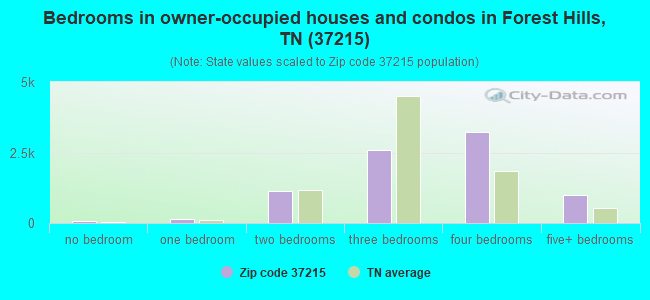
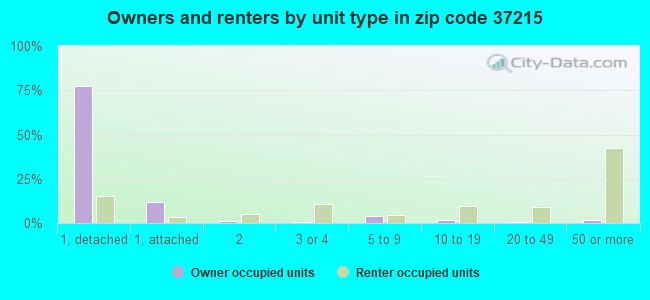
Median number of rooms in houses and condos:
Here:
8.2
State:
6.5
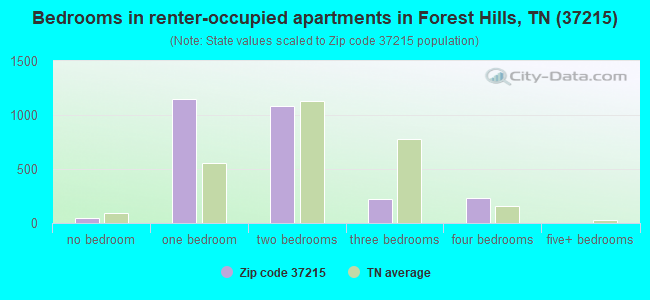
Median number of rooms in apartments:
Here:
3.7
State:
4.4
Notable locations in this zip code not listed on our city pages
Notable locations in zip code 37215: Baptist Center For Ethics (A), Woodmont Christian Day Care Center (B), Nashville Fire Department Station 20 (C), Green Hills Branch Nashville and Davidson Public Library (D). Display/hide their locations on the map
Shopping Centers: Graces Plaza Shopping Center (1), H G Hill Shopping Center (2), The Glendale Shopping Center (3), Village Green Shopping Center (4), Village Mall Shopping Center (5), Hillsboro Plaza Shopping Center (6), Hillsboro Corner Shopping Center (7), Green Hills Mall Shopping Center (8), Green Hills Court Shopping Center (9). Display/hide their locations on the map
Churches in zip code 37215 include: Saint Bartholomews Church (A), Saint Pauls Church (B), Hillsboro Church (C), Forest Hills Church (D), First Unitarian Universalist Church (E), First Unity Church (F), Trinity Church (G), Woodmont Church (H), Woodmont Bible Church (I). Display/hide their locations on the map
3,337 married couples with children.
655 single-parent households (33 men, 622 women).
91.2% of residents of 37215 zip code speak English at home.
1.6% of residents speak Spanish at home (81% very well, 19% well).
3.2% of residents speak other Indo-European language at home (92% very well, 3% well, 6% not at all).
4.1% of residents speak Asian or Pacific Island language at home (49% very well, 49% well, 2% not at all).
0.2% of residents speak other language at home (100% very well).
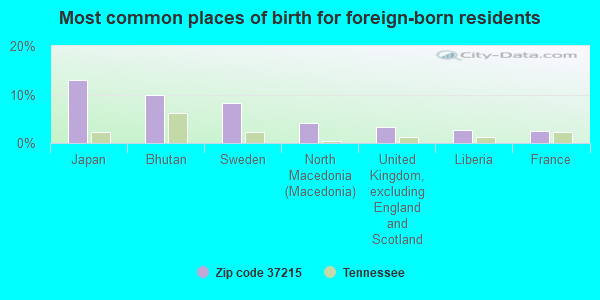
Foreign born population: 2,106 (9.2%) (58.2% of them are naturalized citizens)
This zip code:
9.2%
Whole state:
5.6%
13%Japan
10%Bhutan
8%Sweden
4%North Macedonia (Macedonia)
3%United Kingdom, excluding England and Scotland
3%Liberia
2%France
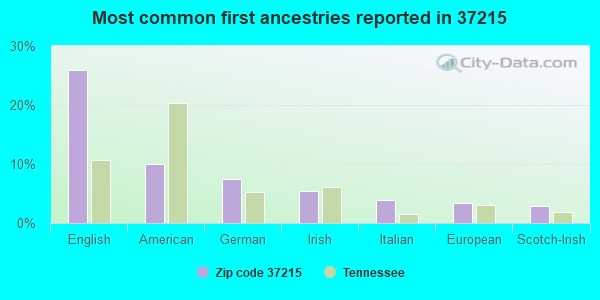
26%English
10%American
7%German
5%Irish
4%Italian
3%European
3%Scotch-Irish
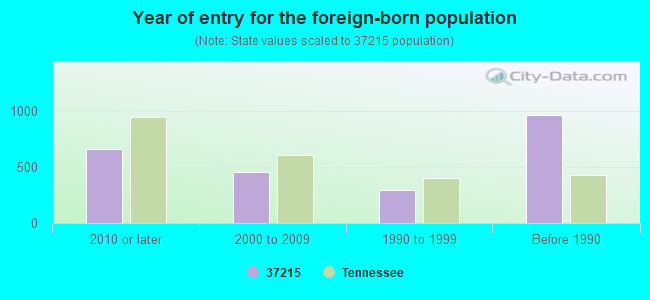
Year of entry for the foreign-born population
6612010 or later
4582000 to 2009
2981990 to 1999
967Before 1990
Facilities with environmental interests located in this zip code:
ACE TERMITE & PEST CONTROL (4004 HILLSBORO RD in NASHVILLE, TN)
(Resource Conservation and Recovery Act (tracking hazardous waste))
ATHLON PUBLICATIONS INC (3818 CLEGHORN AVE in NASHVILLE, TN)
(Resource Conservation and Recovery Act (tracking hazardous waste))
CHRISTIAN CHRONICLE INC THE (1621 GRAYBAR LANE in NASHVILLE, TN)
(Resource Conservation and Recovery Act (tracking hazardous waste))
CLASSIQUE CLEANERS (3900 HILLSBORO ROAD in NASHVILLE, TN)
(Resource Conservation and Recovery Act (tracking hazardous waste))
COMPUTER COMPOSITION INC (2103 CRESTMOOR in NASHVILLE, TN)
(Resource Conservation and Recovery Act (tracking hazardous waste)) Business NAICS classification: PREPRESS SERVICES.
CONCORD CUSTOM CLEANERS #090 (3706 HILLSBORO in NASHVILLE, TN)
(Resource Conservation and Recovery Act (tracking hazardous waste))
D. D. W., INC. (BOX 15808; 3716 HILLSBORO RD in NASHVILLE, TN)
(Resource Conservation and Recovery Act (tracking hazardous waste))
DIA CLIN LABORATORIES INC (2416 HILLSBORO RD in NASHVILLE, TN)
(Resource Conservation and Recovery Act (tracking hazardous waste)) Business NAICS classification: MEDICAL LABORATORIES.
DRY CLEAN USA #507 (3801 HILLSBORO RD in NASHVILLE, TN)
Small Quantity Generators, between 100 kg and 1000 kg of hazardous waste/month (Resource Conservation and Recovery Act (tracking hazardous waste)) - notification
Housing units lacking complete plumbing facilities: 2.1% Housing units lacking complete kitchen facilities: 2.2%
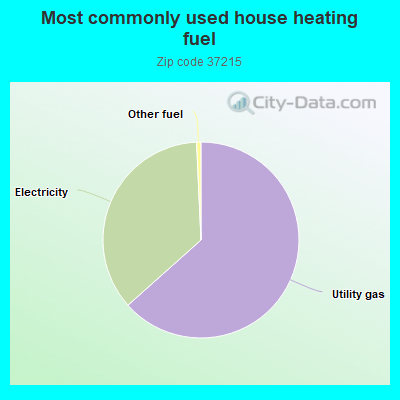
62.9%Utility gas
35.6%Electricity
0.7%Other fuel
Population in 1990: 20,452. Population change in the 1990s: +1,660 (+8.1%).
Place of birth for U.S.-born residents:
This state: 8,962
Northeast: 2,095
Midwest: 2,823
South: 5,460
West: 1,141
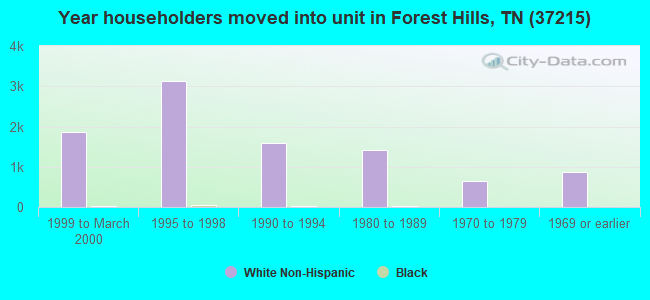
52% of the 37215 zip code residents lived in the same house 5 years ago. Out of people who lived in different houses, 51% lived in this county. Out of people who lived in different counties, 50% lived in Tennessee.
86% of the 37215 zip code residents lived in the same house 1 year ago. Out of people who lived in different houses, 49% moved from this county. Out of people who lived in different houses, 15% moved from different county within same state. Out of people who lived in different houses, 26% moved from different state. Out of people who lived in different houses, 9% moved from abroad.
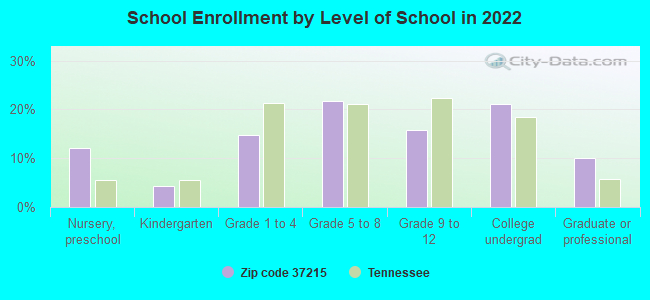
Private vs. public school enrollment:
Students in private schools in grades 1 to 8 (elementary and middle school): 1,311
Here:
70.4%
Tennessee:
15.0%
Students in private schools in grades 9 to 12 (high school): 560
Here:
70.6%
Tennessee:
16.2%
Students in private undergraduate colleges: 754
Here:
73.2%
Tennessee:
23.5%
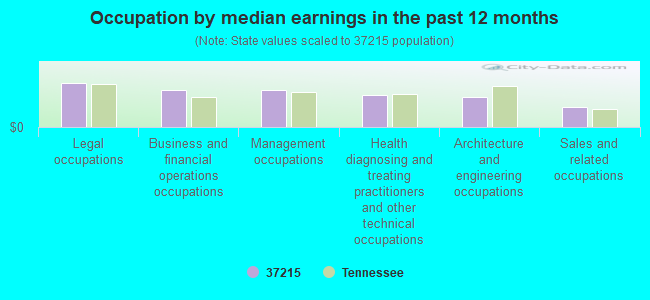
Occupation by median earnings in the past 12 months ($)
153,858Legal occupations
129,659Business and financial operations occupations
128,358Management occupations
111,552Health diagnosing and treating practitioners and other technical occupations
105,530Architecture and engineering occupations
69,907Sales and related occupations
Companies with federal contracts located in this zip code:
DIGITAL REASONING SYSTEMS, INC (2000 GLEN ECHO ROAD in NASHVILLE, TN; small business) : $5,024,109 in 5 contractsfrom 2004 to 2006
Contracts for Engineering and Technical Services, ADP Software by Army Signed by year:2000: $0; 2001: $0; 2002: $0; 2003: $0; 2004: $62,588; 2005: $2,011,521; 2006: $2,950,000.
Biggest contracts:
$2,950,000 with Army for Engineering and Technical Services. Signed on 2006-05-25. Completion date: 2007-05-21.
$1,162,650, same as above.Signed on 2005-04-15. Completion date: 2006-03-13.
$799,971, same as above.Signed on 2005-09-29. Completion date: 2006-03-13.
$62,588 with Army for ADP Software. Signed on 2004-09-30. Completion date: 2005-09-29.
CUSTOM CORPORATES, INC (2400 CRESTMORE DR STE 204 in NASHVILLE, TN; small business) : $865,456 in 4 contractsfrom 2003 to 2004
$371,232 with Army for Lodging - Hotel/Motel. Signed on 2003-12-17. Completion date: 2004-01-01.
$279,360 with Army for Lease or Rental of Facilities -- Troop Housing Facilities. Signed on 2003-02-28. Completion date: 2003-12-27.
$237,600, same as above.Signed on 2003-02-28. Completion date: 2003-12-28.
-$22,736 with Army for Lodging - Hotel/Motel. Signed on 2004-12-01. Completion date: 2004-01-01.
KATHRYN HUDDLESTON & ASSOCIATE (18 REDBUD DRIVE in NASHVILLE, TN) : $141,173 in 5 contractsfrom 2000 to 2005
Contracts for Education Services, Training/Curriculum Development, Architect - Engineer Services (including landscaping, interior layout, and designing) by Army, U.S. Army Corps of Engineers - civil program financing only Signed by year:2000: $72,900; 2001: $62,975; 2002: $0; 2003: $0; 2004: $0; 2005: $5,298; 2006: $0.
Biggest contracts:
$70,400 with Army for Education Services. Signed on 2000-04-18. Completion date: 2000-07-30.
$62,975 with U.S. Army Corps of Engineers - civil program financing only for Education Services. Taking place in AL. Signed on 2001-07-10. Completion date: 2001-08-17.
$2,649 with Army for Training/Curriculum Development. Taking place in CA. Signed on 2005-03-17. Completion date: 2005-03-31.
$2,649 with U.S. Army Corps of Engineers - civil program financing only for Training/Curriculum Development. Taking place in CA. Signed on 2005-03-17. Completion date: 2005-03-31.
BBX TECHNOLOGIES, INC (20 BURTON HILLS BLVD # 210 in NASHVILLE, TN; small business) : $84,094 in 2 contractsfrom 2004 to 2005
$72,815 with Minerals Management Service for ADP Software. Taking place in CA. Signed on 2004-02-02. Completion date: 2004-03-01.
$11,279 with Air Force for Data Collection Services. Signed on 2005-08-16. Completion date: 2005-08-16.
LIFELINE MEDICAL SERVICES,INC (2021 RICHARD JONES RD in NASHVILLE, TN; small business) : $21,041 in 2 contractsin 2005
$17,085 with Army for Medical and Surgical Instruments, Equipment, and Supplies. Signed on 2005-03-02. Completion date: 2005-07-15.
$3,956, same as above.Signed on 2005-09-28. Completion date: 2005-10-07.
AEGIS MARKETING GROUP, INC (1 BURTON HILLS BLVD STE 20 in NASHVILLE, TN) : $19,335 in 9 contractsfrom 2003 to 2006
Contracts for Other Special Studies and Analyses, Evaluation and Screening by U.S. Army Corps of Engineers - civil program financing only, Army Signed by year:2000: $0; 2001: $0; 2002: $0; 2003: $8,000; 2004: $9,966; 2005: $0; 2006: $1,369.
Biggest contracts:
$8,000 with U.S. Army Corps of Engineers - civil program financing only for Other Special Studies and Analyses. Taking place in LA. Signed on 2003-01-02. Completion date: 2002-10-15.
$5,020 with Army for Evaluation and Screening. Signed on 2004-11-30. Completion date: 2004-01-02.
$5,020 with U.S. Army Corps of Engineers - civil program financing only for Evaluation and Screening. Signed on 2004-11-30. Completion date: 2004-01-02.
$4,875, same as above.Signed on 2004-01-08. Completion date: 2004-01-02.
PRIME OFFICE PRODUCTS, INC (3841 GREEN HILLS VILLAGE in NASHVILLE, TN; small business) : $11,688 in 8 contractsfrom 2005 to 2006
Contracts for Office Furniture, Office Supplies, Miscellaneous Items by Air Force, Department of Defense, Federal Election Commission Signed by year:2000: $0; 2001: $0; 2002: $0; 2003: $0; 2004: $0; 2005: $6,720; 2006: $4,968.
Biggest contracts:
$8,178 with Air Force for Office Furniture. Taking place in AL. Signed on 2005-08-17. Completion date: 2005-09-16.
$6,720 with Department of Defense for Office Supplies. Signed on 2005-08-29. Completion date: 2005-09-14.
$2,139 with Federal Election Commission for Miscellaneous Items. Taking place in DC. Signed on 2006-09-27. Completion date: 2006-10-04.
$1,595, same as above.Signed on 2006-05-15. Completion date: 2006-05-19.
richard s. stein (4914 lynmont Drive in Nashville, tn; small business) : $7,000 in 2 contractsfrom 2004 to 2005
$40,000 with Offices, Boards and Divisions (includes Attorney General, Deputy Attorney General, etc.) for Legal Services. Signed on 2004-09-22. Completion date: 2005-09-22.
-$33,000, same as above.Signed on 2005-09-09. Completion date: 2005-09-09.
DAVIS, DAVID (203 SHIEFFIELD PLACE in NASHVILLE, TN; small business) : $3,550 in 2 contractsin 2003
$2,750 with Army for Chaplain Services. Taking place in KY. Signed on 2003-07-01. Completion date: 2003-09-28.
$800, same as above.Signed on 2003-03-28. Completion date: 2003-09-28.
Top industries in this zip code by the number of employees in 2005:
Health Care and Social Assistance: Offices of Physicians (except Mental Health Specialists) (500-999: 1, 250-499: 1, 100-249: 2, 20-49: 5, 10-19: 6, 5-9: 6, 1-4: 17)
2003 - 2018 National Fire Incident Reporting System (NFIRS) incidents
Based on the data from the years 2003 - 2018 the average number of fires per year is 28. The highest number of reported fires - 56 took place in 2006, and the least - 6 in 2004. The data has a growing trend.
When looking into fire subcategories, the most reports belonged to: Outside Fires (39.2%), and Structure Fires (36.1%).
Fire incident types reported to NFIRS in Zip Code 37215


 Nearest zip codes: 37220, 37205, 37212, 37204, 37240, 37203.
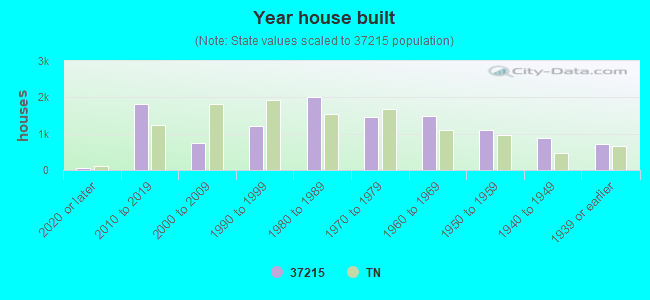


 Based on the data from the years 2003 - 2018 the average number of fires per year is 28. The highest number of reported fires - 56 took place in 2006, and the least - 6 in 2004. The data has a growing trend.
 When looking into fire subcategories, the most reports belonged to: Outside Fires (39.2%), and Structure Fires (36.1%).