Estimated zip code population in 2022: 26,184 Zip code population in 2010: 24,057 Zip code population in 2000: 21,861
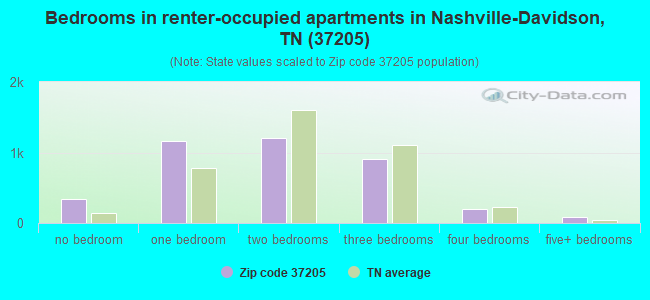
Houses and condos: 13,181 Renter-occupied apartments: 3,888
% of renters here:
31%
State:
33%
March 2022 cost of living index in zip code 37205: 94.1 (less than average, U.S. average is 100)
Land area: 14.5 sq. mi. Water area: 0.0 sq. mi.
Population density: 1,802 people per square mile
(low).
OSM Map
General Map
Google Map
MSN Map
OSM Map
General Map
Google Map
MSN Map
OSM Map
General Map
Google Map
MSN Map
OSM Map
General Map
Google Map
MSN Map
Please wait while loading the map...
Real estate property taxes paid for housing units in 2022:
This zip code:
0.6% ($5,587)
Tennessee:
0.5% ($1,376)
Median real estate property taxes paid for housing units with mortgages in 2022: $5,655 (0.5%) Median real estate property taxes paid for housing units with no mortgage in 2022: $5,527 (0.6%)
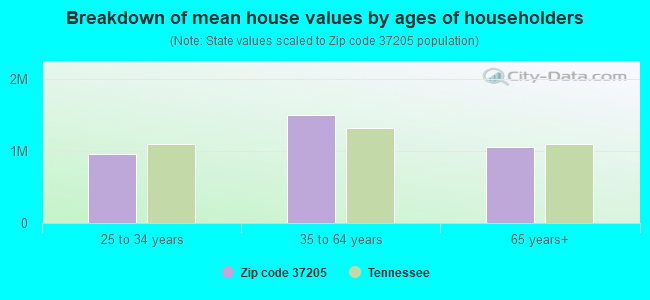
Estimated median house/condo value in 2022: $1,008,518
37205:
$1,008,518
Tennessee:
$284,800
According to our research of Tennessee and other state lists, there were 3 registered sex offenders living in 37205 zip code as of April 26, 2024. The ratio of all residents to sex offenders in zip code 37205 is 8,356 to 1. The ratio of registered sex offenders to all residents in this zip code is much lower than the state average.
Median resident age:
This zip code:
49.2 years
Tennessee median age:
39.2 years
Average household size:
This zip code:
2.1 people
Tennessee:
2.4 people
Averages for the 2020 tax year for zip code 37205, filed in 2021:
Average Adjusted Gross Income (AGI) in 2020: $310,530 (Individual Income Tax Returns)
Here:
$310,530
State:
$69,014
Salary/wage: $195,561 (reported on 68.6% of returns)
Here:
$195,561
State:
$55,872
(% of AGI for various income ranges: 1066.9% for AGIs below $25k, 3760.4% for AGIs $25k-50k, 6446.0% for AGIs $50k-75k, 8949.0% for AGIs $75k-100k, 16615.7% for AGIs $100k-200k, 166692.1% for AGIs over 200k)
Taxable interest for individuals: $10,361 (reported on 57.7% of returns)
This zip code:
$10,361
Tennessee:
$1,945
(% of AGI for various income ranges: 60.7% for AGIs below $25k, 79.1% for AGIs $25k-50k, 154.0% for AGIs $50k-75k, 263.5% for AGIs $75k-100k, 464.3% for AGIs $100k-200k, 8108.2% for AGIs over 200k)
Ordinary dividends: $33,570 (reported on 56.0% of returns)
Here:
$33,570
State:
$8,105
(% of AGI for various income ranges: 205.1% for AGIs below $25k, 286.6% for AGIs $25k-50k, 522.3% for AGIs $50k-75k, 982.0% for AGIs $75k-100k, 2184.0% for AGIs $100k-200k, 24354.3% for AGIs over 200k)
Net capital gain/loss in AGI: +$153,488 (reported on 51.9% of returns)
Here:
+$153,488
State:
+$33,664
(% of AGI for various income ranges: 153.4% for AGIs below $25k, 191.4% for AGIs $25k-50k, 423.5% for AGIs $50k-75k, 845.9% for AGIs $75k-100k, 1958.5% for AGIs $100k-200k, 119001.6% for AGIs over 200k)
Profit/loss from business: +$57,706 (reported on 26.9% of returns)
Here:
+$57,706
State:
+$18,991
(% of AGI for various income ranges: 244.4% for AGIs below $25k, 479.0% for AGIs $25k-50k, 664.4% for AGIs $50k-75k, 1035.1% for AGIs $75k-100k, 2481.6% for AGIs $100k-200k, 18360.5% for AGIs over 200k)
Taxable individual retirement arrangement distribution: $38,660 (reported on 14.6% of returns)
37205:
$38,660
Tennessee:
$20,036
(% of AGI for various income ranges: 107.4% for AGIs below $25k, 194.3% for AGIs $25k-50k, 387.8% for AGIs $50k-75k, 921.2% for AGIs $75k-100k, 1830.5% for AGIs $100k-200k, 4972.3% for AGIs over 200k)
Self-employed (Keogh) retirement plans: $34,336 (reported on 5.7% of returns)
37205:
$34,336
Tennessee:
$28,955
(% of AGI for various income ranges: 58.6% for AGIs $50k-75k, 160.3% for AGIs $100k-200k, 2748.5% for AGIs over 200k)
Total itemized deductions: $71,241 (reported on 28.4% of returns)
Here:
$71,241
State:
$40,136
(% of AGI for various income ranges: 256.6% for AGIs below $25k, 372.3% for AGIs $25k-50k, 627.7% for AGIs $50k-75k, 1448.2% for AGIs $75k-100k, 2494.2% for AGIs $100k-200k, 25517.6% for AGIs over 200k)
Charity contributions: $42,538 (reported on 25.4% of returns)
Here:
$42,538
State:
$19,852
(% of AGI for various income ranges: 13.6% for AGIs below $25k, 41.6% for AGIs $25k-50k, 73.7% for AGIs $50k-75k, 235.5% for AGIs $75k-100k, 553.7% for AGIs $100k-200k, 15648.2% for AGIs over 200k)
Taxes paid: $8,157 (reported on 28.1% of returns)
37205:
$8,157
State:
$6,038
(% of AGI for various income ranges: 39.4% for AGIs below $25k, 59.0% for AGIs $25k-50k, 99.9% for AGIs $50k-75k, 231.6% for AGIs $75k-100k, 505.5% for AGIs $100k-200k, 2504.1% for AGIs over 200k)
Earned income credit: $1,180 (reported on 4.0% of returns)
Here:
$1,180
State:
$2,391
(% of AGI for various income ranges: 31.0% for AGIs below $25k, 15.7% for AGIs $25k-50k)
Percentage of individuals using paid preparers for their 2020 taxes: 92.7%
Here:
93%
State:
93%
(% for various income ranges: 90.3% for AGIs below $25k, 92.1% for AGIs $25k-50k, 92.8% for AGIs $50k-75k, 92.9% for AGIs $75k-100k, 92.6% for AGIs $100k-200k, 94.6% for AGIs over 200k)
Averages for the 2012 tax year for zip code 37205, filed in 2013:
Average Adjusted Gross Income (AGI) in 2012: $203,658 (Individual Income Tax Returns)
Here:
$203,658
State:
$53,767
Salary/wage: $138,612 (reported on 70.8% of returns)
Here:
$138,612
State:
$45,421
(% of AGI for various income ranges: 60.3% for AGIs below $25k, 67.8% for AGIs $25k-50k, 62.8% for AGIs $50k-75k, 59.3% for AGIs $75k-100k, 58.8% for AGIs $100k-200k, 44.3% for AGIs over 200k)
Taxable interest for individuals: $7,459 (reported on 56.3% of returns)
This zip code:
$7,459
Tennessee:
$1,732
(% of AGI for various income ranges: 2.9% for AGIs below $25k, 1.8% for AGIs $25k-50k, 2.0% for AGIs $50k-75k, 1.7% for AGIs $75k-100k, 1.6% for AGIs $100k-200k, 2.1% for AGIs over 200k)
Ordinary dividends: $27,876 (reported on 51.5% of returns)
Here:
$27,876
State:
$6,739
(% of AGI for various income ranges: 10.5% for AGIs below $25k, 4.9% for AGIs $25k-50k, 5.7% for AGIs $50k-75k, 5.4% for AGIs $75k-100k, 5.9% for AGIs $100k-200k, 7.4% for AGIs over 200k)
Net capital gain/loss in AGI: +$70,151 (reported on 45.5% of returns)
Here:
+$70,151
State:
+$19,082
(% of AGI for various income ranges: 1.4% for AGIs below $25k, 1.5% for AGIs $25k-50k, 3.1% for AGIs $50k-75k, 2.8% for AGIs $75k-100k, 3.8% for AGIs $100k-200k, 19.6% for AGIs over 200k)
Profit/loss from business: +$48,209 (reported on 25.8% of returns)
Here:
+$48,209
State:
+$15,240
(% of AGI for various income ranges: 10.9% for AGIs below $25k, 6.3% for AGIs $25k-50k, 7.4% for AGIs $50k-75k, 7.1% for AGIs $75k-100k, 8.5% for AGIs $100k-200k, 5.5% for AGIs over 200k)
Taxable individual retirement arrangement distribution: $35,405 (reported on 16.9% of returns)
37205:
$35,405
Tennessee:
$15,505
(% of AGI for various income ranges: 4.9% for AGIs below $25k, 3.7% for AGIs $25k-50k, 3.9% for AGIs $50k-75k, 5.3% for AGIs $75k-100k, 5.4% for AGIs $100k-200k, 2.3% for AGIs over 200k)
Self-employment retirement plans: $26,273 (reported on 4.7% of returns)
37205:
$26,273
Tennessee:
$22,567
(% of AGI for various income ranges: 0.3% for AGIs $50k-75k, 0.3% for AGIs $75k-100k, 0.6% for AGIs $100k-200k, 0.7% for AGIs over 200k)
Total itemized deductions: $41,642 (12% of AGI, reported on 51.4% of returns)
Here:
$41,642
State:
$21,976
Here:
11.8% of AGI
State:
17.8% of AGI
(% of AGI for various income ranges: 23.8% for AGIs below $25k, 15.1% for AGIs $25k-50k, 16.3% for AGIs $50k-75k, 16.5% for AGIs $75k-100k, 15.7% for AGIs $100k-200k, 8.7% for AGIs over 200k)
Charity contributions: $14,381 (reported on 45.8% of returns)
Here:
$14,381
State:
$6,709
(% of AGI for various income ranges: 1.9% for AGIs below $25k, 1.7% for AGIs $25k-50k, 2.3% for AGIs $50k-75k, 2.7% for AGIs $75k-100k, 3.1% for AGIs $100k-200k, 3.4% for AGIs over 200k)
Taxes paid: $11,367 (reported on 51.1% of returns)
37205:
$11,367
State:
$4,829
(% of AGI for various income ranges: 5.3% for AGIs below $25k, 3.7% for AGIs $25k-50k, 4.1% for AGIs $50k-75k, 4.3% for AGIs $75k-100k, 4.7% for AGIs $100k-200k, 2.4% for AGIs over 200k)
Earned income credit: $1,226 (reported on 4.9% of returns)
Here:
$1,226
State:
$2,404
(% of AGI for various income ranges: 1.6% for AGIs below $25k, 0.2% for AGIs $25k-50k)
Percentage of individuals using paid preparers for their 2012 taxes: 60.5%
Here:
61%
State:
52%
(% for various income ranges: 50.7% for AGIs below $25k, 48.8% for AGIs $25k-50k, 56.2% for AGIs $50k-75k, 59.1% for AGIs $75k-100k, 65.6% for AGIs $100k-200k, 83.6% for AGIs over 200k)
Averages for the 2004 tax year for zip code 37205, filed in 2005:
Average Adjusted Gross Income (AGI) in 2004: $146,984 (Individual Income Tax Returns)
Here:
$146,984
State:
$44,088
Salary/wage: $108,625 (reported on 68.4% of returns)
Here:
$108,625
State:
$38,825
(% of AGI for various income ranges: 57.9% for AGIs $10k-25k, 65.0% for AGIs $25k-50k, 61.1% for AGIs $50k-75k, 62.3% for AGIs $75k-100k, 47.3% for AGIs over 100k)
Taxable interest for individuals: $6,507 (reported on 66.1% of returns)
This zip code:
$6,507
Tennessee:
$1,802
(% of AGI for various income ranges: 5.8% for AGIs $10k-25k, 3.6% for AGIs $25k-50k, 3.0% for AGIs $50k-75k, 2.6% for AGIs $75k-100k, 2.6% for AGIs over 100k)
Taxable dividends: $15,603 (reported on 57.9% of returns)
Here:
$15,603
State:
$3,727
(% of AGI for various income ranges: 7.1% for AGIs $10k-25k, 4.7% for AGIs $25k-50k, 5.5% for AGIs $50k-75k, 4.8% for AGIs $75k-100k, 6.0% for AGIs over 100k)
Net capital gain/loss: +$54,346 (reported on 51.3% of returns)
Here:
+$54,346
State:
+$15,776
(% of AGI for various income ranges: 2.9% for AGIs $10k-25k, 1.9% for AGIs $25k-50k, 3.1% for AGIs $50k-75k, 4.0% for AGIs $75k-100k, 21.6% for AGIs over 100k)
Profit/loss from business: +$37,689 (reported on 24.1% of returns)
Here:
+$37,689
State:
+$12,882
(% of AGI for various income ranges: 8.3% for AGIs $10k-25k, 5.9% for AGIs $25k-50k, 8.6% for AGIs $50k-75k, 7.0% for AGIs $75k-100k, 5.9% for AGIs over 100k)
IRA payment deduction: $3,504 (reported on 2.8% of returns)
37205:
$3,504
Tennessee:
$2,934
(% of AGI for various income ranges: 0.2% for AGIs $10k-25k, 0.3% for AGIs $25k-50k, 0.2% for AGIs $50k-75k, 0.2% for AGIs $75k-100k, 0.0% for AGIs over 100k)
Self-employed pension: $20,938 (reported on 5.3% of returns)
Here:
$20,938
Tennessee:
$16,857
(% of AGI for various income ranges: 0.2% for AGIs $10k-25k, 0.2% for AGIs $25k-50k, 0.4% for AGIs $50k-75k, 0.5% for AGIs $75k-100k, 0.8% for AGIs over 100k)
Total itemized deductions: $30,853 (13% of AGI, reported on 50.9% of returns)
Here:
$30,853
State:
$18,035
Here:
13.0% of AGI
State:
19.9% of AGI
(% of AGI for various income ranges: 21.1% for AGIs $10k-25k, 16.4% for AGIs $25k-50k, 17.6% for AGIs $50k-75k, 17.6% for AGIs $75k-100k, 9.1% for AGIs over 100k)
Charity contributions deductions: $10,745 (4% of AGI, reported on 46.4% of returns)
Here:
$10,745
State:
$5,167
Here:
4.2% of AGI
State:
5.3% of AGI
(% of AGI for various income ranges: 2.6% for AGIs $10k-25k, 2.5% for AGIs $25k-50k, 2.9% for AGIs $50k-75k, 3.4% for AGIs $75k-100k, 3.4% for AGIs over 100k)
Total tax: $37,698 (reported on 84.1% of returns)
37205:
$37,698
State:
$7,482
(% of AGI for various income ranges: 5.7% for AGIs $10k-25k, 8.8% for AGIs $25k-50k, 11.8% for AGIs $50k-75k, 12.1% for AGIs $75k-100k, 23.3% for AGIs over 100k)
Earned income credit: $970 (reported on 3.5% of returns)
Here:
$970
State:
$1,826
Percentage of individuals using paid preparers for their 2004 taxes: 63.3%
Here:
63%
State:
60%
(% for various income ranges: 60.9% for AGIs below $10k, 53.7% for AGIs $10k-25k, 53.6% for AGIs $25k-50k, 59.1% for AGIs $50k-75k, 64.0% for AGIs $75k-100k, 77.3% for AGIs over 100k)
Likely homosexual households (counted as self-reported same-sex unmarried-partner households)
Lesbian couples: 0.1% of all households
Gay men: 0.0% of all households
Household received Food Stamps/SNAP in the past 12 months: 114 Household did not receive Food Stamps/SNAP in the past 12 months: 12,497
Women who had a birth in the past 12 months: 277 (283 now married, 0 unmarried) Women who did not have a birth in the past 12 months: 4,775 (2,373 now married, 2,402 unmarried)
Housing units in zip code 37205 with a mortgage: 4,766 (1,125 second mortgage, 73 home equity loan, 1,018 both second mortgage and home equity loan) Houses without a mortgage: 92
Median monthly owner costs for units with a mortgage: $3,212 Median monthly owner costs for units without a mortgage: $1,011
Residents with income below the poverty level in 2022:
This zip code:
5.0%
Whole state:
13.3%
Residents with income below 50% of the poverty level in 2022:
This zip code:
2.4%
Whole state:
7.1%
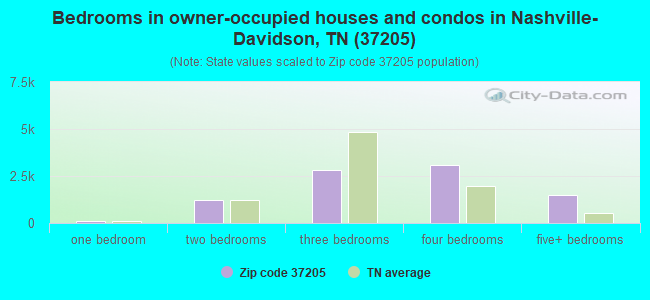
Median number of rooms in houses and condos:
Here:
8.3
State:
6.5
Median number of rooms in apartments:
Here:
4.0
State:
4.4
Notable locations in this zip code not listed on our city pages
Notable locations in zip code 37205: Richland Golf Club (A), Tennessee Botanical Gardens and Fine Arts Center (B), Hillwood Country Club (C), Belle Meade Country Club (D), Westminster Toddlers and Twos Day Care Center (E), Nashville Fire Department Station 7 (F), Nashville Fire Department Station 17 (G), Saint Marys Orphanage (H), Belle Meade Mansion (I). Display/hide their locations on the map
Shopping Centers: Lions Head Shopping Center (1), Westgate Shopping Center (2), Harper Hills Plaza Shopping Center (3), Belle Meade Shopping Center (4), Belle Meade Plaza Shopping Center (5). Display/hide their locations on the map
Churches in zip code 37205 include: Saint Davids Church (A), Horton Heights Church (B), Hillwood Church (C), The Temple (D), Christian Church in Tennessee (E), West Nashville Cumberland Presbyterian Church (F), United Missions of Maxima (G), Hermitage Community Church (H), First Baptist Church of Hermitage (I). Display/hide their locations on the map
Streams, rivers, and creeks: Jocelyn Hollow Branch (A), Belle Meade Branch (B), Vaughns Gap Branch (C), Sugartree Creek (D). Display/hide their locations on the map
Tourist attractions (not listed on the city page) : Pineapple Room at Cheekwood (Museums; 1200 Forrest Park Drive) (1), Belle Meade Plantation (Museums; 5025 Harding Rd) (2), Cheekwood-Botanical Garden & Museum of Art - Cheekwood Museum of Art (1200 Forrest Park Drive) (3), Cheekwood-Botanical Garden & Museum of Art - Cheekwood Owl's Hill Nature Ce (Nature Centers; 1200 Forrest Park Drive) (4), Collector's Gallery (Amusement & Theme Parks; 6602 Hwy 100) (5), Old Hickory Aviation (215 Brook Hollow Road) (6), Nashville Balloon Charters (215 Brook Hollow Road) (7). Display/hide their approximate locations on the map
In group quarters: 460 (-1 institutionalized population)
Size of family households: 4,066 2-persons, 1,239 3-persons, 1,208 4-persons, 568 5-persons, 49 6-persons, 4 7-or-more-persons
Size of nonfamily households: 4,352 1-person, 699 2-persons, 324 3-persons
4,090 married couples with children.
366 single-parent households (79 men, 287 women).
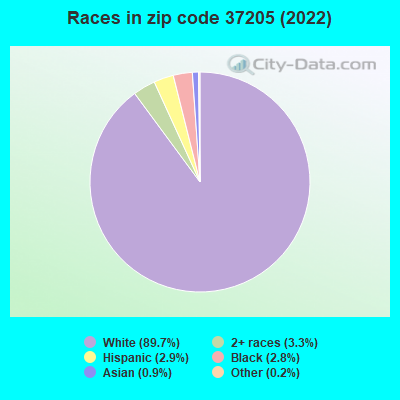
96.4% of residents of 37205 zip code speak English at home.
1.7% of residents speak Spanish at home (59% very well, 38% well, 3% not well).
1.3% of residents speak other Indo-European language at home (79% very well, 12% well, 8% not well).
0.5% of residents speak Asian or Pacific Island language at home (83% very well, 17% well).
0.4% of residents speak other language at home (100% very well).
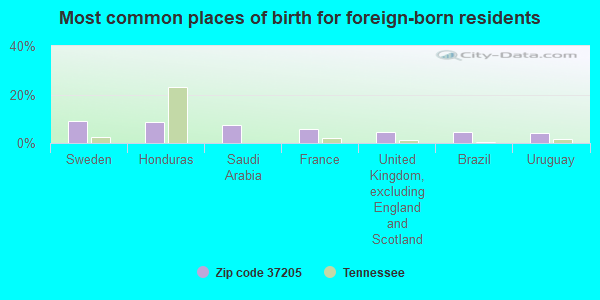
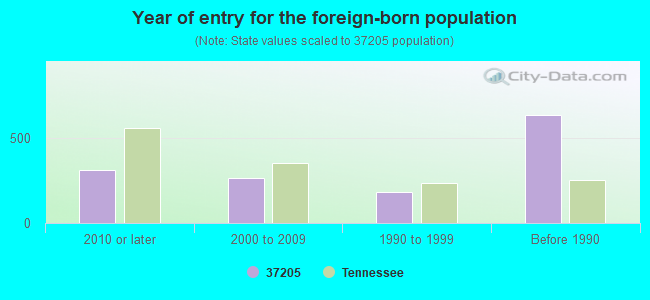
Foreign born population: 1,207 (4.6%) (60.5% of them are naturalized citizens)
(Resource Conservation and Recovery Act (tracking hazardous waste))
CONCRETE FORM ERECTORS INC (108 BROOKHOLLOW ROAD in NASHVILLE, TN)
(Resource Conservation and Recovery Act (tracking hazardous waste)) Business NAICS classification: SHEET METAL WORK MANUFACTURING.
DRY CLEAN USA #508 (21 WHITE BRIDGE RD in NASHVILLE, TN)
(Resource Conservation and Recovery Act (tracking hazardous waste))
DIOCESE OF NASHVILLE (30 WHITE BRIDGE RD. in NASHVILLE, TN)
ENFORCEMENT/COMPLIANCE ACTIVITY (Integrated Compliance Information System)
Housing units lacking complete plumbing facilities: 0.4% Housing units lacking complete kitchen facilities: 2.7%
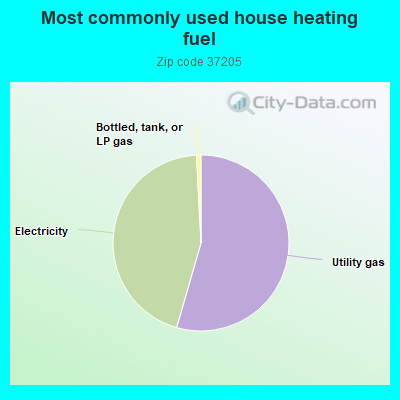
54.2%Utility gas
44.5%Electricity
0.8%Bottled, tank, or LP gas
Population in 1990: 23,323.
Place of birth for U.S.-born residents:
This state: 12,078
Northeast: 2,534
Midwest: 2,605
South: 6,298
West: 1,361
54% of the 37205 zip code residents lived in the same house 5 years ago. Out of people who lived in different houses, 52% lived in this county. Out of people who lived in different counties, 50% lived in Tennessee.
88% of the 37205 zip code residents lived in the same house 1 year ago. Out of people who lived in different houses, 65% moved from this county. Out of people who lived in different houses, 9% moved from different county within same state. Out of people who lived in different houses, 21% moved from different state.
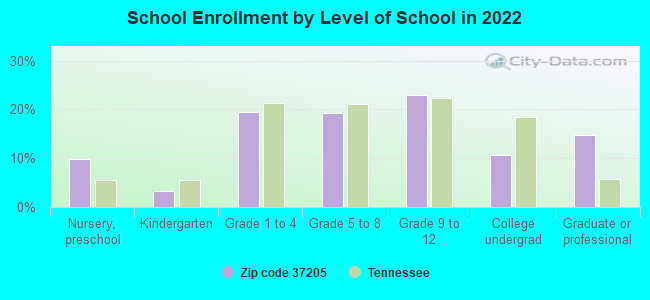
Private vs. public school enrollment:
Students in private schools in grades 1 to 8 (elementary and middle school): 1,556
Here:
75.6%
Tennessee:
15.0%
Students in private schools in grades 9 to 12 (high school): 881
Here:
74.0%
Tennessee:
16.2%
Students in private undergraduate colleges: 270
Here:
50.7%
Tennessee:
23.5%
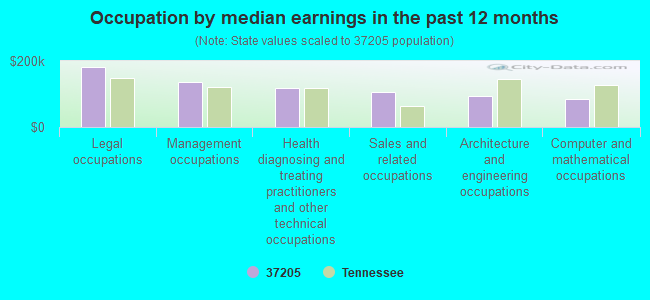
Occupation by median earnings in the past 12 months ($)
182,052Legal occupations
137,166Management occupations
116,768Health diagnosing and treating practitioners and other technical occupations
107,313Sales and related occupations
94,605Architecture and engineering occupations
85,288Computer and mathematical occupations
Companies with federal contracts located in this zip code (NASHVILLE, TN):
DELTA COALS INC (95 WHITE BRIDGE RD STE 404; small business) : $35,829,675 in 10 contractsfrom 2000 to 2006
Contracts for Fuels, Solid, Jewelry by Defense Logistics Agency Signed by year:2000: $2,628,302; 2001: $2,706,077; 2002: $4,477,207; 2003: $0; 2004: $5,933,584; 2005: $11,960,690; 2006: $8,123,815.
Biggest contracts:
$11,960,690 with Defense Logistics Agency for Fuels, Solid. Taking place in VA. Signed on 2005-03-11. Completion date: 2006-04-30.
$8,123,815, same as above.Signed on 2006-04-20. Completion date: 2007-05-31.
$5,933,584, same as above.Signed on 2004-02-23. Completion date: 2005-04-30.
$2,985,011, same as above.Signed on 2002-04-19. Completion date: 2003-04-30.
HOMELAND SECURITY CORPORATION (102 WOODMONT BLVD STE 800) : $477,166 in 4 contractsfrom 2002 to 2005
$262,166 with Department of Defense for Education Services. Signed on 2005-04-04. Completion date: 2005-04-30.
$160,000 with Dept. of Transportation -- unknown (invalid code) for Operation of Government-Owned Facilities -- Other Administrative Facilities and Service Buildings. Taking place in DC. Signed on 2002-08-15. Completion date: 2002-11-15.
$55,000 with Transportation Security Administration for Operation of Government-Owned Facilities -- Other Administrative Facilities and Service Buildings. Taking place in DC. Signed on 2003-09-15. Completion date: 2003-09-15.
$0, same as above.Signed on 2003-09-15. Completion date: 2003-09-15.
GRANITE TECHNOLOGIES, INC (104 WOODMONT BLVD; small business)
$150,000 with Army for ADP Facility Operation and Maintenance Services. Taking place in VA. Signed on 2001-11-08. Completion date: 2002-11-09.
AIRPORT PLAZA, LLC (110 LYNWOOD BLVD; small business) : $90,477 in 21 contractsfrom 2003 to 2006
Contracts for Lease or Rental of Facilities -- Office Buildings by Public Buildings Service Signed by year:2000: $0; 2001: $0; 2002: $0; 2003: $0; 2004: $15,940; 2005: $42,575; 2006: $31,962.
Biggest contracts:
$5,327 with Public Buildings Service for Lease or Rental of Facilities -- Office Buildings. Signed on 2006-07-01. Completion date: 2006-09-30.
$5,327, same as above.Signed on 2006-07-01. Completion date: 2006-09-30.
$5,327, same as above.Signed on 2006-04-01. Completion date: 2006-09-30.
$5,327, same as above.Signed on 2006-07-01. Completion date: 2006-09-30.
CLYDE SMITH (5945 LONG MEADOW RD; small business) : $58,380 in 2 contractsfrom 2000 to 2002
$50,000 with Army for Air Pollution -- Basic Research (R&D). Signed on 2000-09-27. Completion date: 2001-07-31.
$8,380, same as above.Signed on 2002-03-08. Completion date: 2002-04-30.
HYTORC OF TENNESSEE LLC (6526 ROLLING FORK DR; small business) : $19,568 in 3 contractsfrom 2004 to 2005
$9,913 with Army for Hand Tools, Power Driven. Signed on 2005-06-14. Completion date: 2005-06-30.
$6,155, same as above.Signed on 2005-09-09. Completion date: 2005-09-29.
$3,500 with Navy for Torque Converters and Speed Changers. Signed on 2004-10-29. Completion date: 2004-11-15.
TOM PATTEN (4308 IROQUOIS AVE; small business) : $7,500 in 2 contractsfrom 2003 to 2006
$4,000 with Air Force for Other Professional Services. Signed on 2003-09-30. Completion date: 2003-08-01.
$3,500 with Air Force for Recreational Services. Signed on 2006-03-30. Completion date: 2006-05-30.
Top industries in this zip code by the number of employees in 2005:
Health Care and Social Assistance: Offices of Physicians (except Mental Health Specialists) (250-499 employees: 1 establishment, 100-249 employees: 3 establishments, 50-99 employees: 6 establishments, 20-49 employees: 5 establishments, 10-19 employees: 7 establishments, 5-9 employees: 8 establishments, 1-4 employees: 15 establishments)
Health Care and Social Assistance: General Medical and Surgical Hospitals (over 1000: 1)
2003 - 2018 National Fire Incident Reporting System (NFIRS) incidents
Based on the data from the years 2003 - 2018 the average number of fires per year is 33. The highest number of reported fire incidents - 80 took place in 2007, and the least - 11 in 2013. The data has an increasing trend.
When looking into fire subcategories, the most incidents belonged to: Structure Fires (39.4%), and Outside Fires (37.9%).
Fire incident types reported to NFIRS in Zip Code 37205

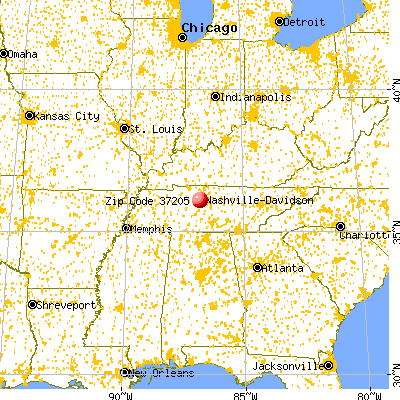


 Nearest zip codes: 37215, 37218, 37212, 37240, 37203, 37220.


 Based on the data from the years 2003 - 2018 the average number of fires per year is 33. The highest number of reported fire incidents - 80 took place in 2007, and the least - 11 in 2013. The data has an increasing trend.
 When looking into fire subcategories, the most incidents belonged to: Structure Fires (39.4%), and Outside Fires (37.9%).