Estimated zip code population in 2022: 14,767 Zip code population in 2010: 13,350 Zip code population in 2000: 11,208
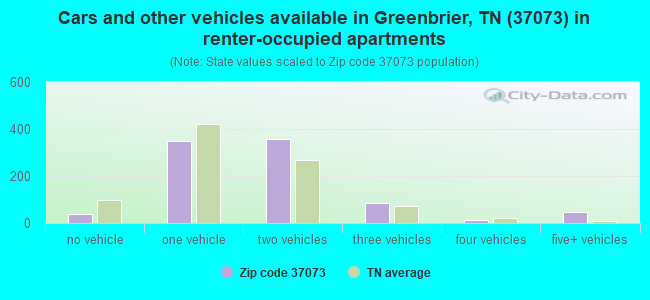
Houses and condos: 5,521 Renter-occupied apartments: 880
% of renters here:
16%
State:
33%
March 2022 cost of living index in zip code 37073: 88.5 (less than average, U.S. average is 100)
Land area: 50.7 sq. mi. Water area: 0.0 sq. mi.
Population density: 291 people per square mile
(very low).
OSM Map
General Map
Google Map
MSN Map
OSM Map
General Map
Google Map
MSN Map
OSM Map
General Map
Google Map
MSN Map
OSM Map
General Map
Google Map
MSN Map
Please wait while loading the map...
Real estate property taxes paid for housing units in 2022:
This zip code:
0.5% ($1,732)
Tennessee:
0.5% ($1,376)
Median real estate property taxes paid for housing units with mortgages in 2022: $1,828 (0.5%) Median real estate property taxes paid for housing units with no mortgage in 2022: $1,615 (0.4%)
Business Search- 14 Million verified businesses
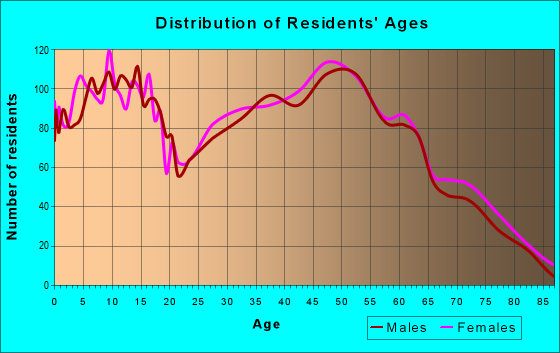
Males: 7,151
(48.4%)
Females: 7,615
(51.6%)
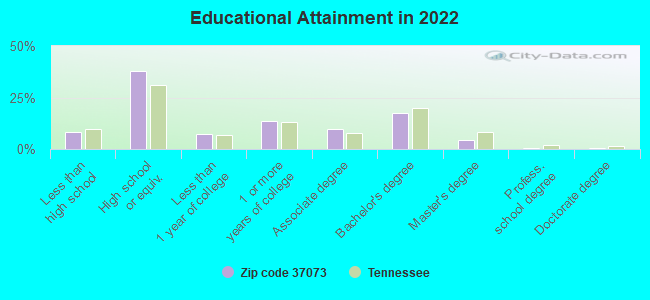
For population 25 years and over in 37073:
High school or higher: 91.5%
Bachelor's degree or higher: 23.2%
Graduate or professional degree: 5.9%
Unemployed: 0.6%
Mean travel time to work (commute): 31.2 minutes
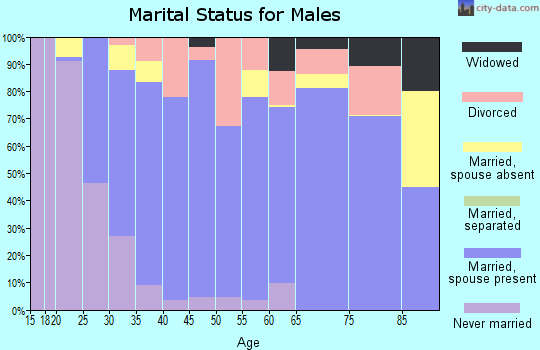
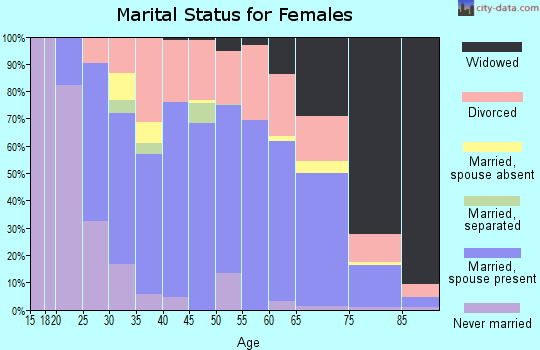
For population 15 years and over in 37073:
Never married: 22.8%
Now married: 58.2%
Separated: 1.7%
Widowed: 6.3%
Divorced: 10.9%
Zip code 37073 compared to state average:
Unemployed percentage significantly below state average.
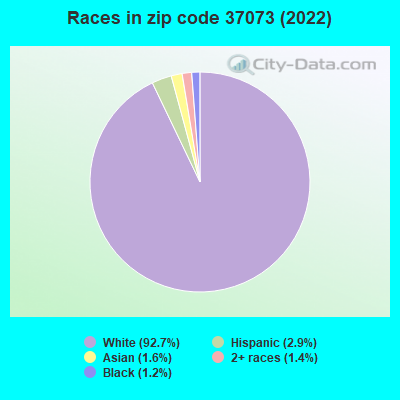
Black race population percentage significantly below state average.
Hispanic race population percentage below state average.
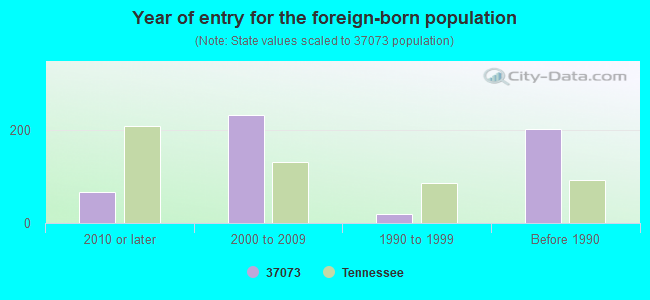
Foreign-born population percentage below state average.
Renting percentage below state average.
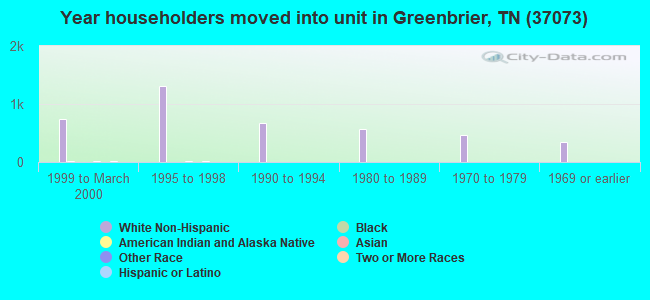
Length of stay since moving in significantly above state average.
Estimated median house/condo value in 2022: $372,780
37073:
$372,780
Tennessee:
$284,800
According to our research of Tennessee and other state lists, there were 36 registered sex offenders living in 37073 zip code as of April 27, 2024. The ratio of all residents to sex offenders in zip code 37073 is 397 to 1. The ratio of registered sex offenders to all residents in this zip code is near the state average.
Median resident age:
This zip code:
40.6 years
Tennessee median age:
39.2 years
Average household size:
This zip code:
2.8 people
Tennessee:
2.4 people
Averages for the 2020 tax year for zip code 37073, filed in 2021:
Average Adjusted Gross Income (AGI) in 2020: $64,893 (Individual Income Tax Returns)
Here:
$64,893
State:
$69,014
Salary/wage: $58,176 (reported on 84.4% of returns)
Here:
$58,176
State:
$55,872
(% of AGI for various income ranges: 1090.7% for AGIs below $25k, 3564.0% for AGIs $25k-50k, 6534.3% for AGIs $50k-75k, 9538.8% for AGIs $75k-100k, 17980.1% for AGIs $100k-200k, 59676.3% for AGIs over 200k)
Taxable interest for individuals: $1,068 (reported on 26.2% of returns)
This zip code:
$1,068
Tennessee:
$1,945
(% of AGI for various income ranges: 17.7% for AGIs below $25k, 21.7% for AGIs $25k-50k, 27.6% for AGIs $50k-75k, 41.4% for AGIs $75k-100k, 64.9% for AGIs $100k-200k, 602.5% for AGIs over 200k)
Ordinary dividends: $3,173 (reported on 11.4% of returns)
Here:
$3,173
State:
$8,105
(% of AGI for various income ranges: 10.7% for AGIs below $25k, 17.0% for AGIs $25k-50k, 25.1% for AGIs $50k-75k, 45.4% for AGIs $75k-100k, 105.8% for AGIs $100k-200k, 1197.5% for AGIs over 200k)
Net capital gain/loss in AGI: +$13,369 (reported on 11.2% of returns)
Here:
+$13,369
State:
+$33,664
(% of AGI for various income ranges: 6.5% for AGIs below $25k, 19.1% for AGIs $25k-50k, 39.4% for AGIs $50k-75k, 103.2% for AGIs $75k-100k, 456.0% for AGIs $100k-200k, 7886.2% for AGIs over 200k)
Profit/loss from business: +$22,934 (reported on 17.4% of returns)
Here:
+$22,934
State:
+$18,991
(% of AGI for various income ranges: 139.0% for AGIs below $25k, 170.8% for AGIs $25k-50k, 282.0% for AGIs $50k-75k, 414.1% for AGIs $75k-100k, 980.9% for AGIs $100k-200k, 15340.0% for AGIs over 200k)
Taxable individual retirement arrangement distribution: $15,300 (reported on 6.9% of returns)
37073:
$15,300
Tennessee:
$20,036
(% of AGI for various income ranges: 42.5% for AGIs below $25k, 57.2% for AGIs $25k-50k, 134.1% for AGIs $50k-75k, 235.9% for AGIs $75k-100k, 385.5% for AGIs $100k-200k, 1057.5% for AGIs over 200k)
Self-employed (Keogh) retirement plans: $22,600 (reported on 0.3% of returns)
37073:
$22,600
Tennessee:
$28,955
(% of AGI for various income ranges: 67.5% for AGIs $100k-200k)
Total itemized deductions: $32,292 (reported on 5.0% of returns)
Here:
$32,292
State:
$40,136
(% of AGI for various income ranges: 71.8% for AGIs $25k-50k, 159.1% for AGIs $50k-75k, 200.2% for AGIs $75k-100k, 537.6% for AGIs $100k-200k, 5530.0% for AGIs over 200k)
Charity contributions: $14,682 (reported on 3.9% of returns)
Here:
$14,682
State:
$19,852
(% of AGI for various income ranges: 7.5% for AGIs below $25k, 31.8% for AGIs $50k-75k, 64.4% for AGIs $75k-100k, 197.0% for AGIs $100k-200k, 2517.5% for AGIs over 200k)
Taxes paid: $5,150 (reported on 5.0% of returns)
37073:
$5,150
State:
$6,038
(% of AGI for various income ranges: 10.3% for AGIs $25k-50k, 22.0% for AGIs $50k-75k, 33.1% for AGIs $75k-100k, 99.9% for AGIs $100k-200k, 813.7% for AGIs over 200k)
Earned income credit: $2,229 (reported on 14.2% of returns)
Here:
$2,229
State:
$2,391
(% of AGI for various income ranges: 84.3% for AGIs below $25k, 61.0% for AGIs $25k-50k, 1.7% for AGIs $50k-75k)
Percentage of individuals using paid preparers for their 2020 taxes: 93.7%
Here:
94%
State:
93%
(% for various income ranges: 92.2% for AGIs below $25k, 94.8% for AGIs $25k-50k, 94.0% for AGIs $50k-75k, 93.8% for AGIs $75k-100k, 94.7% for AGIs $100k-200k, 91.7% for AGIs over 200k)
Averages for the 2012 tax year for zip code 37073, filed in 2013:
Average Adjusted Gross Income (AGI) in 2012: $48,862 (Individual Income Tax Returns)
Here:
$48,862
State:
$53,767
Salary/wage: $44,896 (reported on 87.1% of returns)
Here:
$44,896
State:
$45,421
(% of AGI for various income ranges: 73.4% for AGIs below $25k, 82.7% for AGIs $25k-50k, 84.7% for AGIs $50k-75k, 82.6% for AGIs $75k-100k, 82.4% for AGIs $100k-200k, 58.4% for AGIs over 200k)
Taxable interest for individuals: $791 (reported on 29.8% of returns)
This zip code:
$791
Tennessee:
$1,732
(% of AGI for various income ranges: 1.0% for AGIs below $25k, 0.6% for AGIs $25k-50k, 0.4% for AGIs $50k-75k, 0.4% for AGIs $75k-100k, 0.2% for AGIs $100k-200k, 0.9% for AGIs over 200k)
Ordinary dividends: $1,998 (reported on 9.9% of returns)
Here:
$1,998
State:
$6,739
(% of AGI for various income ranges: 0.8% for AGIs below $25k, 0.4% for AGIs $25k-50k, 0.2% for AGIs $50k-75k, 0.3% for AGIs $75k-100k, 0.4% for AGIs $100k-200k, 0.7% for AGIs over 200k)
Net capital gain/loss in AGI: +$7,892 (reported on 8.5% of returns)
Here:
+$7,892
State:
+$19,082
(% of AGI for various income ranges: 0.3% for AGIs $25k-50k, 0.3% for AGIs $50k-75k, 0.6% for AGIs $75k-100k, 1.3% for AGIs $100k-200k, 9.8% for AGIs over 200k)
Profit/loss from business: +$13,032 (reported on 16.9% of returns)
Here:
+$13,032
State:
+$15,240
(% of AGI for various income ranges: 10.2% for AGIs below $25k, 4.0% for AGIs $25k-50k, 3.0% for AGIs $50k-75k, 3.8% for AGIs $75k-100k, 4.5% for AGIs $100k-200k, 5.0% for AGIs over 200k)
Taxable individual retirement arrangement distribution: $12,473 (reported on 7.8% of returns)
37073:
$12,473
Tennessee:
$15,505
(% of AGI for various income ranges: 2.5% for AGIs below $25k, 1.8% for AGIs $25k-50k, 1.5% for AGIs $50k-75k, 1.7% for AGIs $75k-100k, 3.6% for AGIs $100k-200k)
Total itemized deductions: $18,492 (22% of AGI, reported on 24.9% of returns)
Here:
$18,492
State:
$21,976
Here:
21.6% of AGI
State:
17.8% of AGI
(% of AGI for various income ranges: 6.7% for AGIs below $25k, 8.4% for AGIs $25k-50k, 8.8% for AGIs $50k-75k, 10.5% for AGIs $75k-100k, 11.0% for AGIs $100k-200k, 9.7% for AGIs over 200k)
Charity contributions: $5,066 (reported on 18.9% of returns)
Here:
$5,066
State:
$6,709
(% of AGI for various income ranges: 0.7% for AGIs below $25k, 1.1% for AGIs $25k-50k, 1.4% for AGIs $50k-75k, 2.2% for AGIs $75k-100k, 2.7% for AGIs $100k-200k, 4.1% for AGIs over 200k)
Taxes paid: $3,717 (reported on 24.4% of returns)
37073:
$3,717
State:
$4,829
(% of AGI for various income ranges: 0.9% for AGIs below $25k, 1.4% for AGIs $25k-50k, 1.8% for AGIs $50k-75k, 2.2% for AGIs $75k-100k, 2.4% for AGIs $100k-200k, 1.9% for AGIs over 200k)
Earned income credit: $2,204 (reported on 18.1% of returns)
Here:
$2,204
State:
$2,404
(% of AGI for various income ranges: 6.5% for AGIs below $25k, 1.1% for AGIs $25k-50k)
Percentage of individuals using paid preparers for their 2012 taxes: 48.2%
Here:
48%
State:
52%
(% for various income ranges: 44.9% for AGIs below $25k, 47.4% for AGIs $25k-50k, 47.2% for AGIs $50k-75k, 53.7% for AGIs $75k-100k, 55.8% for AGIs $100k-200k, 75.0% for AGIs over 200k)
Averages for the 2004 tax year for zip code 37073, filed in 2005:
Average Adjusted Gross Income (AGI) in 2004: $41,095 (Individual Income Tax Returns)
Here:
$41,095
State:
$44,088
Salary/wage: $38,453 (reported on 87.9% of returns)
Here:
$38,453
State:
$38,825
(% of AGI for various income ranges: 112.7% for AGIs below $10k, 79.2% for AGIs $10k-25k, 85.8% for AGIs $25k-50k, 87.6% for AGIs $50k-75k, 87.7% for AGIs $75k-100k, 63.1% for AGIs over 100k)
Taxable interest for individuals: $1,014 (reported on 35.5% of returns)
This zip code:
$1,014
Tennessee:
$1,802
(% of AGI for various income ranges: 3.6% for AGIs below $10k, 1.6% for AGIs $10k-25k, 0.9% for AGIs $25k-50k, 0.4% for AGIs $50k-75k, 0.7% for AGIs $75k-100k, 1.1% for AGIs over 100k)
Taxable dividends: $1,155 (reported on 12.5% of returns)
Here:
$1,155
State:
$3,727
(% of AGI for various income ranges: 1.3% for AGIs below $10k, 0.6% for AGIs $10k-25k, 0.2% for AGIs $25k-50k, 0.2% for AGIs $50k-75k, 0.3% for AGIs $75k-100k, 0.6% for AGIs over 100k)
Net capital gain/loss: +$9,096 (reported on 10.2% of returns)
Here:
+$9,096
State:
+$15,776
(% of AGI for various income ranges: -0.7% for AGIs below $10k, 0.7% for AGIs $10k-25k, 0.4% for AGIs $25k-50k, 0.7% for AGIs $50k-75k, 1.3% for AGIs $75k-100k, 9.1% for AGIs over 100k)
Profit/loss from business: +$11,104 (reported on 18.1% of returns)
Here:
+$11,104
State:
+$12,882
(% of AGI for various income ranges: 9.3% for AGIs below $10k, 7.1% for AGIs $10k-25k, 4.8% for AGIs $25k-50k, 3.3% for AGIs $50k-75k, 2.7% for AGIs $75k-100k, 7.9% for AGIs over 100k)
IRA payment deduction: $3,286 (reported on 1.8% of returns)
37073:
$3,286
Tennessee:
$2,934
(% of AGI for various income ranges: 0.2% for AGIs $10k-25k, 0.2% for AGIs $25k-50k, 0.2% for AGIs $50k-75k, 0.1% for AGIs $75k-100k, 0.1% for AGIs over 100k)
Self-employed pension: $6,467 (reported on 0.3% of returns)
Here:
$6,467
Tennessee:
$16,857
Total itemized deductions: $15,227 (23% of AGI, reported on 29.7% of returns)
Here:
$15,227
State:
$18,035
Here:
23.2% of AGI
State:
19.9% of AGI
(% of AGI for various income ranges: 12.7% for AGIs below $10k, 9.1% for AGIs $10k-25k, 10.0% for AGIs $25k-50k, 12.0% for AGIs $50k-75k, 11.9% for AGIs $75k-100k, 10.9% for AGIs over 100k)
Charity contributions deductions: $3,839 (5% of AGI, reported on 23.5% of returns)
Here:
$3,839
State:
$5,167
Here:
5.5% of AGI
State:
5.3% of AGI
(% of AGI for various income ranges: 0.9% for AGIs below $10k, 1.3% for AGIs $10k-25k, 1.5% for AGIs $25k-50k, 2.2% for AGIs $50k-75k, 2.1% for AGIs $75k-100k, 3.8% for AGIs over 100k)
Total tax: $5,115 (reported on 78.2% of returns)
37073:
$5,115
State:
$7,482
(% of AGI for various income ranges: 4.3% for AGIs below $10k, 4.4% for AGIs $10k-25k, 6.9% for AGIs $25k-50k, 8.1% for AGIs $50k-75k, 10.4% for AGIs $75k-100k, 18.5% for AGIs over 100k)
Earned income credit: $1,674 (reported on 14.5% of returns)
Here:
$1,674
State:
$1,826
Percentage of individuals using paid preparers for their 2004 taxes: 56.6%
Here:
57%
State:
60%
(% for various income ranges: 47.5% for AGIs below $10k, 57.9% for AGIs $10k-25k, 58.8% for AGIs $25k-50k, 58.5% for AGIs $50k-75k, 53.3% for AGIs $75k-100k, 72.1% for AGIs over 100k)
Likely homosexual households (counted as self-reported same-sex unmarried-partner households)
Lesbian couples: 0.1% of all households
Gay men: 0.5% of all households
Household received Food Stamps/SNAP in the past 12 months: 246 Household did not receive Food Stamps/SNAP in the past 12 months: 5,126
Women who had a birth in the past 12 months: 156 (127 now married, 30 unmarried) Women who did not have a birth in the past 12 months: 3,473 (1,836 now married, 1,637 unmarried)
Housing units in zip code 37073 with a mortgage: 2,910 (267 second mortgage, 246 both second mortgage and home equity loan) Houses without a mortgage: 49
Median monthly owner costs for units with a mortgage: $1,675 Median monthly owner costs for units without a mortgage: $494
Residents with income below the poverty level in 2022:
This zip code:
6.1%
Whole state:
13.3%
Residents with income below 50% of the poverty level in 2022:
This zip code:
4.4%
Whole state:
7.1%
Median number of rooms in houses and condos:
Here:
6.5
State:
6.5
Median number of rooms in apartments:
Here:
5.0
State:
4.4
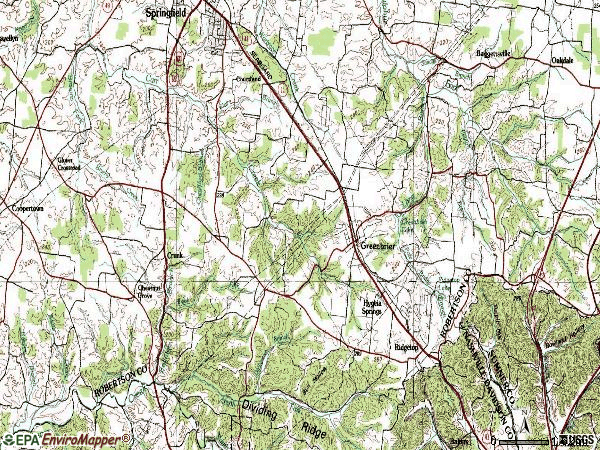
Notable locations in this zip code not listed on our city pages
Notable locations in zip code 37073: Ridgetop Volunteer Fire Department (A), White House Community Volunteer Fire Department Station 52 (B), Greenbrier Fire Department (C). Display/hide their locations on the map
Churches in zip code 37073 include: Gideon Church (A), Rock Springs Church (B), Zion Chapel (C), Mount Pleasant United Methodist Church (D), Calvary Church (E), Mount Sharon Cumberland Presbyterian Church (F), Greenbrier First Baptist Church (G), Ebenezer Church (H). Display/hide their locations on the map
Cemeteries: Swift Cemetery (1), Webb Cemetery (2), Lights Chapel Cemetery (3), Worsham Cemetery (4), Rock Springs Cemetery (5), Pinson Cemetery (6), Mount Zion Cemetery (7). Display/hide their locations on the map
Size of family households: 1,733 2-persons, 895 3-persons, 671 4-persons, 476 5-persons, 73 6-persons, 161 7-or-more-persons
Size of nonfamily households: 1,191 1-person, 119 2-persons, 32 3-persons
2,207 married couples with children.
883 single-parent households (151 men, 732 women).
97.2% of residents of 37073 zip code speak English at home.
1.1% of residents speak Spanish at home (63% very well, 22% well, 15% not well).
0.2% of residents speak other Indo-European language at home (100% very well).
0.9% of residents speak Asian or Pacific Island language at home (69% very well, 13% well, 18% not well).
0.2% of residents speak other language at home (30% very well, 70% not well).
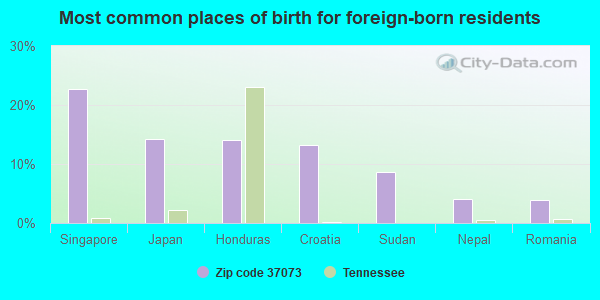
Foreign born population: 390 (2.6%) (78.7% of them are naturalized citizens)
This zip code:
2.6%
Whole state:
5.6%
23%Singapore
14%Japan
14%Honduras
13%Croatia
9%Sudan
4%Nepal
4%Romania
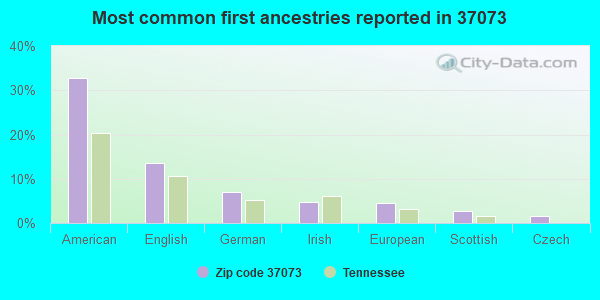
33%American
14%English
7%German
5%Irish
5%European
3%Scottish
2%Czech
Year of entry for the foreign-born population
662010 or later
2322000 to 2009
201990 to 1999
202Before 1990
Facilities with environmental interests located in this zip code:
CLEAN HARBORS TENNESSEE LLC (2815 OLD GREENBRIER PIKE in GREENBRIER, TN)
AIR MINOR (AIRS/AFS) (Integrated Compliance Information System) - ICIS-HQ-2001-7001, FORMAL ENFORCEMENT ACTION ENFORCEMENT/COMPLIANCE ACTIVITY (Integrated Compliance Information System) HAZARDOUS WASTE BIENNIAL REPORTER (Resource Conservation and Recovery Act (tracking hazardous waste)) - ICIS-, ENFORCEMENT/COMPLIANCE ACTIVITY Large Quantity Generators, more that 1000 kg of hazardous waste/month (Resource Conservation and Recovery Act (tracking hazardous waste)) - ICIS-, ENFORCEMENT/COMPLIANCE ACTIVITY TSD (Resource Conservation and Recovery Act (tracking hazardous waste)) - notification - ICIS-, ENFORCEMENT/COMPLIANCE ACTIVITY Business SIC classification: REFUSE SYSTEMS Business NAICS classification: PACKING AND CRATING. Organizations: CLEAN HARBORES (CONTACT/OWNER)
Alternative names: LAIDLAW ENVIRONMENTAL SERVICES, SAFETY KLEEN TS INCORPORATED, SAFTY KLEEN TS INCORPORATED
CLARK CONTROL SYSTEMS INC (2234 WOODRUFF AVENUE GREENBRIE in GREEN BRIER, TN)
(Resource Conservation and Recovery Act (tracking hazardous waste)) Organizations: JOHN PETRO VP (CONTACT/OPERATOR)
, AZZ INCORPORATED (CONTACT/OWNER)
Alternative names: SPURLOCK INDUSTRIES
ATWOOD INDUSTRIES MOBILE DIVISION (6320 KELLY WILLIS ROAD in GREENBRIER, TN)
(Resource Conservation and Recovery Act (tracking hazardous waste))
Housing units lacking complete kitchen facilities: 0.5%
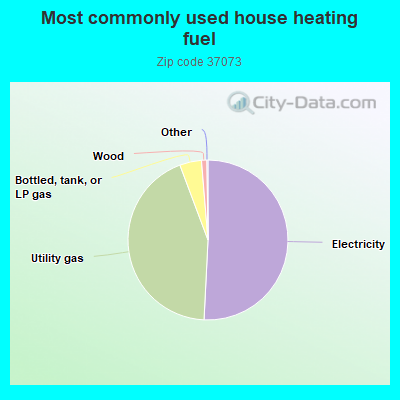
50.8%Electricity
43.5%Utility gas
4.4%Bottled, tank, or LP gas
1.1%Wood
Population in 1990: 8,597. Population change in the 1990s: +2,611 (+30.4%).
Place of birth for U.S.-born residents:
This state: 9,996
Northeast: 788
Midwest: 1,003
South: 1,716
West: 659
57% of the 37073 zip code residents lived in the same house 5 years ago. Out of people who lived in different houses, 46% lived in this county. Out of people who lived in different counties, 50% lived in Tennessee.
92% of the 37073 zip code residents lived in the same house 1 year ago. Out of people who lived in different houses, 31% moved from this county. Out of people who lived in different houses, 41% moved from different county within same state. Out of people who lived in different houses, 30% moved from different state. Out of people who lived in different houses, 2% moved from abroad.
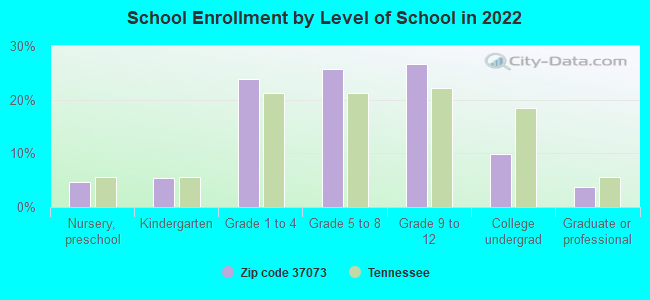
Private vs. public school enrollment:
Students in private schools in grades 1 to 8 (elementary and middle school): 298
Here:
17.0%
Tennessee:
15.0%
Students in private schools in grades 9 to 12 (high school): 169
Here:
18.0%
Tennessee:
16.2%
Students in private undergraduate colleges: 46
Here:
13.3%
Tennessee:
23.5%
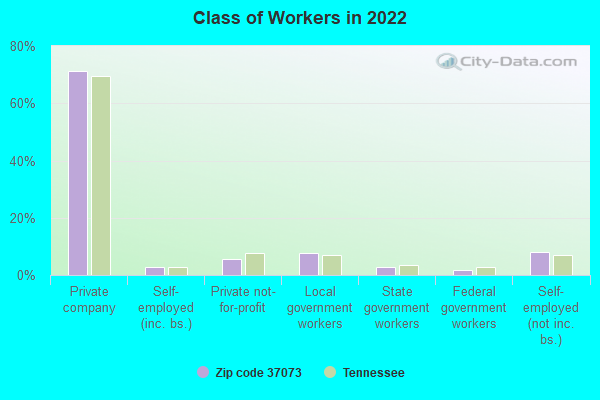
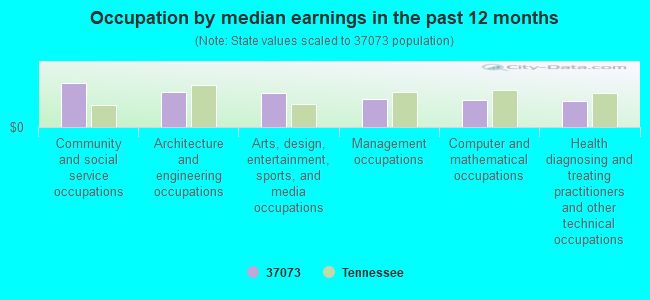
Occupation by median earnings in the past 12 months ($)
114,162Community and social service occupations
89,686Architecture and engineering occupations
87,030Arts, design, entertainment, sports, and media occupations
73,032Management occupations
70,161Computer and mathematical occupations
67,349Health diagnosing and treating practitioners and other technical occupations
Top industries in this zip code by the number of employees in 2005:
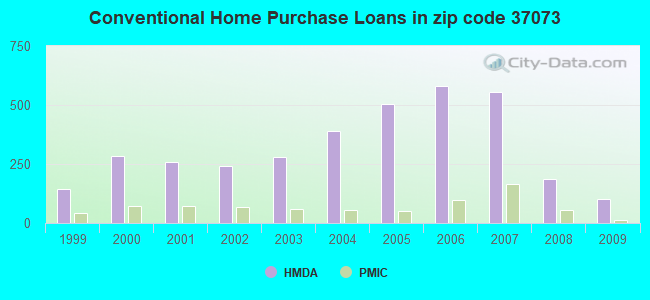
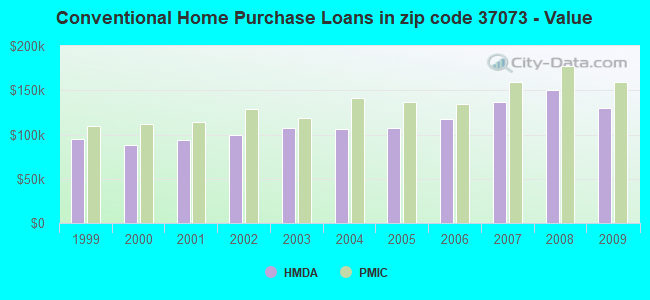
Detailed PMIC statistics for the following Tracts:0806.01
, 0806.02
2002 - 2018 National Fire Incident Reporting System (NFIRS) incidents
Based on the data from the years 2002 - 2018 the average number of fire incidents per year is 61. The highest number of reported fire incidents - 110 took place in 2007, and the least - 25 in 2003. The data has an increasing trend.
When looking into fire subcategories, the most reports belonged to: Structure Fires (47.1%), and Outside Fires (38.8%).
Fire incident types reported to NFIRS in Zip Code 37073


 Nearest zip codes: 37072, 37172, 37189, 37080, 37188, 37049.


 Based on the data from the years 2002 - 2018 the average number of fire incidents per year is 61. The highest number of reported fire incidents - 110 took place in 2007, and the least - 25 in 2003. The data has an increasing trend.
 When looking into fire subcategories, the most reports belonged to: Structure Fires (47.1%), and Outside Fires (38.8%).