Estimated zip code population in 2022: 32,960 Zip code population in 2010: 30,215 Zip code population in 2000: 26,386
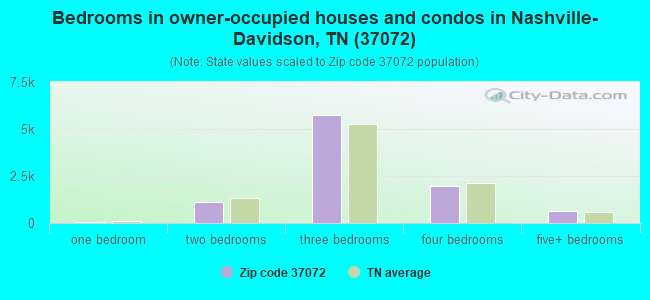
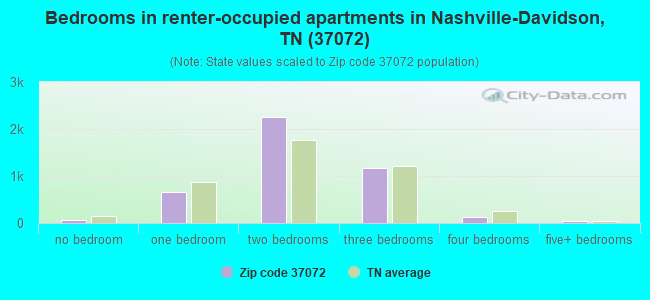
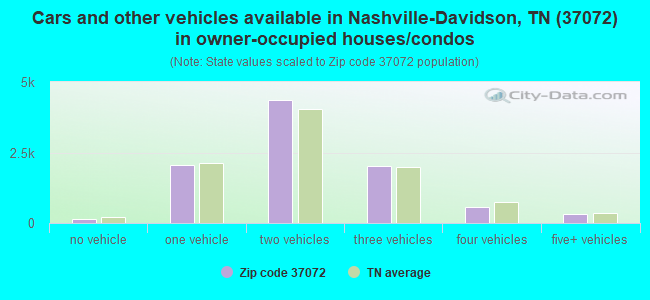
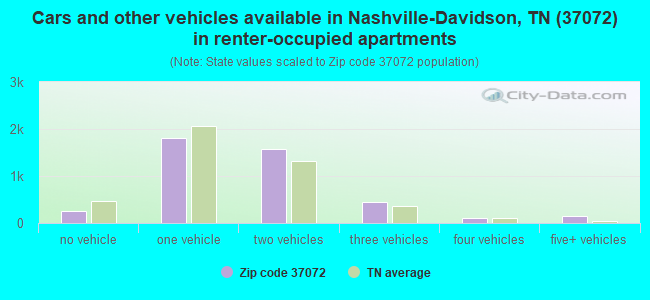
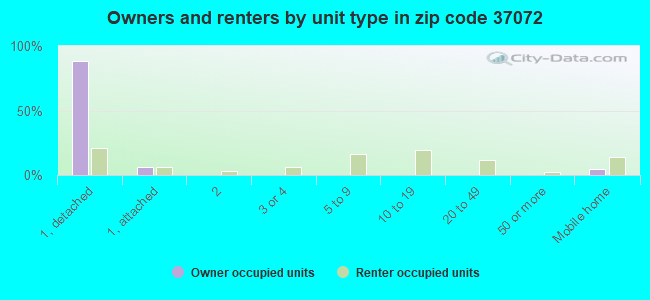
Houses and condos: 14,340 Renter-occupied apartments: 4,317
% of renters here:
31%
State:
33%
March 2022 cost of living index in zip code 37072: 89.9 (less than average, U.S. average is 100)
Land area: 77.9 sq. mi. Water area: 0.2 sq. mi.
Population density: 423 people per square mile
(low).
OSM Map
General Map
Google Map
MSN Map
OSM Map
General Map
Google Map
MSN Map
OSM Map
General Map
Google Map
MSN Map
OSM Map
General Map
Google Map
MSN Map
Please wait while loading the map...
Real estate property taxes paid for housing units in 2022:
This zip code:
0.5% ($1,952)
Tennessee:
0.5% ($1,376)
Median real estate property taxes paid for housing units with mortgages in 2022: $1,937 (0.5%) Median real estate property taxes paid for housing units with no mortgage in 2022: $1,992 (0.6%)
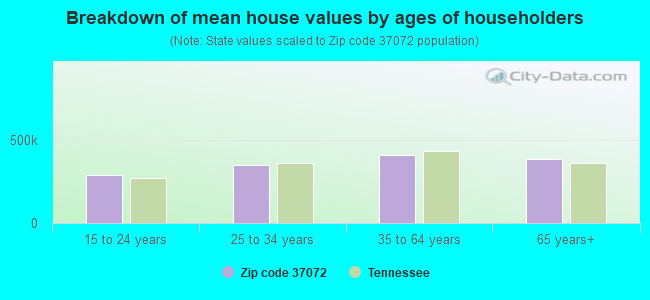
Estimated median house/condo value in 2022: $366,399
37072:
$366,399
Tennessee:
$284,800
According to our research of Tennessee and other state lists, there were 64 registered sex offenders living in 37072 zip code as of April 27, 2024. The ratio of all residents to sex offenders in zip code 37072 is 506 to 1. The ratio of registered sex offenders to all residents in this zip code is lower than the state average.
Median resident age:
This zip code:
40.7 years
Tennessee median age:
39.2 years
Average household size:
This zip code:
2.4 people
Tennessee:
2.4 people
Averages for the 2020 tax year for zip code 37072, filed in 2021:
Average Adjusted Gross Income (AGI) in 2020: $64,665 (Individual Income Tax Returns)
Here:
$64,665
State:
$69,014
Salary/wage: $55,440 (reported on 81.9% of returns)
Here:
$55,440
State:
$55,872
(% of AGI for various income ranges: 1119.0% for AGIs below $25k, 3635.0% for AGIs $25k-50k, 6573.5% for AGIs $50k-75k, 10006.1% for AGIs $75k-100k, 17719.7% for AGIs $100k-200k, 63780.0% for AGIs over 200k)
Taxable interest for individuals: $1,686 (reported on 25.6% of returns)
This zip code:
$1,686
Tennessee:
$1,945
(% of AGI for various income ranges: 19.0% for AGIs below $25k, 16.6% for AGIs $25k-50k, 33.9% for AGIs $50k-75k, 65.0% for AGIs $75k-100k, 122.5% for AGIs $100k-200k, 1502.6% for AGIs over 200k)
Ordinary dividends: $4,458 (reported on 14.6% of returns)
Here:
$4,458
State:
$8,105
(% of AGI for various income ranges: 15.3% for AGIs below $25k, 22.1% for AGIs $25k-50k, 52.7% for AGIs $50k-75k, 124.0% for AGIs $75k-100k, 231.9% for AGIs $100k-200k, 2125.3% for AGIs over 200k)
Net capital gain/loss in AGI: +$22,956 (reported on 13.7% of returns)
Here:
+$22,956
State:
+$33,664
(% of AGI for various income ranges: 11.7% for AGIs below $25k, 18.4% for AGIs $25k-50k, 69.6% for AGIs $50k-75k, 171.7% for AGIs $75k-100k, 495.2% for AGIs $100k-200k, 21166.3% for AGIs over 200k)
Profit/loss from business: +$17,512 (reported on 19.9% of returns)
Here:
+$17,512
State:
+$18,991
(% of AGI for various income ranges: 175.8% for AGIs below $25k, 224.0% for AGIs $25k-50k, 335.2% for AGIs $50k-75k, 487.9% for AGIs $75k-100k, 1017.2% for AGIs $100k-200k, 9474.2% for AGIs over 200k)
Taxable individual retirement arrangement distribution: $18,386 (reported on 7.7% of returns)
37072:
$18,386
Tennessee:
$20,036
(% of AGI for various income ranges: 50.2% for AGIs below $25k, 63.3% for AGIs $25k-50k, 163.0% for AGIs $50k-75k, 277.2% for AGIs $75k-100k, 598.0% for AGIs $100k-200k, 2811.1% for AGIs over 200k)
Self-employed (Keogh) retirement plans: $25,112 (reported on 0.5% of returns)
37072:
$25,112
Tennessee:
$28,955
(% of AGI for various income ranges: 40.4% for AGIs $100k-200k, 789.5% for AGIs over 200k)
Total itemized deductions: $32,966 (reported on 6.0% of returns)
Here:
$32,966
State:
$40,136
(% of AGI for various income ranges: 35.3% for AGIs below $25k, 80.4% for AGIs $25k-50k, 202.4% for AGIs $50k-75k, 325.1% for AGIs $75k-100k, 732.8% for AGIs $100k-200k, 6021.1% for AGIs over 200k)
Charity contributions: $15,717 (reported on 5.2% of returns)
Here:
$15,717
State:
$19,852
(% of AGI for various income ranges: 2.8% for AGIs below $25k, 14.4% for AGIs $25k-50k, 42.4% for AGIs $50k-75k, 96.8% for AGIs $75k-100k, 327.6% for AGIs $100k-200k, 3462.1% for AGIs over 200k)
Taxes paid: $5,243 (reported on 5.9% of returns)
37072:
$5,243
State:
$6,038
(% of AGI for various income ranges: 3.3% for AGIs below $25k, 11.2% for AGIs $25k-50k, 32.3% for AGIs $50k-75k, 53.1% for AGIs $75k-100k, 132.9% for AGIs $100k-200k, 860.0% for AGIs over 200k)
Earned income credit: $2,165 (reported on 15.0% of returns)
Here:
$2,165
State:
$2,391
(% of AGI for various income ranges: 88.7% for AGIs below $25k, 57.4% for AGIs $25k-50k, 0.9% for AGIs $50k-75k)
Percentage of individuals using paid preparers for their 2020 taxes: 92.3%
Here:
92%
State:
93%
(% for various income ranges: 90.7% for AGIs below $25k, 93.0% for AGIs $25k-50k, 92.8% for AGIs $50k-75k, 92.9% for AGIs $75k-100k, 93.2% for AGIs $100k-200k, 94.9% for AGIs over 200k)
Averages for the 2012 tax year for zip code 37072, filed in 2013:
Average Adjusted Gross Income (AGI) in 2012: $52,169 (Individual Income Tax Returns)
Here:
$52,169
State:
$53,767
Salary/wage: $45,750 (reported on 85.0% of returns)
Here:
$45,750
State:
$45,421
(% of AGI for various income ranges: 74.8% for AGIs below $25k, 82.1% for AGIs $25k-50k, 79.0% for AGIs $50k-75k, 77.3% for AGIs $75k-100k, 78.3% for AGIs $100k-200k, 54.7% for AGIs over 200k)
Taxable interest for individuals: $1,578 (reported on 28.4% of returns)
This zip code:
$1,578
Tennessee:
$1,732
(% of AGI for various income ranges: 1.2% for AGIs below $25k, 0.7% for AGIs $25k-50k, 0.5% for AGIs $50k-75k, 0.7% for AGIs $75k-100k, 0.4% for AGIs $100k-200k, 1.8% for AGIs over 200k)
Ordinary dividends: $3,803 (reported on 13.9% of returns)
Here:
$3,803
State:
$6,739
(% of AGI for various income ranges: 1.0% for AGIs below $25k, 0.5% for AGIs $25k-50k, 0.6% for AGIs $50k-75k, 0.8% for AGIs $75k-100k, 1.0% for AGIs $100k-200k, 2.2% for AGIs over 200k)
Net capital gain/loss in AGI: +$6,981 (reported on 11.0% of returns)
Here:
+$6,981
State:
+$19,082
(% of AGI for various income ranges: 0.1% for AGIs $25k-50k, 0.3% for AGIs $50k-75k, 0.5% for AGIs $75k-100k, 0.9% for AGIs $100k-200k, 6.4% for AGIs over 200k)
Profit/loss from business: +$15,770 (reported on 17.8% of returns)
Here:
+$15,770
State:
+$15,240
(% of AGI for various income ranges: 9.0% for AGIs below $25k, 3.8% for AGIs $25k-50k, 3.5% for AGIs $50k-75k, 4.1% for AGIs $75k-100k, 4.7% for AGIs $100k-200k, 9.1% for AGIs over 200k)
Taxable individual retirement arrangement distribution: $12,136 (reported on 8.7% of returns)
37072:
$12,136
Tennessee:
$15,505
(% of AGI for various income ranges: 2.8% for AGIs below $25k, 1.6% for AGIs $25k-50k, 2.0% for AGIs $50k-75k, 2.2% for AGIs $75k-100k, 2.3% for AGIs $100k-200k, 1.6% for AGIs over 200k)
Self-employment retirement plans: $19,367 (reported on 0.4% of returns)
37072:
$19,367
Tennessee:
$22,567
Total itemized deductions: $19,822 (20% of AGI, reported on 27.3% of returns)
Here:
$19,822
State:
$21,976
Here:
20.1% of AGI
State:
17.8% of AGI
(% of AGI for various income ranges: 7.3% for AGIs below $25k, 9.2% for AGIs $25k-50k, 11.1% for AGIs $50k-75k, 11.3% for AGIs $75k-100k, 11.9% for AGIs $100k-200k, 9.7% for AGIs over 200k)
Charity contributions: $6,468 (reported on 22.1% of returns)
Here:
$6,468
State:
$6,709
(% of AGI for various income ranges: 1.0% for AGIs below $25k, 1.3% for AGIs $25k-50k, 2.2% for AGIs $50k-75k, 2.7% for AGIs $75k-100k, 3.6% for AGIs $100k-200k, 4.7% for AGIs over 200k)
Taxes paid: $4,101 (reported on 27.0% of returns)
37072:
$4,101
State:
$4,829
(% of AGI for various income ranges: 1.3% for AGIs below $25k, 1.7% for AGIs $25k-50k, 2.2% for AGIs $50k-75k, 2.4% for AGIs $75k-100k, 2.7% for AGIs $100k-200k, 1.9% for AGIs over 200k)
Earned income credit: $2,219 (reported on 17.9% of returns)
Here:
$2,219
State:
$2,404
(% of AGI for various income ranges: 6.4% for AGIs below $25k, 1.0% for AGIs $25k-50k)
Percentage of individuals using paid preparers for their 2012 taxes: 48.7%
Here:
49%
State:
52%
(% for various income ranges: 46.6% for AGIs below $25k, 45.8% for AGIs $25k-50k, 50.5% for AGIs $50k-75k, 51.6% for AGIs $75k-100k, 54.2% for AGIs $100k-200k, 73.3% for AGIs over 200k)
Averages for the 2004 tax year for zip code 37072, filed in 2005:
Average Adjusted Gross Income (AGI) in 2004: $44,249 (Individual Income Tax Returns)
Here:
$44,249
State:
$44,088
Salary/wage: $40,525 (reported on 86.1% of returns)
Here:
$40,525
State:
$38,825
(% of AGI for various income ranges: 158.2% for AGIs below $10k, 77.0% for AGIs $10k-25k, 82.8% for AGIs $25k-50k, 83.2% for AGIs $50k-75k, 83.3% for AGIs $75k-100k, 69.3% for AGIs over 100k)
Taxable interest for individuals: $1,505 (reported on 37.0% of returns)
This zip code:
$1,505
Tennessee:
$1,802
(% of AGI for various income ranges: 7.7% for AGIs below $10k, 1.8% for AGIs $10k-25k, 1.2% for AGIs $25k-50k, 0.9% for AGIs $50k-75k, 0.8% for AGIs $75k-100k, 1.4% for AGIs over 100k)
Taxable dividends: $2,197 (reported on 17.3% of returns)
Here:
$2,197
State:
$3,727
(% of AGI for various income ranges: 2.7% for AGIs below $10k, 0.7% for AGIs $10k-25k, 0.4% for AGIs $25k-50k, 0.5% for AGIs $50k-75k, 0.5% for AGIs $75k-100k, 1.5% for AGIs over 100k)
Net capital gain/loss: +$8,635 (reported on 14.5% of returns)
Here:
+$8,635
State:
+$15,776
(% of AGI for various income ranges: -1.3% for AGIs below $10k, 0.3% for AGIs $10k-25k, 0.2% for AGIs $25k-50k, 0.6% for AGIs $50k-75k, 1.6% for AGIs $75k-100k, 7.4% for AGIs over 100k)
Profit/loss from business: +$14,583 (reported on 18.0% of returns)
Here:
+$14,583
State:
+$12,882
(% of AGI for various income ranges: 6.3% for AGIs below $10k, 6.9% for AGIs $10k-25k, 3.8% for AGIs $25k-50k, 4.3% for AGIs $50k-75k, 4.4% for AGIs $75k-100k, 8.8% for AGIs over 100k)
IRA payment deduction: $3,151 (reported on 2.0% of returns)
37072:
$3,151
Tennessee:
$2,934
(% of AGI for various income ranges: 0.2% for AGIs $10k-25k, 0.2% for AGIs $25k-50k, 0.2% for AGIs $50k-75k, 0.1% for AGIs $75k-100k, 0.1% for AGIs over 100k)
Self-employed pension: $14,075 (reported on 0.8% of returns)
Here:
$14,075
Tennessee:
$16,857
(% of AGI for various income ranges: 0.1% for AGIs $50k-75k, 0.2% for AGIs $75k-100k, 0.6% for AGIs over 100k)
Total itemized deductions: $16,598 (22% of AGI, reported on 31.6% of returns)
Here:
$16,598
State:
$18,035
Here:
21.6% of AGI
State:
19.9% of AGI
(% of AGI for various income ranges: 15.7% for AGIs below $10k, 8.4% for AGIs $10k-25k, 11.0% for AGIs $25k-50k, 13.7% for AGIs $50k-75k, 14.1% for AGIs $75k-100k, 11.1% for AGIs over 100k)
Charity contributions deductions: $4,599 (6% of AGI, reported on 27.1% of returns)
Here:
$4,599
State:
$5,167
Here:
5.7% of AGI
State:
5.3% of AGI
(% of AGI for various income ranges: 1.7% for AGIs below $10k, 1.3% for AGIs $10k-25k, 1.8% for AGIs $25k-50k, 2.8% for AGIs $50k-75k, 3.4% for AGIs $75k-100k, 3.7% for AGIs over 100k)
Total tax: $6,598 (reported on 77.8% of returns)
37072:
$6,598
State:
$7,482
(% of AGI for various income ranges: 5.6% for AGIs below $10k, 4.5% for AGIs $10k-25k, 7.4% for AGIs $25k-50k, 9.4% for AGIs $50k-75k, 11.0% for AGIs $75k-100k, 18.4% for AGIs over 100k)
Earned income credit: $1,737 (reported on 14.8% of returns)
Here:
$1,737
State:
$1,826
Percentage of individuals using paid preparers for their 2004 taxes: 55.9%
Here:
56%
State:
60%
(% for various income ranges: 49.0% for AGIs below $10k, 57.8% for AGIs $10k-25k, 55.6% for AGIs $25k-50k, 57.9% for AGIs $50k-75k, 56.4% for AGIs $75k-100k, 63.1% for AGIs over 100k)
Likely homosexual households (counted as self-reported same-sex unmarried-partner households)
Lesbian couples: 0.0% of all households
Gay men: 0.2% of all households
Household received Food Stamps/SNAP in the past 12 months: 1,006 Household did not receive Food Stamps/SNAP in the past 12 months: 12,826
Women who had a birth in the past 12 months: 416 (253 now married, 161 unmarried) Women who did not have a birth in the past 12 months: 6,720 (2,834 now married, 3,885 unmarried)
Housing units in zip code 37072 with a mortgage: 5,763 (391 second mortgage, 358 both second mortgage and home equity loan) Houses without a mortgage: 266
Median monthly owner costs for units with a mortgage: $1,619 Median monthly owner costs for units without a mortgage: $543
Residents with income below the poverty level in 2022:
This zip code:
9.6%
Whole state:
13.3%
Residents with income below 50% of the poverty level in 2022:
This zip code:
4.5%
Whole state:
7.1%
Median number of rooms in houses and condos:
Here:
6.5
State:
6.5
Median number of rooms in apartments:
Here:
4.3
State:
4.4
Notable locations in this zip code not listed on our city pages
Notable locations in zip code 37072: Space Park North Industrial Park (A), Millersville Fire Department Station 2 (B), Nashville Fire Department Station 39 (C), Millersville Fire Department Station 1 (D), Goodlettsville Fire Department (E), Goodlettsville City Hall (F), Goodlettsville Branch Library (G). Display/hide their locations on the map
Churches in zip code 37072 include: New Bethel Missionary Baptist Church (A), Southern Church (B), Spring Hill Church (C), Forest Lawn Memorial Church (D), Lutons Church (E), Slaters Chapel (F), Bethel Baptist Church (G), Page Heights Baptist Church (H), Union Hill Church (I). Display/hide their locations on the map
Cemeteries: Hudgins Cemetery (1), Templeton Cemetery (2), Turpin Cemetery (3), Jones Cemetery (4), Bethel Baptist Church Cemetery (5), White Hill Cemetery (6), Union Hill Cemetery (7). Display/hide their locations on the map
Streams, rivers, and creeks: Madison Creek (A), Lumsley Fork (B), Indian Trail Creek (C), Dickerson Branch (D), Slaters Creek (E), Bakers Fork (F), Pattens Branch (G), Willis Branch (H), Williamson Branch (I). Display/hide their locations on the map
3,384 married couples with children.
1,997 single-parent households (478 men, 1,519 women).
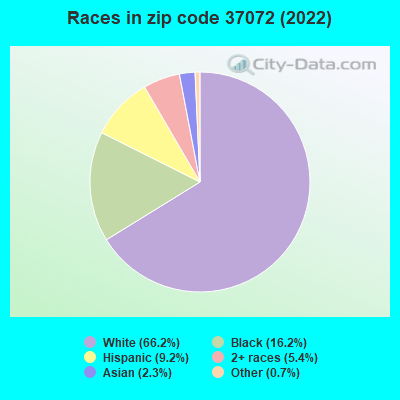
90.6% of residents of 37072 zip code speak English at home.
7.2% of residents speak Spanish at home (50% very well, 30% well, 17% not well, 3% not at all).
1.2% of residents speak other Indo-European language at home (83% very well, 3% well, 15% not well).
0.7% of residents speak Asian or Pacific Island language at home (41% very well, 26% well, 19% not well, 14% not at all).
0.2% of residents speak other language at home (51% very well, 49% well).
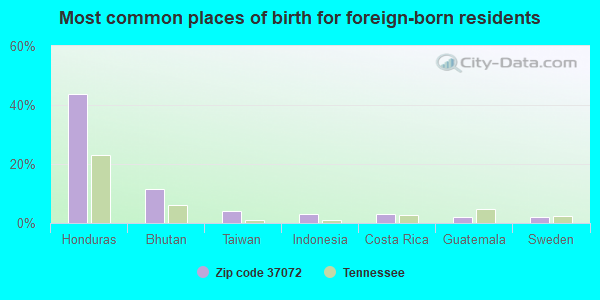
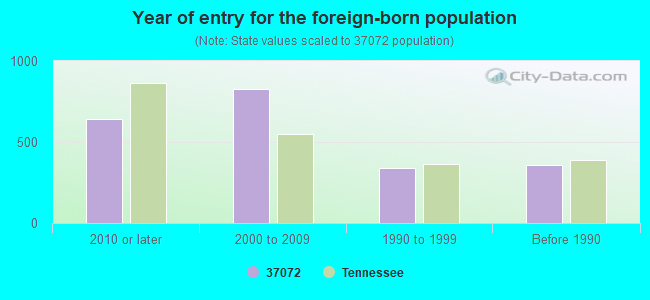
Foreign born population: 1,835 (5.6%) (45.9% of them are naturalized citizens)
Major facilities with environmental interests located in this zip code:
ANCHOR WIRE CORP. (425 CHURCH ST in GOODLETTSVILLE, TN)
(Resource Conservation and Recovery Act (tracking hazardous waste)) Organizations: STEVE SEAFORD (CONTACT/OPERATOR)
, HILLMAN GROUP INC (CONTACT/OWNER)
ATOMIC CLEANERS (201 SOUTH MAIN ST in GOODLETTSVILLE, TN)
AIR MINOR (AIRS/AFS) CRITERIA AND HAZARDOUS AIR POLLUTANT INVENTORY (Inventory of air pollution sources) Business SIC classification: DRYCLEANING PLANTS, EXCEPT RUG CLEANING
A-C ALUMINUM WINDOW CO (505 NORTH MAIN STREET in GOODLETTSVILLE, TN)
(Resource Conservation and Recovery Act (tracking hazardous waste)) Business NAICS classification: METAL WINDOW AND DOOR MANUFACTURING.
A-TECH PRECISION CO* (1303 LOUISVILLE HIGHWAY in GOODLETTSVILLE, TN)
(Resource Conservation and Recovery Act (tracking hazardous waste)) Business NAICS classification: OTHER COMMERCIAL AND SERVICE INDUSTRY MACHINERY MANUFACTURING.
ADVANCED ICE MAKERS (1304-C LOUISVILLE HWY in GOODLETTSVILLE, TN)
(Resource Conservation and Recovery Act (tracking hazardous waste)) Business NAICS classification: AIR-CONDITIONING AND WARM AIR HEATING EQUIPMENT AND COMMERCIAL AND INDUSTRIAL REFRIGERATION EQUIPMENT MANUFACTURING.
AERO-TEC INC (1304 LEWISVILLE HIGHWAY in GOODLETTSVILLE, TN)
(Resource Conservation and Recovery Act (tracking hazardous waste)) Business NAICS classification: ALL OTHER MISCELLANEOUS MANUFACTURING.
AMOCO OIL SS# 878 (600 TOW MILE PKWY in GOODLETTSVILLE, TN)
(Resource Conservation and Recovery Act (tracking hazardous waste)) Business NAICS classification: OTHER FUEL DEALERS.
ASSOCIATED WHOLESALE GROCERS INCORPORATED (500 SOUTH CARTWRIGHT STREET in GOODLETTSVILLE, TN)
Conditionally Exempt Small Quantity Generators, less than 100 kg/month of hazardous waste (Resource Conservation and Recovery Act (tracking hazardous waste)) - notification Organizations: MILTON MILAM (CONTACT/OPERATOR)
, ASSOCIATED WHOLESALE GROCERS, INC (CONTACT/OWNER)
Alternative names: FLEMING COMPANIES INC, FLEMING COMPANIES INC, NASHVILLE PRODUCT SUPPLY CENTER
B F C ENTERPRISE INC (RIDGECREST DRIVE in GOODLETTSVILLE, TN)
(Resource Conservation and Recovery Act (tracking hazardous waste))
BROOKS CHARLES INC (505 N MAIN STREET in GOODLETTSVILLE, TN)
(Resource Conservation and Recovery Act (tracking hazardous waste)) Business NAICS classification: INSTITUTIONAL FURNITURE MANUFACTURING.
CANNON'S RACKS & AXLES (414 SPACE PARK NORTH in GOODLETTSVILLE, TN)
(Resource Conservation and Recovery Act (tracking hazardous waste)) Business NAICS classification: ALL OTHER MOTOR VEHICLE PARTS MANUFACTURING.
COLD SPRINGS, INC. (1039 SLATERS CREEK RD in MILLERSVILLE, TN)
(Resource Conservation and Recovery Act (tracking hazardous waste))
COLOR GRAPHIC* (305 CHURCH STREET in GOODLETTSVILLE, TN)
(Resource Conservation and Recovery Act (tracking hazardous waste)) Business NAICS classification: COMMERCIAL LITHOGRAPHIC PRINTING.
Housing units lacking complete plumbing facilities: 0.8% Housing units lacking complete kitchen facilities: 2.0%
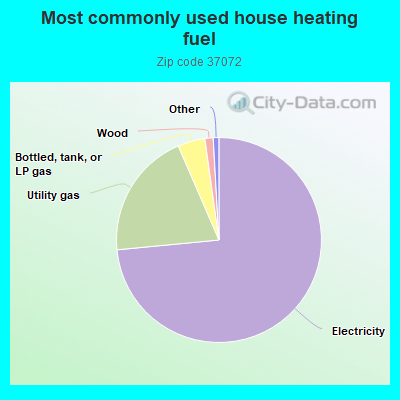
73.4%Electricity
20.0%Utility gas
4.3%Bottled, tank, or LP gas
1.3%Wood
Population in 1990: 20,825. Population change in the 1990s: +5,561 (+26.7%).
Place of birth for U.S.-born residents:
This state: 19,434
Northeast: 1,048
Midwest: 2,928
South: 5,520
West: 1,829
52% of the 37072 zip code residents lived in the same house 5 years ago. Out of people who lived in different houses, 40% lived in this county. Out of people who lived in different counties, 50% lived in Tennessee.
89% of the 37072 zip code residents lived in the same house 1 year ago. Out of people who lived in different houses, 34% moved from this county. Out of people who lived in different houses, 49% moved from different county within same state. Out of people who lived in different houses, 13% moved from different state. Out of people who lived in different houses, 6% moved from abroad.
Private vs. public school enrollment:
Students in private schools in grades 1 to 8 (elementary and middle school): 436
Here:
15.3%
Tennessee:
15.0%
Students in private schools in grades 9 to 12 (high school): 340
Here:
22.8%
Tennessee:
16.2%
Students in private undergraduate colleges: 144
Here:
9.5%
Tennessee:
23.5%
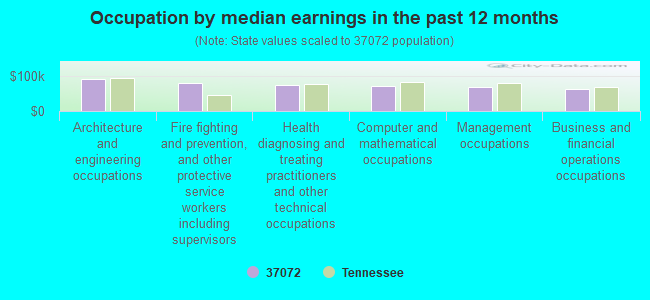
Occupation by median earnings in the past 12 months ($)
91,751Architecture and engineering occupations
81,809Fire fighting and prevention, and other protective service workers including supervisors
74,140Health diagnosing and treating practitioners and other technical occupations
73,653Computer and mathematical occupations
69,907Management occupations
64,503Business and financial operations occupations
Companies with federal contracts located in this zip code (GOODLETTSVILLE, TN):
APPALACHIAN PIPELINE CONTRACTO (120 S THOMPSON LN; small business) : $123,662 in 2 contractsin 2004
$61,831 with Army for Mineral Construction Materials, Bulk. Taking place in MS. Signed on 2004-08-09. Completion date: 2004-09-20.
$61,831 with U.S. Army Corps of Engineers - civil program financing only for Mineral Construction Materials, Bulk. Taking place in MS. Signed on 2004-08-09. Completion date: 2004-09-20.
WALTER KENNEDY (5630 LICKTON PIKE; small business) : $61,240 in 12 contractsfrom 2003 to 2005
Contracts for Facilities Operations Support Services, Surveillance Services by Army, U.S. Army Corps of Engineers - civil program financing only Signed by year:2000: $0; 2001: $0; 2002: $0; 2003: $42,460; 2004: $440; 2005: $18,340; 2006: $0.
Biggest contracts:
$21,230 with Army for Facilities Operations Support Services. Taking place in KY. Signed on 2003-12-30. Completion date: 2004-10-28.
$21,230 with U.S. Army Corps of Engineers - civil program financing only for Facilities Operations Support Services. Taking place in KY. Signed on 2003-12-30. Completion date: 2004-10-28.
$7,755 with U.S. Army Corps of Engineers - civil program financing only for Surveillance Services. Signed on 2005-03-10. Completion date: 2005-04-01.
$7,755 with Army for Surveillance Services. Signed on 2005-03-10. Completion date: 2005-04-01.
J & M TRADING, INC (409 SPACE PARK N) : $30,102 in 2 contractsin 2006
$28,500 with Army for Medical and Surgical Instruments, Equipment, and Supplies. Signed on 2006-02-16. Completion date: 2006-03-10.
$1,602, same as above.Signed on 2006-04-07. Completion date: 2006-03-10.
UNITED MACHINE & TOOL CO INC (215 CONNELL ST) : $27,758 in 6 contractsfrom 2004 to 2005
Contracts for Structural Shapes, Nonferrous Base Metal, Miscellaneous Items, Maintenance, Repair and Rebuilding of Equipment -- Miscellaneous by U.S. Army Corps of Engineers - civil program financing only, Army Signed by year:2000: $0; 2001: $0; 2002: $0; 2003: $0; 2004: $12,910; 2005: $14,848; 2006: $0.
Biggest contracts:
$6,455 with U.S. Army Corps of Engineers - civil program financing only for Structural Shapes, Nonferrous Base Metal. Signed on 2004-05-28. Completion date: 2004-06-04.
$6,455 with Army for Structural Shapes, Nonferrous Base Metal. Signed on 2004-05-28. Completion date: 2004-06-04.
$4,250 with U.S. Army Corps of Engineers - civil program financing only for Miscellaneous Items. Signed on 2005-08-29. Completion date: 2005-09-16.
$4,250 with Army for Miscellaneous Items. Signed on 2005-08-29. Completion date: 2005-09-16.
BLACKHAWK AUDIO INC (414 SPACE PARK N; small business)
$16,750 with Army for Audio/Visual Services. Taking place in KY. Signed on 2004-09-26. Completion date: 2004-09-14.
DESTINATION NASHVILLE INC (835 WREN RD; small business)
$10,115 with Army for Travel Agent Services. Signed on 2005-05-19. Completion date: 2005-05-28.
TOWN CLEANERS (311 S MAIN ST; small business)
$2,270 with Army for Laundry and DryCleaning Services. Signed on 2004-11-24. Completion date: 2005-09-30.
Top industries in this zip code by the number of employees in 2005:
Other Services (except Public Administration): Religious Organizations (500-999 employees: 1 establishment, 20-49 employees: 2 establishments, 10-19 employees: 3 establishments, 5-9 employees: 4 establishments, 1-4 employees: 5 establishments)
Management of Companies and Enterprises: Corporate, Subsidiary, and Regional Managing Offices (500-999: 1, 20-49: 2, 1-4: 4)
2002 - 2018 National Fire Incident Reporting System (NFIRS) incidents
According to the data from the years 2002 - 2018 the average number of fires per year is 115. The highest number of reported fires - 187 took place in 2007, and the least - 73 in 2013. The data has a decreasing trend.
When looking into fire subcategories, the most reports belonged to: Outside Fires (42.6%), and Structure Fires (27.6%).
Fire incident types reported to NFIRS in Zip Code 37072

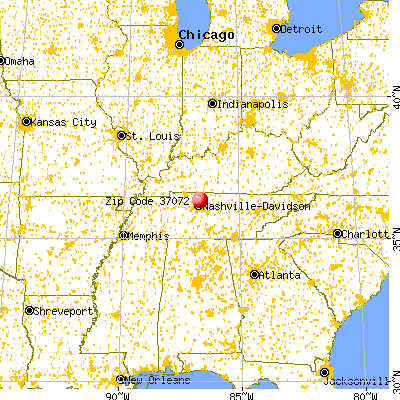


 Nearest zip codes: 37189, 37073, 37115, 37207, 37216, 37075.
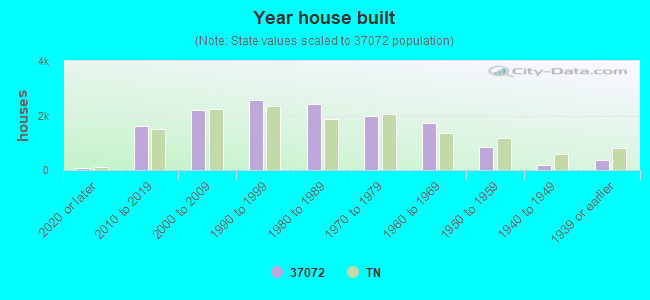


 According to the data from the years 2002 - 2018 the average number of fires per year is 115. The highest number of reported fires - 187 took place in 2007, and the least - 73 in 2013. The data has a decreasing trend.
 When looking into fire subcategories, the most reports belonged to: Outside Fires (42.6%), and Structure Fires (27.6%).