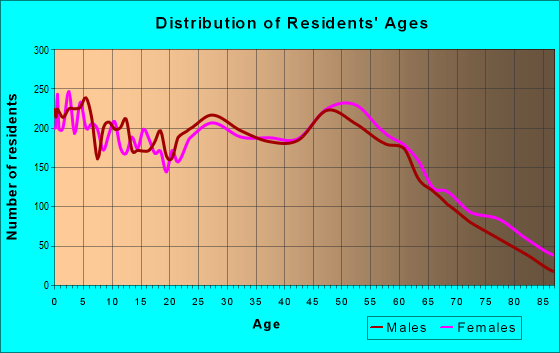
Estimated zip code population in 2022: 31,747 Zip code population in 2010: 28,714 Zip code population in 2000: 25,094
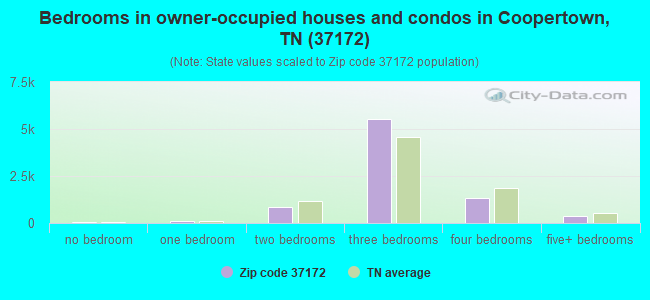
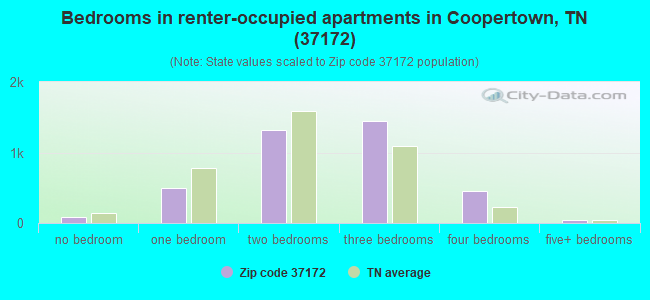
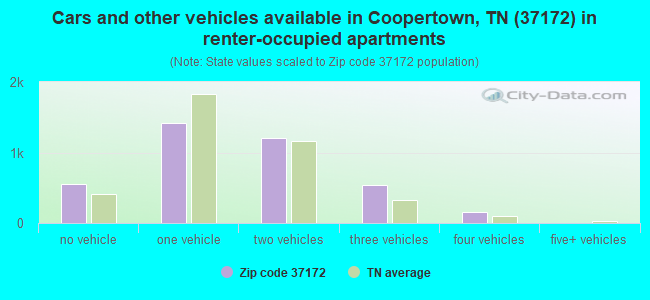
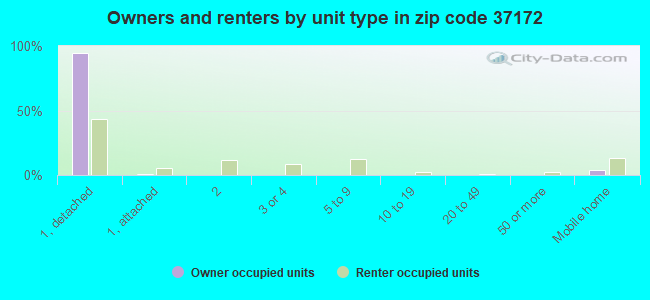
Houses and condos: 12,585 Renter-occupied apartments: 3,870
% of renters here:
32%
State:
33%
March 2022 cost of living index in zip code 37172: 88.8 (less than average, U.S. average is 100)
Land area: 181.0 sq. mi. Water area: 0.1 sq. mi.
Population density: 175 people per square mile
(very low).
OSM Map
General Map
Google Map
MSN Map
OSM Map
General Map
Google Map
MSN Map
OSM Map
General Map
Google Map
MSN Map
OSM Map
General Map
Google Map
MSN Map
Please wait while loading the map...
Real estate property taxes paid for housing units in 2022:
This zip code:
0.5% ($1,417)
Tennessee:
0.5% ($1,376)
Median real estate property taxes paid for housing units with mortgages in 2022: $1,457 (0.4%) Median real estate property taxes paid for housing units with no mortgage in 2022: $1,327 (0.5%)
Averages for the 2020 tax year for zip code 37172, filed in 2021:
Average Adjusted Gross Income (AGI) in 2020: $64,580 (Individual Income Tax Returns)
Here:
$64,580
State:
$69,014
Salary/wage: $47,875 (reported on 84.6% of returns)
Here:
$47,875
State:
$55,872
(% of AGI for various income ranges: 1236.3% for AGIs below $25k, 3869.9% for AGIs $25k-50k, 6618.5% for AGIs $50k-75k, 9668.6% for AGIs $75k-100k, 17138.7% for AGIs $100k-200k, 60032.7% for AGIs over 200k)
Taxable interest for individuals: $1,385 (reported on 21.6% of returns)
This zip code:
$1,385
Tennessee:
$1,945
(% of AGI for various income ranges: 9.8% for AGIs below $25k, 12.9% for AGIs $25k-50k, 27.8% for AGIs $50k-75k, 51.9% for AGIs $75k-100k, 77.6% for AGIs $100k-200k, 1818.2% for AGIs over 200k)
Ordinary dividends: $3,999 (reported on 9.9% of returns)
Here:
$3,999
State:
$8,105
(% of AGI for various income ranges: 8.4% for AGIs below $25k, 15.6% for AGIs $25k-50k, 31.1% for AGIs $50k-75k, 84.1% for AGIs $75k-100k, 193.5% for AGIs $100k-200k, 1810.9% for AGIs over 200k)
Net capital gain/loss in AGI: +$70,397 (reported on 9.6% of returns)
Here:
+$70,397
State:
+$33,664
(% of AGI for various income ranges: 7.5% for AGIs below $25k, 14.3% for AGIs $25k-50k, 72.8% for AGIs $50k-75k, 222.1% for AGIs $75k-100k, 810.8% for AGIs $100k-200k, 81580.9% for AGIs over 200k)
Profit/loss from business: +$15,388 (reported on 17.6% of returns)
Here:
+$15,388
State:
+$18,991
(% of AGI for various income ranges: 165.4% for AGIs below $25k, 120.7% for AGIs $25k-50k, 266.6% for AGIs $50k-75k, 450.4% for AGIs $75k-100k, 945.1% for AGIs $100k-200k, 11670.9% for AGIs over 200k)
Taxable individual retirement arrangement distribution: $17,136 (reported on 5.8% of returns)
37172:
$17,136
Tennessee:
$20,036
(% of AGI for various income ranges: 33.8% for AGIs below $25k, 44.9% for AGIs $25k-50k, 141.7% for AGIs $50k-75k, 208.0% for AGIs $75k-100k, 551.9% for AGIs $100k-200k, 2400.9% for AGIs over 200k)
Self-employed (Keogh) retirement plans: $18,925 (reported on 0.3% of returns)
37172:
$18,925
Tennessee:
$28,955
(% of AGI for various income ranges: 688.2% for AGIs over 200k)
Total itemized deductions: $38,528 (reported on 4.0% of returns)
Here:
$38,528
State:
$40,136
(% of AGI for various income ranges: 21.3% for AGIs below $25k, 49.8% for AGIs $25k-50k, 117.0% for AGIs $50k-75k, 197.4% for AGIs $75k-100k, 662.9% for AGIs $100k-200k, 9653.6% for AGIs over 200k)
Charity contributions: $24,312 (reported on 3.3% of returns)
Here:
$24,312
State:
$19,852
(% of AGI for various income ranges: 2.3% for AGIs below $25k, 12.0% for AGIs $25k-50k, 28.4% for AGIs $50k-75k, 68.0% for AGIs $75k-100k, 258.5% for AGIs $100k-200k, 7394.5% for AGIs over 200k)
Taxes paid: $4,974 (reported on 3.8% of returns)
37172:
$4,974
State:
$6,038
(% of AGI for various income ranges: 2.5% for AGIs below $25k, 6.7% for AGIs $25k-50k, 15.1% for AGIs $50k-75k, 32.1% for AGIs $75k-100k, 104.4% for AGIs $100k-200k, 892.7% for AGIs over 200k)
Earned income credit: $2,372 (reported on 18.9% of returns)
Here:
$2,372
State:
$2,391
(% of AGI for various income ranges: 116.3% for AGIs below $25k, 69.1% for AGIs $25k-50k, 1.4% for AGIs $50k-75k)
Percentage of individuals using paid preparers for their 2020 taxes: 89.6%
Here:
90%
State:
93%
(% for various income ranges: 85.6% for AGIs below $25k, 90.1% for AGIs $25k-50k, 91.6% for AGIs $50k-75k, 93.5% for AGIs $75k-100k, 93.2% for AGIs $100k-200k, 94.7% for AGIs over 200k)
Averages for the 2012 tax year for zip code 37172, filed in 2013:
Average Adjusted Gross Income (AGI) in 2012: $43,261 (Individual Income Tax Returns)
Here:
$43,261
State:
$53,767
Salary/wage: $38,792 (reported on 87.6% of returns)
Here:
$38,792
State:
$45,421
(% of AGI for various income ranges: 79.7% for AGIs below $25k, 86.8% for AGIs $25k-50k, 80.5% for AGIs $50k-75k, 80.9% for AGIs $75k-100k, 76.0% for AGIs $100k-200k, 54.7% for AGIs over 200k)
Taxable interest for individuals: $1,290 (reported on 24.2% of returns)
This zip code:
$1,290
Tennessee:
$1,732
(% of AGI for various income ranges: 0.9% for AGIs below $25k, 0.5% for AGIs $25k-50k, 0.5% for AGIs $50k-75k, 0.7% for AGIs $75k-100k, 0.9% for AGIs $100k-200k, 1.4% for AGIs over 200k)
Ordinary dividends: $3,125 (reported on 10.0% of returns)
Here:
$3,125
State:
$6,739
(% of AGI for various income ranges: 0.6% for AGIs below $25k, 0.4% for AGIs $25k-50k, 0.6% for AGIs $50k-75k, 0.6% for AGIs $75k-100k, 0.7% for AGIs $100k-200k, 2.2% for AGIs over 200k)
Net capital gain/loss in AGI: +$7,007 (reported on 8.4% of returns)
Here:
+$7,007
State:
+$19,082
(% of AGI for various income ranges: 0.2% for AGIs below $25k, 0.3% for AGIs $25k-50k, 0.6% for AGIs $50k-75k, 1.0% for AGIs $75k-100k, 1.6% for AGIs $100k-200k, 6.8% for AGIs over 200k)
Profit/loss from business: +$13,645 (reported on 14.6% of returns)
Here:
+$13,645
State:
+$15,240
(% of AGI for various income ranges: 8.3% for AGIs below $25k, 3.2% for AGIs $25k-50k, 2.8% for AGIs $50k-75k, 4.0% for AGIs $75k-100k, 5.3% for AGIs $100k-200k, 6.3% for AGIs over 200k)
Taxable individual retirement arrangement distribution: $13,016 (reported on 6.4% of returns)
37172:
$13,016
Tennessee:
$15,505
(% of AGI for various income ranges: 1.7% for AGIs below $25k, 1.4% for AGIs $25k-50k, 1.7% for AGIs $50k-75k, 1.8% for AGIs $75k-100k, 3.3% for AGIs $100k-200k, 1.5% for AGIs over 200k)
Self-employment retirement plans: $17,150 (reported on 0.3% of returns)
37172:
$17,150
Tennessee:
$22,567
Total itemized deductions: $18,410 (22% of AGI, reported on 20.6% of returns)
Here:
$18,410
State:
$21,976
Here:
21.9% of AGI
State:
17.8% of AGI
(% of AGI for various income ranges: 5.7% for AGIs below $25k, 7.1% for AGIs $25k-50k, 9.8% for AGIs $50k-75k, 10.0% for AGIs $75k-100k, 10.7% for AGIs $100k-200k, 9.4% for AGIs over 200k)
Charity contributions: $5,703 (reported on 16.1% of returns)
Here:
$5,703
State:
$6,709
(% of AGI for various income ranges: 0.6% for AGIs below $25k, 1.1% for AGIs $25k-50k, 2.1% for AGIs $50k-75k, 2.4% for AGIs $75k-100k, 2.8% for AGIs $100k-200k, 5.0% for AGIs over 200k)
Taxes paid: $3,579 (reported on 20.4% of returns)
37172:
$3,579
State:
$4,829
(% of AGI for various income ranges: 0.9% for AGIs below $25k, 1.2% for AGIs $25k-50k, 1.8% for AGIs $50k-75k, 2.0% for AGIs $75k-100k, 2.4% for AGIs $100k-200k, 1.7% for AGIs over 200k)
Earned income credit: $2,312 (reported on 22.3% of returns)
Here:
$2,312
State:
$2,404
(% of AGI for various income ranges: 7.1% for AGIs below $25k, 1.3% for AGIs $25k-50k)
Percentage of individuals using paid preparers for their 2012 taxes: 51.0%
Here:
51%
State:
52%
(% for various income ranges: 48.0% for AGIs below $25k, 49.0% for AGIs $25k-50k, 52.5% for AGIs $50k-75k, 57.8% for AGIs $75k-100k, 63.6% for AGIs $100k-200k, 80.0% for AGIs over 200k)
Averages for the 2004 tax year for zip code 37172, filed in 2005:
Average Adjusted Gross Income (AGI) in 2004: $37,359 (Individual Income Tax Returns)
Here:
$37,359
State:
$44,088
Salary/wage: $34,877 (reported on 88.2% of returns)
Here:
$34,877
State:
$38,825
(% of AGI for various income ranges: 129.8% for AGIs below $10k, 83.1% for AGIs $10k-25k, 87.4% for AGIs $25k-50k, 86.1% for AGIs $50k-75k, 85.1% for AGIs $75k-100k, 66.7% for AGIs over 100k)
Taxable interest for individuals: $1,480 (reported on 32.1% of returns)
This zip code:
$1,480
Tennessee:
$1,802
(% of AGI for various income ranges: 6.8% for AGIs below $10k, 1.5% for AGIs $10k-25k, 0.8% for AGIs $25k-50k, 0.8% for AGIs $50k-75k, 1.0% for AGIs $75k-100k, 2.0% for AGIs over 100k)
Taxable dividends: $2,519 (reported on 13.0% of returns)
Here:
$2,519
State:
$3,727
(% of AGI for various income ranges: 3.1% for AGIs below $10k, 0.7% for AGIs $10k-25k, 0.4% for AGIs $25k-50k, 0.5% for AGIs $50k-75k, 0.5% for AGIs $75k-100k, 2.1% for AGIs over 100k)
Net capital gain/loss: +$7,646 (reported on 10.9% of returns)
Here:
+$7,646
State:
+$15,776
(% of AGI for various income ranges: 0.3% for AGIs below $10k, 0.4% for AGIs $10k-25k, 0.5% for AGIs $25k-50k, 0.7% for AGIs $50k-75k, 1.0% for AGIs $75k-100k, 7.9% for AGIs over 100k)
Profit/loss from business: +$11,053 (reported on 15.4% of returns)
Here:
+$11,053
State:
+$12,882
(% of AGI for various income ranges: -0.7% for AGIs below $10k, 5.4% for AGIs $10k-25k, 2.9% for AGIs $25k-50k, 2.8% for AGIs $50k-75k, 5.0% for AGIs $75k-100k, 7.8% for AGIs over 100k)
IRA payment deduction: $3,085 (reported on 1.6% of returns)
37172:
$3,085
Tennessee:
$2,934
(% of AGI for various income ranges: 0.1% for AGIs $10k-25k, 0.1% for AGIs $25k-50k, 0.2% for AGIs $50k-75k, 0.1% for AGIs $75k-100k, 0.1% for AGIs over 100k)
Self-employed pension: $11,521 (reported on 0.4% of returns)
Here:
$11,521
Tennessee:
$16,857
(% of AGI for various income ranges: 0.1% for AGIs $10k-25k, 0.2% for AGIs $75k-100k, 0.4% for AGIs over 100k)
Total itemized deductions: $15,563 (23% of AGI, reported on 24.5% of returns)
Here:
$15,563
State:
$18,035
Here:
23.0% of AGI
State:
19.9% of AGI
(% of AGI for various income ranges: 14.8% for AGIs below $10k, 6.9% for AGIs $10k-25k, 9.0% for AGIs $25k-50k, 11.4% for AGIs $50k-75k, 11.8% for AGIs $75k-100k, 10.9% for AGIs over 100k)
Charity contributions deductions: $4,140 (6% of AGI, reported on 20.2% of returns)
Here:
$4,140
State:
$5,167
Here:
5.8% of AGI
State:
5.3% of AGI
(% of AGI for various income ranges: 1.1% for AGIs below $10k, 1.1% for AGIs $10k-25k, 1.4% for AGIs $25k-50k, 2.2% for AGIs $50k-75k, 2.7% for AGIs $75k-100k, 3.7% for AGIs over 100k)
Total tax: $5,040 (reported on 72.4% of returns)
37172:
$5,040
State:
$7,482
(% of AGI for various income ranges: 4.2% for AGIs below $10k, 3.9% for AGIs $10k-25k, 6.5% for AGIs $25k-50k, 8.7% for AGIs $50k-75k, 10.9% for AGIs $75k-100k, 17.7% for AGIs over 100k)
Earned income credit: $1,726 (reported on 20.6% of returns)
Here:
$1,726
State:
$1,826
Percentage of individuals using paid preparers for their 2004 taxes: 62.2%
Here:
62%
State:
60%
(% for various income ranges: 57.2% for AGIs below $10k, 65.7% for AGIs $10k-25k, 61.2% for AGIs $25k-50k, 61.4% for AGIs $50k-75k, 58.8% for AGIs $75k-100k, 74.3% for AGIs over 100k)
Likely homosexual households (counted as self-reported same-sex unmarried-partner households)
Lesbian couples: 0.0% of all households
Gay men: 0.1% of all households
Household received Food Stamps/SNAP in the past 12 months: 1,447 Household did not receive Food Stamps/SNAP in the past 12 months: 10,688
Women who had a birth in the past 12 months: 448 (351 now married, 99 unmarried) Women who did not have a birth in the past 12 months: 6,633 (3,058 now married, 3,575 unmarried)
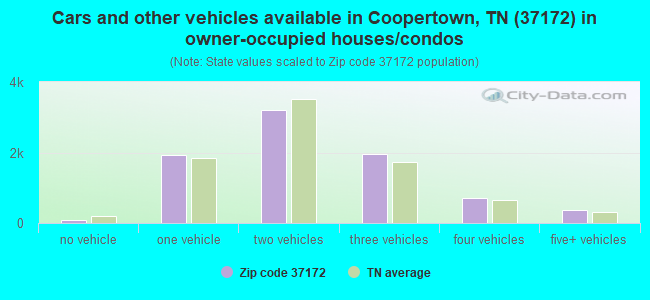
Housing units in zip code 37172 with a mortgage: 5,161 (539 second mortgage, 392 both second mortgage and home equity loan) Houses without a mortgage: 55
Median monthly owner costs for units with a mortgage: $1,444 Median monthly owner costs for units without a mortgage: $465
Residents with income below the poverty level in 2022:
This zip code:
14.4%
Whole state:
13.3%
Residents with income below 50% of the poverty level in 2022:
This zip code:
8.5%
Whole state:
7.1%
Median number of rooms in houses and condos:
Here:
6.3
State:
6.5
Median number of rooms in apartments:
Here:
5.0
State:
4.4
Notable locations in this zip code not listed on our city pages
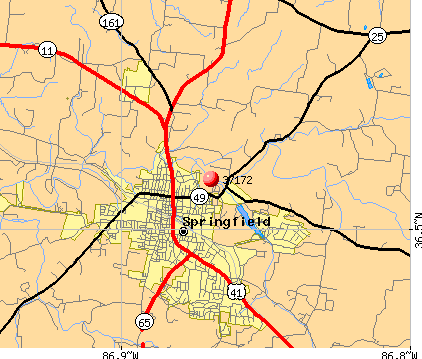
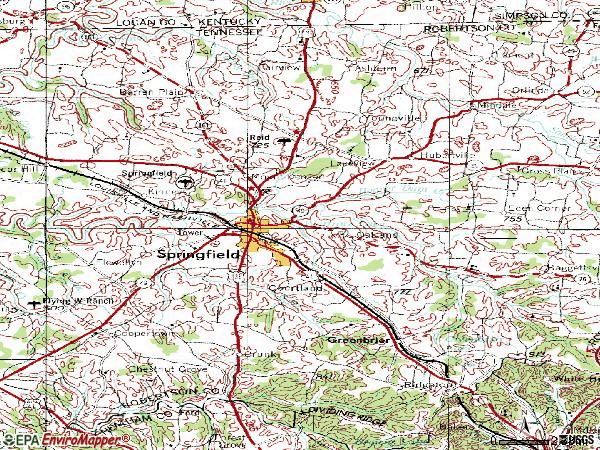
Notable locations in zip code 37172: Robertson County Landfill (A), Springfield Country Club (B), Robertson County Fairgrounds (C), Pleasant View Volunteer Fire Department Station 5 (D), Springfield Fire Department Station 2 (E), Springfield Fire Department Station 1 Headquarters (F), Springfield City Hall (G), Robertson County Courthouse (H), Robertson County EMS (I), First Call Ambulance Service Roberts (J). Display/hide their locations on the map
Churches in zip code 37172 include: Central Christian Church (A), Fairview Baptist Church (B), First Assembly of God Church (C), First Baptist Church (D), Greater South Baptist Church (E), Mount Olive Baptist Church (F), Our Lady of Lourdes Catholic Church (G), Faith Covenant Church (H), Frierson Chapel (I). Display/hide their locations on the map
Cemeteries: Samuel-Fisher Cemetery (1), Savage Cemetery (2), Shannon Cemetery (3), Janie Bell Cemetery (4), Jones Cemetery (5), White Cemetery (6), Williams Cemetery (7). Display/hide their locations on the map
Streams, rivers, and creeks: Long Branch (A), Hopewell Branch (B), Hood Branch (C), Wartrace Creek (D), Flat Branch (E), Carr Creek (F), Brushy Creek (G), Black Branch (H), Poorhouse Branch (I). Display/hide their locations on the map
In group quarters: 792 (-1 institutionalized population)
Size of family households: 3,650 2-persons, 2,188 3-persons, 1,718 4-persons, 761 5-persons, 261 6-persons, 161 7-or-more-persons
Size of nonfamily households: 2,717 1-person, 518 2-persons, 160 3-persons
4,848 married couples with children.
1,785 single-parent households (409 men, 1,376 women).
86.6% of residents of 37172 zip code speak English at home.
12.5% of residents speak Spanish at home (57% very well, 18% well, 15% not well, 10% not at all).
0.6% of residents speak other Indo-European language at home (96% very well, 3% well, 1% not well).
0.1% of residents speak Asian or Pacific Island language at home (100% very well).
0.3% of residents speak other language at home (100% very well).
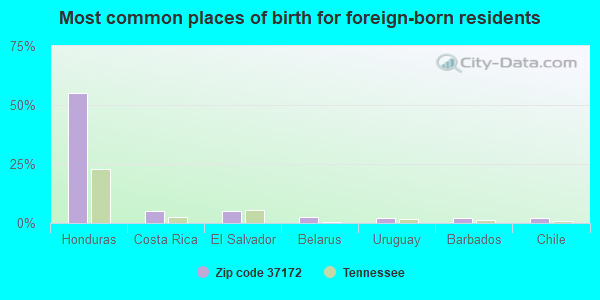
Foreign born population: 2,512 (7.9%) (33.5% of them are naturalized citizens)
This zip code:
7.9%
Whole state:
5.6%
55%Honduras
5%Costa Rica
5%El Salvador
3%Belarus
2%Uruguay
2%Barbados
2%Chile
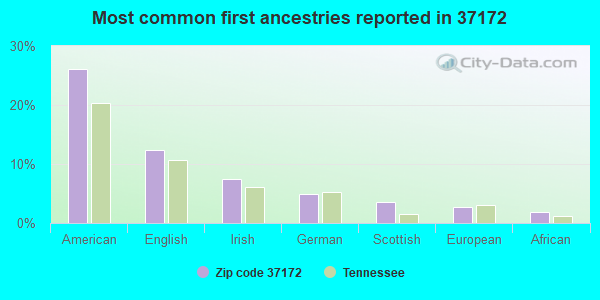
26%American
12%English
7%Irish
5%German
4%Scottish
3%European
2%African
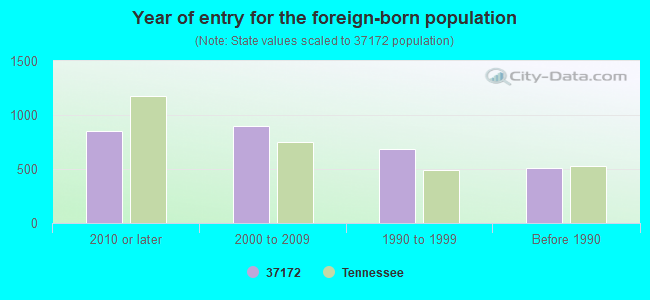
Year of entry for the foreign-born population
8502010 or later
9022000 to 2009
6851990 to 1999
505Before 1990
Major facilities with environmental interests located in this zip code:
CARLTON CLEANERS (201 10TH AVENUE EAST in SPRINGFIELD, TN)
AIR MINOR (AIRS/AFS) (Resource Conservation and Recovery Act (tracking hazardous waste)) Business SIC classification: COIN-OPERATED LAUNDRIES AND DRYCLEANING Alternative names: CARLTON'S CLEANERS
COOPERTOWN ELEMENTARY SCHOOL (3746 HWY 49 WEST in SPRINGFIELD, TN)
(Geographic Names Information System) (National Center for Education Statistics) - STATE ID-0025 Organizations: ROBERTSON COUNTY SCHOOL DIST (SCHOOL DISTRICT)
BRANSFORD ELEMENTARY SCHOOL (700 BRANSFORD DR in SPRINGFIELD, TN)
(National Center for Education Statistics) - STATE ID-0010 Organizations: ROBERTSON COUNTY SCHOOL DIST (SCHOOL DISTRICT)
CHEATHAM PARK ELEMENTARY (301 LOCUST ST in SPRINGFIELD, TN)
(National Center for Education Statistics) - STATE ID-0020 Organizations: ROBERTSON COUNTY SCHOOL DIST (SCHOOL DISTRICT)
DELIGHT PRODUCTS CO. (1200 IND. DR. in SPRINGFIELD, TN)
AIR MINOR (AIRS/AFS) Conditionally Exempt Small Quantity Generators, less than 100 kg/month of hazardous waste (Resource Conservation and Recovery Act (tracking hazardous waste)) TRI REPORTER (Tracking of toxic chemicals releasing facilities) Business SIC and NAICS classification: DOG AND CAT FOOD Organizations: GEORGE R. BUEHLER (CONTACT/OPERATOR)
, THE KROGER CO (CONTACT/OWNER)
, THE KROGER COMPANY (CONTACT/OWNER)
COLLINS & AIKMAN (801 BILL JONES DRIVE in SPRINGFIELD, TN)
AIR SYNTHETIC MINOR (AIRS/AFS) CRITERIA AND HAZARDOUS AIR POLLUTANT INVENTORY (Inventory of air pollution sources) HAZARDOUS WASTE BIENNIAL REPORTER (Resource Conservation and Recovery Act (tracking hazardous waste)) Small Quantity Generators, between 100 kg and 1000 kg of hazardous waste/month (Resource Conservation and Recovery Act (tracking hazardous waste)) TRI REPORTER (Tracking of toxic chemicals releasing facilities) Business SIC classification: AUTOMOTIVE TRIMMINGS, APPAREL FINDINGS, AND RELATED PRODUCTS; PLASTICS FOAM PRODUCTS; MOTOR VEHICLE PARTS AND ACCESSORIES Organizations: DAVE BOBAK (CONTACT/OPERATOR)
, COLLINS AND AIKMAN ACOUSTICS INC (CONTACT/OWNER)
Alternative names: COLLINS & AIKMAN CARPET & ACCOUSTICA GP, COLLINS & AIKMAN CARPET & ACCOUSTICS (TN) INC., COLLINS AND AIKMAN CARPET AND ACOUSTICS
CUMBERLAND RIVER PROPANE GAS, INC. (4855 HWY 431 N in SPRINGFIELD, TN)
(Integrated Compliance Information System) - ICIS-04-2001-9030, FORMAL ENFORCEMENT ACTION Business SIC classification: COMBINATION UTILITIES
ALL AMERICAN HOMES OF TENNESSEE INCORPORATED (102 EVERGREEN DRIVE in SPRINGFIELD, TN)
AIR MINOR (AIRS/AFS) TRI REPORTER (Tracking of toxic chemicals releasing facilities) Business SIC classification: GENERAL CONTRACTORS-SINGLE-FAMILY HOUSES; PREFABRICATED WOOD BUILDINGS AND COMPONENTS
AMERICAN CANDLE & GIFT (P O BOX 276 in SPRINGFIELD, TN)
(Resource Conservation and Recovery Act (tracking hazardous waste)) Business NAICS classification: ALL OTHER MISCELLANEOUS MANUFACTURING.
AMERICAN LIMESTONE 1 (ADAIRVILLE PIKE in SPRINGFIELD, TN)
AIR MINOR (AIRS/AFS) Business SIC classification: CRUSHED AND BROKEN LIMESTONE
APAC-TENNESSEE INC (HWY 41 S in SPRINGFIELD, TN)
AIR MINOR (AIRS/AFS) Business SIC classification: ASPHALT PAVING MIXTURES AND BLOCKS
B & M PRODUCTS CO (PO BOX 213 in SPRINGFIELD, TN)
(Resource Conservation and Recovery Act (tracking hazardous waste)) Business NAICS classification: POLISH AND OTHER SANITATION GOOD MANUFACTURING.; ALL OTHER MISCELLANEOUS CHEMICAL PRODUCT AND PREPARATION MANUFACTURING.
BARBEE TOOL & DIE (HIGHWAY 41 SOUTH in SPRINGFIELD, TN)
(Resource Conservation and Recovery Act (tracking hazardous waste)) Business NAICS classification: SPECIAL DIE AND TOOL, DIE SET, JIG, AND FIXTURE MANUFACTURING.
Housing units lacking complete plumbing facilities: 0.6% Housing units lacking complete kitchen facilities: 1.1%
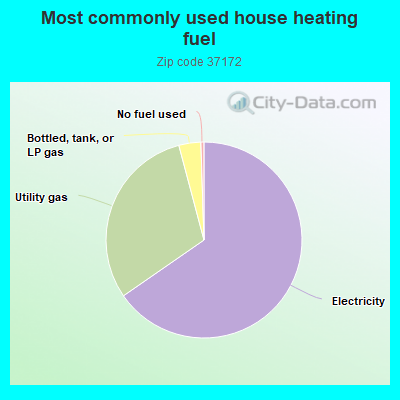
64.9%Electricity
30.3%Utility gas
3.6%Bottled, tank, or LP gas
0.5%No fuel used
Population in 1990: 21,214. Population change in the 1990s: +3,880 (+18.3%).
Place of birth for U.S.-born residents:
This state: 20,135
Northeast: 697
Midwest: 2,507
South: 4,232
West: 1,086
57% of the 37172 zip code residents lived in the same house 5 years ago. Out of people who lived in different houses, 55% lived in this county. Out of people who lived in different counties, 50% lived in Tennessee.
90% of the 37172 zip code residents lived in the same house 1 year ago. Out of people who lived in different houses, 48% moved from this county. Out of people who lived in different houses, 34% moved from different county within same state. Out of people who lived in different houses, 15% moved from different state. Out of people who lived in different houses, 3% moved from abroad.
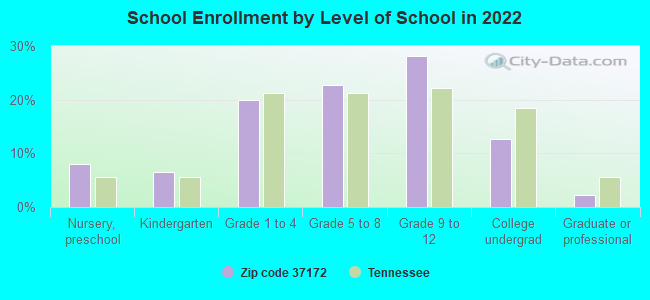
Private vs. public school enrollment:
Students in private schools in grades 1 to 8 (elementary and middle school): 341
Here:
11.9%
Tennessee:
15.0%
Students in private schools in grades 9 to 12 (high school): 478
Here:
24.9%
Tennessee:
16.2%
Students in private undergraduate colleges: 152
Here:
17.7%
Tennessee:
23.5%
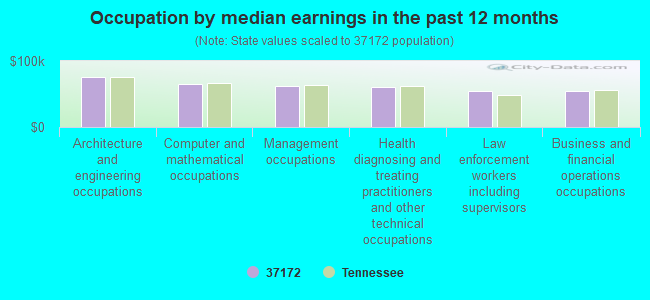
Occupation by median earnings in the past 12 months ($)
76,097Architecture and engineering occupations
65,331Computer and mathematical occupations
61,583Management occupations
61,150Health diagnosing and treating practitioners and other technical occupations
55,042Law enforcement workers including supervisors
54,481Business and financial operations occupations
Companies with federal contracts located in this zip code (SPRINGFIELD, TN):
BENTLEY, SONJA A DDS (205 5TH AVE W; small business) : $13,815 in 3 contractsin 2004
$9,015 with Army for Dentistry Services. Signed on 2004-06-02. Completion date: 2004-06-18.
$4,650, same as above.Signed on 2004-04-20. Completion date: 2004-04-02.
$150, same as above.Signed on 2004-05-13. Completion date: 2004-04-02.
BEVERLY ENTERPRISES, INC (2504 S MAIN ST) : $11,000 in 2 contractsfrom 2001 to 2002
$6,000 with Department of Veterans Affairs for Nursing Home Care Contracts. Signed on 2001-04-15. Completion date: 2001-06-15.
$5,000, same as above.Signed on 2002-01-15. Completion date: 2002-03-15.
AGRILIANCE LLC (5018 HWY 41 NORTH; small business) : $8,010 in 2 contractsin 2005
$4,005 with Army for Pest Control Agents and Disinfectants. Signed on 2005-09-28. Completion date: 2005-09-30.
$4,005 with U.S. Army Corps of Engineers - civil program financing only for Pest Control Agents and Disinfectants. Signed on 2005-09-28. Completion date: 2005-09-30.
B & B MACHINE COMPANY (3016 HWY 41 S; small business)
$5,560 with Army for Maintenance, Repair and Rebuilding of Equipment -- Materials Handling Equipment. Signed on 2006-05-15. Completion date: 2006-05-17.
MC CARROLL COMPANY INC (100 MOORELAND DRIVE; small business)
$3,893 with U.S. Army Corps of Engineers - civil program financing only for Air Conditioning Equipment. Signed on 2003-04-15. Completion date: 2003-04-15.
Top industries in this zip code by the number of employees in 2005:
Health Care and Social Assistance: General Medical and Surgical Hospitals (500-999 employees: 1 establishment)
2002 - 2018 National Fire Incident Reporting System (NFIRS) incidents
According to the data from the years 2002 - 2018 the average number of fires per year is 150. The highest number of fires - 224 took place in 2005, and the least - 105 in 2002. The data has an increasing trend.
When looking into fire subcategories, the most incidents belonged to: Outside Fires (45.3%), and Structure Fires (32.9%).
Fire incident types reported to NFIRS in Zip Code 37172


 Nearest zip codes: 37073, 42202, 37032, 37141, 37188, 37049.
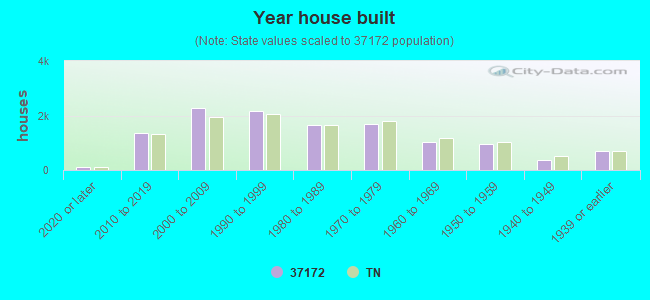


 According to the data from the years 2002 - 2018 the average number of fires per year is 150. The highest number of fires - 224 took place in 2005, and the least - 105 in 2002. The data has an increasing trend.
 When looking into fire subcategories, the most incidents belonged to: Outside Fires (45.3%), and Structure Fires (32.9%).