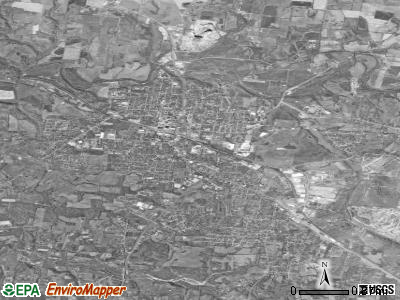
Springfield, Tennessee
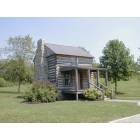
Springfield: Log home located in J. Travis Park, Springfield, TN. Home of Joseph and Nancy Ann Hart in 1794.
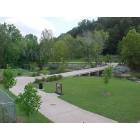
Springfield: Springfield Greenway

Springfield: Robertson County Courthouse

Springfield: Rainbow takend after rain on July 4, 2008
- add
your
Submit your own pictures of this city and show them to the world
- OSM Map
- General Map
- Google Map
- MSN Map
Population change since 2000: +34.1%
 |
| Males: 9,405 | |
| Females: 9,816 |
| Median resident age: | 32.9 years |
| Tennessee median age: | 39.2 years |
Zip codes: 37172.
| Springfield: | $58,912 |
| TN: | $65,254 |
Estimated per capita income in 2022: $25,530 (it was $17,322 in 2000)
Springfield city income, earnings, and wages data
Estimated median house or condo value in 2022: $265,409 (it was $88,700 in 2000)
| Springfield: | $265,409 |
| TN: | $284,800 |
Mean prices in 2022: all housing units: $255,728; detached houses: $258,204; townhouses or other attached units: $178,854; in 3-to-4-unit structures: $167,004; in 5-or-more-unit structures: $289,211; mobile homes: $91,257
Median gross rent in 2022: $1,159.
(16.5% for White Non-Hispanic residents, 16.1% for Black residents, 35.3% for Hispanic or Latino residents, 29.6% for American Indian residents, 38.6% for other race residents, 28.9% for two or more races residents)
Detailed information about poverty and poor residents in Springfield, TN

Compare current foreclosures in Springfield, TN:
| Photo | Address | Area | Beds / Baths | Price | Details |
|---|---|---|---|---|---|

|
#1
Highway 431 N
Springfield, TN 37172
|
1,456 sq. feet
|
2 baths - beds |
show details | |

|
#2
Brookside Pt
Springfield, TN 37172
|
1,165 sq. feet
|
2 baths - beds |
show details | |

|
#3
Barren Plains Rd
Springfield, TN 37172
|
896 sq. feet
|
1 baths - beds |
show details | |

|
#4
Stevenson Ln
Springfield, TN 37172
|
708 sq. feet
|
1 baths - beds |
show details | |

|
#5
Golf Club Ln
Springfield, TN 37172
|
1,652 sq. feet
|
1 baths - beds |
show details | |

|
#6
Oregon Rd
Springfield, TN 37172
|
1,404 sq. feet
|
2 baths - beds |
show details | |

|
#7
Ashburn Rd
Springfield, TN 37172
|
1,324 sq. feet
|
1 baths - beds |
show details | |

|
#8
Gunn Rd
Springfield, TN 37172
|
4,417 sq. feet
|
4 baths - beds |
show details | |

|
#9
Pitt Ave
Springfield, TN 37172
|
880 sq. feet
|
1 baths - beds |
show details | |

|
#10
Elder Dr
Springfield, TN 37172
|
1,869 sq. feet
|
2 baths - beds |
show details |
| Photo | Address | Area | Beds / Baths | Price | Details |
|---|---|---|---|---|---|

|
#11
8th Ave E
Springfield, TN 37172
|
1,296 sq. feet
|
2 baths - beds |
show details | |

|
#12
Gallop Ln
Springfield, TN 37172
|
1,264 sq. feet
|
2 baths - beds |
show details | |

|
#13
Hickory Dr
Springfield, TN 37172
|
1,260 sq. feet
|
1 baths - beds |
show details | |

|
#14
Phillip Dr
Springfield, TN 37172
|
1,024 sq. feet
|
2 baths - beds |
show details | |

|
#15
S Pawnee Dr
Springfield, TN 37172
|
2,400 sq. feet
|
2 baths - beds |
show details | |

|
#16
Beechwood Dr
Springfield, TN 37172
|
1,109 sq. feet
|
1 baths - beds |
show details | |

|
#17
Fischer Dr
Springfield, TN 37172
|
1,100 sq. feet
|
2 baths - beds |
show details | |

|
#18
Harding Pl
Springfield, TN 37172
|
1,336 sq. feet
|
2 baths - beds |
show details | |

|
#19
Baggett Rd
Springfield, TN 37172
|
868 sq. feet
|
1 baths - beds |
show details | |

|
#20
8th Ave E
Springfield, TN 37172
|
1,100 sq. feet
|
1 baths - beds |
show details |
| Photo | Address | Area | Beds / Baths | Price | Details |
|---|---|---|---|---|---|

|
#21
Lakeside Dr
Springfield, TN 37172
|
2,380 sq. feet
|
2 baths - beds |
show details | |

|
#22
Josephine St
Springfield, TN 37172
|
1,350 sq. feet
|
2 baths - beds |
show details | |

|
#23
Armstrong Rd
Springfield, TN 37172
|
1,296 sq. feet
|
2 baths - beds |
show details | |

|
#24
Phillip Dr
Springfield, TN 37172
|
1,144 sq. feet
|
2 baths - beds |
show details | |

|
#25
10th Ave E
Springfield, TN 37172
|
1,100 sq. feet
|
1 baths - beds |
show details | |

|
#26
Filly Ln
Springfield, TN 37172
|
1,194 sq. feet
|
2 baths - beds |
show details | |

|
#27
Walnut St
Springfield, TN 37172
|
1,190 sq. feet
|
1 baths - beds |
show details | |

|
#28
Spruce St
Springfield, TN 37172
|
1,025 sq. feet
|
2 baths - beds |
show details | |

|
#29
Green Hills Dr
Springfield, TN 37172
|
1,234 sq. feet
|
2 baths - beds |
show details | |

|
#30
N Oak St
Springfield, TN 37172
|
4,396 sq. feet
|
2 baths - beds |
show details |
| Photo | Address | Area | Beds / Baths | Price | Details |
|---|---|---|---|---|---|

|
#31
Sleepy Hollow Dr
Springfield, TN 37172
|
1,900 sq. feet
|
2 baths - beds |
show details | |

|
#32
Hillside Dr
Springfield, TN 37172
|
2,050 sq. feet
|
2 baths - beds |
show details | |

|
#33
N Main St
Springfield, TN 37172
|
3,462 sq. feet
|
2 baths - beds |
show details | |

|
#34
Fieldstone Ln
Springfield, TN 37172
|
1,860 sq. feet
|
3 baths - beds |
show details | |

|
#35
Gum Station Rd
Springfield, TN 37172
|
1,300 sq. feet
|
1 baths - beds |
show details | |

|
#36
Concord Rd
Springfield, TN 37172
|
- sq. feet
|
- baths - beds |
show details | |

|
#37
Ledding Rd
Springfield, TN 37172
|
- sq. feet
|
- baths - beds |
show details | |

|
#38
18th Ave E
Springfield, TN 37172
|
- sq. feet
|
- baths - beds |
show details | |

|
#39
Dove Ln
Springfield, TN 37172
|
- sq. feet
|
- baths - beds |
show details | |

|
#40
Phillip Dr
Springfield, TN 37172
|
- sq. feet
|
- baths - beds |
show details |
| Photo | Address | Area | Beds / Baths | Price | Details |
|---|---|---|---|---|---|

|
#41
Blackpatch Dr Apt E203
Springfield, TN 37172
|
- sq. feet
|
- baths - beds |
show details | |

|
#42
5th Ave W
Springfield, TN 37172
|
- sq. feet
|
- baths - beds |
show details | |

|
#43
Highway 49 E
Springfield, TN 37172
|
- sq. feet
|
- baths - beds |
show details | |

|
#44
Golf Club Cir
Springfield, TN 37172
|
- sq. feet
|
- baths - beds |
show details | |

|
#45
Brookside Pt
Springfield, TN 37172
|
- sq. feet
|
- baths - beds |
show details | |

|
#46
Josephine St
Springfield, TN 37172
|
- sq. feet
|
- baths - beds |
show details | |

|
#47
5th Ave W Ste 19
Springfield, TN 37172
|
- sq. feet
|
- baths - beds |
show details | |

|
#48
Legacy Dr
Springfield, TN 37172
|
- sq. feet
|
- baths - beds |
show details | |

|
#49
5th Ave W Ste 36
Springfield, TN 37172
|
- sq. feet
|
- baths - beds |
show details | |

|
Check over 1 million property listings on Foreclosure.com!
|
browse all offers | |||


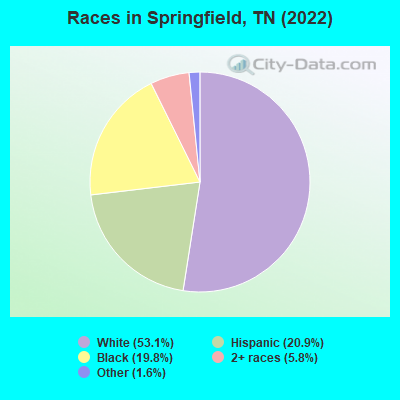
- 10,14953.1%White alone
- 3,99820.9%Hispanic
- 3,77719.8%Black alone
- 1,1165.8%Two or more races
- 3041.6%Other race alone
- 190.10%Asian alone
- 30.02%American Indian alone
- 20.01%Native Hawaiian and Other
Pacific Islander alone
Races in Springfield detailed stats: ancestries, foreign born residents, place of birth
According to our research of Tennessee and other state lists, there were 116 registered sex offenders living in Springfield, Tennessee as of April 27, 2024.
The ratio of all residents to sex offenders in Springfield is 146 to 1.
Type |
2009 |
2010 |
2011 |
2012 |
2013 |
2014 |
2015 |
2016 |
2017 |
2018 |
2019 |
2020 |
2021 |
2022 |
|---|---|---|---|---|---|---|---|---|---|---|---|---|---|---|
| Murders (per 100,000) | 1 (5.7) | 1 (6.1) | 4 (24.1) | 3 (17.9) | 3 (18.1) | 5 (29.9) | 0 (0.0) | 0 (0.0) | 2 (11.9) | 1 (5.9) | 1 (5.9) | 3 (17.3) | 5 (28.8) | 1 (5.2) |
| Rapes (per 100,000) | 16 (90.9) | 23 (139.9) | 14 (84.4) | 14 (83.5) | 12 (72.3) | 16 (95.8) | 17 (101.1) | 7 (41.5) | 6 (35.6) | 15 (88.8) | 7 (41.1) | 7 (40.3) | 4 (23.0) | 4 (20.7) |
| Robberies (per 100,000) | 53 (301.0) | 41 (249.4) | 36 (217.0) | 46 (274.2) | 18 (108.4) | 35 (209.6) | 41 (243.8) | 19 (112.6) | 17 (100.8) | 12 (71.0) | 5 (29.4) | 18 (103.6) | 2 (11.5) | 3 (15.5) |
| Assaults (per 100,000) | 142 (806.5) | 145 (882.0) | 107 (645.0) | 114 (679.5) | 132 (795.3) | 111 (664.8) | 79 (469.8) | 102 (604.5) | 128 (758.8) | 117 (692.5) | 102 (599.2) | 95 (546.9) | 79 (454.7) | 89 (460.4) |
| Burglaries (per 100,000) | 137 (778.1) | 88 (535.3) | 111 (669.2) | 122 (727.2) | 97 (584.4) | 59 (353.4) | 56 (333.0) | 53 (314.1) | 56 (332.0) | 45 (266.3) | 41 (240.9) | 25 (143.9) | 22 (126.6) | 16 (82.8) |
| Thefts (per 100,000) | 597 (3,391) | 486 (2,956) | 561 (3,382) | 635 (3,785) | 699 (4,211) | 714 (4,276) | 575 (3,419) | 482 (2,857) | 449 (2,662) | 453 (2,681) | 316 (1,856) | 320 (1,842) | 194 (1,117) | 182 (941.5) |
| Auto thefts (per 100,000) | 38 (215.8) | 33 (200.7) | 50 (301.4) | 26 (155.0) | 29 (174.7) | 23 (137.8) | 37 (220.0) | 18 (106.7) | 31 (183.8) | 35 (207.1) | 33 (193.9) | 42 (241.8) | 35 (201.5) | 33 (170.7) |
| Arson (per 100,000) | 10 (56.8) | 8 (48.7) | 6 (36.2) | 3 (17.9) | 3 (18.1) | 2 (12.0) | 1 (5.9) | 3 (17.8) | 1 (5.9) | 0 (0.0) | 2 (11.7) | 2 (11.5) | 0 (0.0) | 0 (0.0) |
| City-Data.com crime index | 543.0 | 547.1 | 516.1 | 535.4 | 508.9 | 539.2 | 425.6 | 332.7 | 378.6 | 385.1 | 279.9 | 310.3 | 240.0 | 180.8 |
The City-Data.com crime index weighs serious crimes and violent crimes more heavily. Higher means more crime, U.S. average is 246.1. It adjusts for the number of visitors and daily workers commuting into cities.
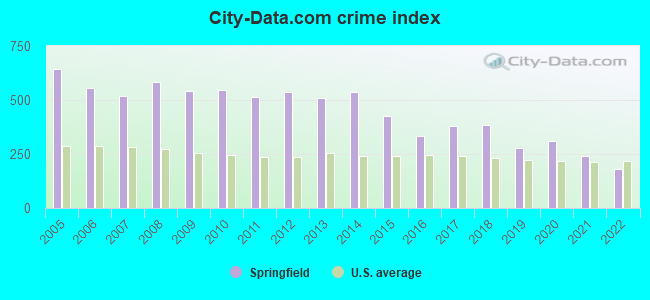
Crime rate in Springfield detailed stats: murders, rapes, robberies, assaults, burglaries, thefts, arson
Full-time law enforcement employees in 2021, including police officers: 38 (34 officers - 29 male; 5 female).
| Officers per 1,000 residents here: | 1.96 |
| Tennessee average: | 2.57 |
 Recent articles from our blog. Our writers, many of them Ph.D. graduates or candidates, create easy-to-read articles on a wide variety of topics.

 | Considering Springfield? (3 replies) |
| Crime Data on Springfield (0 replies) |
| Is Springfield the meth capital of Tenn? (14 replies) |
| Nashville Pictures (286 replies) |
| springfield (4 replies) |
| Humidity in TN vs CT or New England (10 replies) |
Latest news from Springfield, TN collected exclusively by city-data.com from local newspapers, TV, and radio stations
Springfield, TN City Guides:
Ancestries: American (21.5%), English (6.7%), African (5.2%), Irish (4.1%), German (3.2%), European (2.9%).
Current Local Time: CST time zone
Incorporated in 1796
Elevation: 677 feet
Land area: 12.2 square miles.
Population density: 1,575 people per square mile (low).
2,181 residents are foreign born (10.1% Latin America).
| This city: | 11.3% |
| Tennessee: | 5.4% |
Median real estate property taxes paid for housing units with mortgages in 2022: $1,312 (0.5%)
Median real estate property taxes paid for housing units with no mortgage in 2022: $1,368 (0.6%)
Nearest city with pop. 50,000+: Metropolitan Government, TN  (24.5 miles , pop. 569,891).
Nearest city with pop. 1,000,000+: Chicago, IL (371.9 miles , pop. 2,896,016).
Nearest cities:
), ), ), ), Latitude: 36.50 N, Longitude: 86.88 W
Daytime population change due to commuting: +3,458 (+17.9%)
Workers who live and work in this city: 4,229 (49.5%)
Area code: 615
Springfield, Tennessee accommodation & food services, waste management - Economy and Business Data
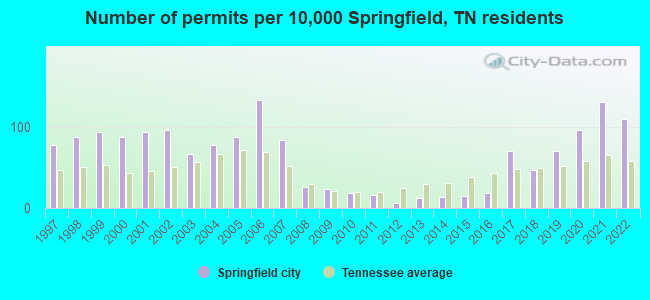
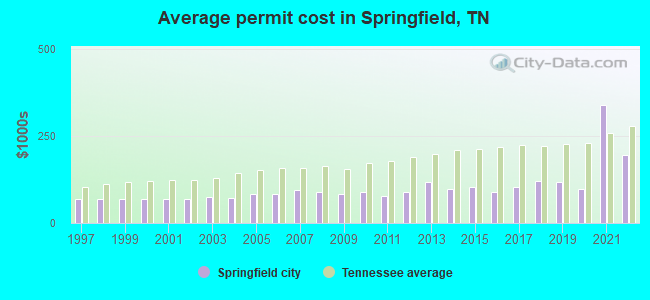
Single-family new house construction building permits:
- 2022: 156 buildings, average cost: $194,500
- 2021: 186 buildings, average cost: $340,900
- 2020: 138 buildings, average cost: $99,100
- 2019: 101 buildings, average cost: $117,800
- 2018: 67 buildings, average cost: $120,100
- 2017: 101 buildings, average cost: $104,900
- 2016: 26 buildings, average cost: $90,200
- 2015: 21 buildings, average cost: $105,000
- 2014: 20 buildings, average cost: $98,800
- 2013: 17 buildings, average cost: $117,000
- 2012: 8 buildings, average cost: $89,300
- 2011: 23 buildings, average cost: $78,300
- 2010: 26 buildings, average cost: $89,800
- 2009: 35 buildings, average cost: $82,500
- 2008: 37 buildings, average cost: $87,500
- 2007: 120 buildings, average cost: $93,900
- 2006: 191 buildings, average cost: $84,500
- 2005: 125 buildings, average cost: $82,600
- 2004: 110 buildings, average cost: $72,700
- 2003: 95 buildings, average cost: $74,800
- 2002: 137 buildings, average cost: $69,700
- 2001: 134 buildings, average cost: $70,000
- 2000: 126 buildings, average cost: $70,000
- 1999: 133 buildings, average cost: $70,000
- 1998: 125 buildings, average cost: $70,000
- 1997: 112 buildings, average cost: $70,000
| Here: | 2.5% |
| Tennessee: | 3.0% |
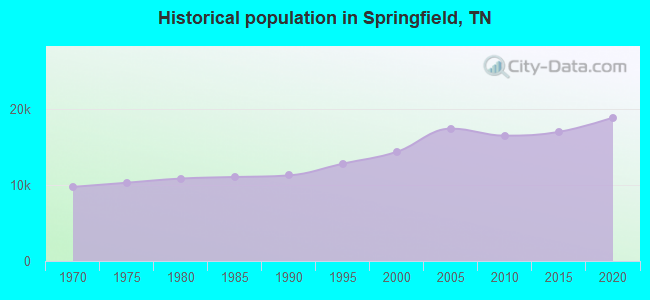
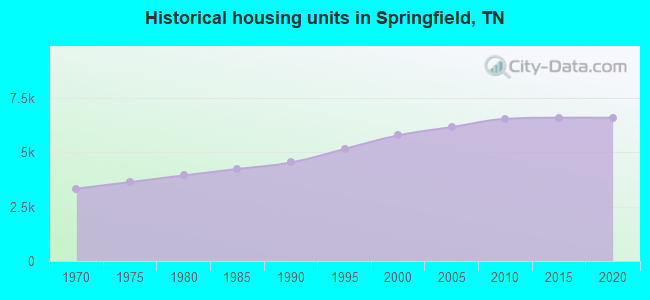
Population change in the 1990s: +2,138 (+17.5%).
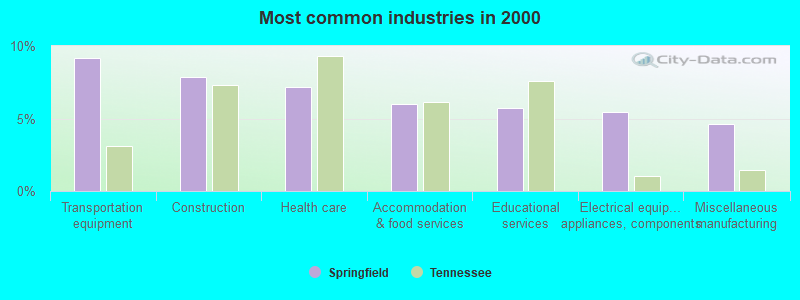
- Transportation equipment (9.1%)
- Construction (7.8%)
- Health care (7.1%)
- Accommodation & food services (6.0%)
- Educational services (5.8%)
- Electrical equipment, appliances, components (5.4%)
- Miscellaneous manufacturing (4.6%)
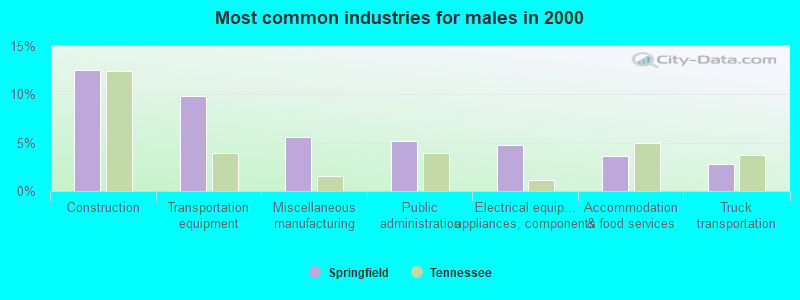
- Construction (12.5%)
- Transportation equipment (9.8%)
- Miscellaneous manufacturing (5.6%)
- Public administration (5.2%)
- Electrical equipment, appliances, components (4.8%)
- Accommodation & food services (3.7%)
- Truck transportation (2.8%)
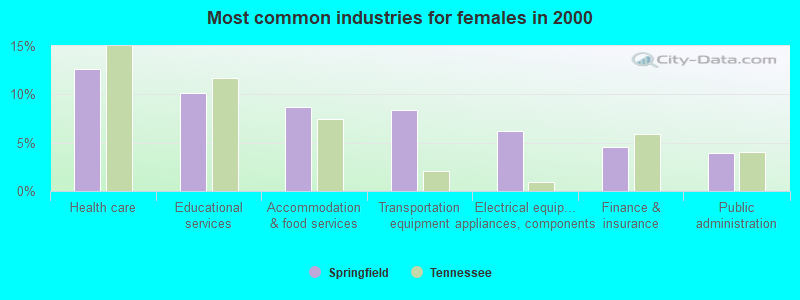
- Health care (12.6%)
- Educational services (10.2%)
- Accommodation & food services (8.6%)
- Transportation equipment (8.4%)
- Electrical equipment, appliances, components (6.2%)
- Finance & insurance (4.6%)
- Public administration (3.9%)
- Assemblers and fabricators (6.9%)
- Other production occupations, including supervisors (6.7%)
- Laborers and material movers, hand (5.3%)
- Other management occupations, except farmers and farm managers (4.0%)
- Other sales and related occupations, including supervisors (3.1%)
- Building and grounds cleaning and maintenance occupations (3.1%)
- Preschool, kindergarten, elementary, and middle school teachers (2.8%)
- Laborers and material movers, hand (7.8%)
- Other production occupations, including supervisors (7.1%)
- Assemblers and fabricators (5.9%)
- Other management occupations, except farmers and farm managers (5.2%)
- Driver/sales workers and truck drivers (4.4%)
- Metal workers and plastic workers (4.1%)
- Electrical equipment mechanics and other installation, maintenance, and repair workers, including supervisors (4.0%)
- Assemblers and fabricators (8.0%)
- Other production occupations, including supervisors (6.2%)
- Secretaries and administrative assistants (5.9%)
- Preschool, kindergarten, elementary, and middle school teachers (5.8%)
- Cashiers (4.2%)
- Other office and administrative support workers, including supervisors (4.1%)
- Health technologists and technicians (3.8%)
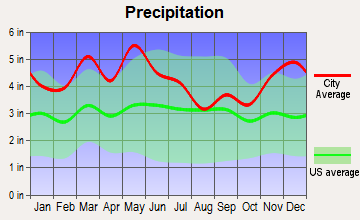
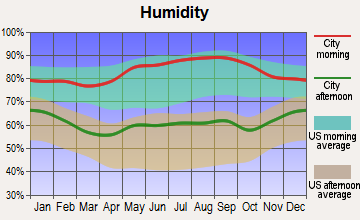
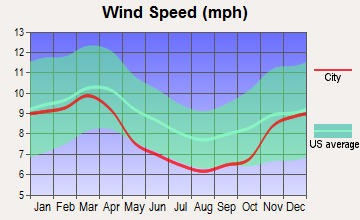
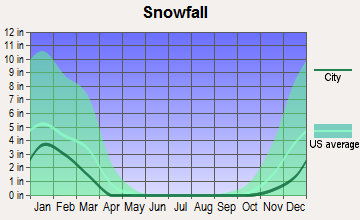
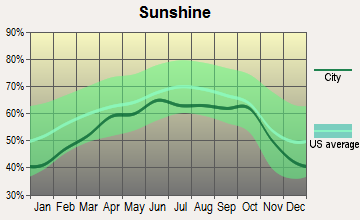
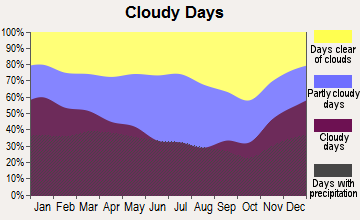
Average climate in Springfield, Tennessee
Based on data reported by over 4,000 weather stations
|
|

(lower is better)
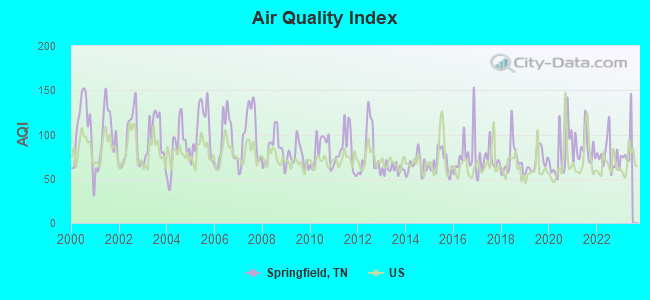
Air Quality Index (AQI) level in 2022 was 76.0. This is about average.
| City: | 76.0 |
| U.S.: | 72.6 |

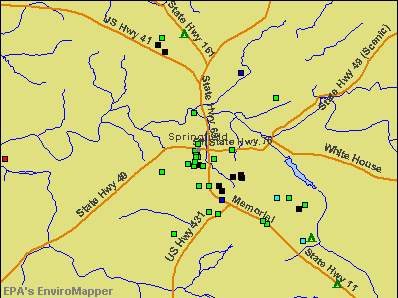
Carbon Monoxide (CO) [ppm] level in 2006 was 0.692. This is significantly worse than average. Closest monitor was 21.7 miles away from the city center.
| City: | 0.692 |
| U.S.: | 0.251 |
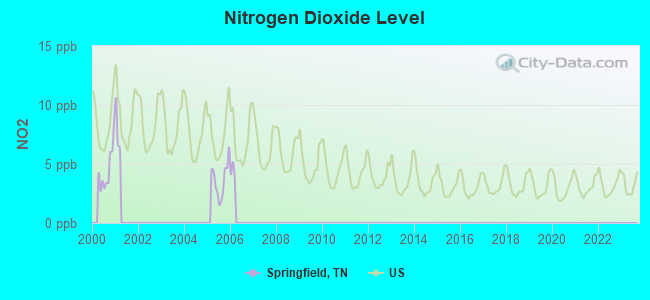
Nitrogen Dioxide (NO2) [ppb] level in 2005 was 3.65. This is significantly better than average. Closest monitor was 15.0 miles away from the city center.
| City: | 3.65 |
| U.S.: | 5.11 |
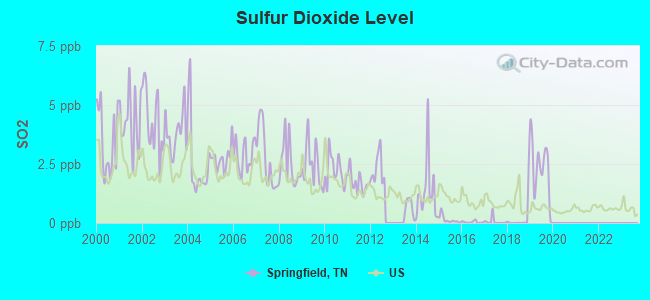
Sulfur Dioxide (SO2) [ppb] level in 2019 was 2.30. This is significantly worse than average. Closest monitor was 15.0 miles away from the city center.
| City: | 2.30 |
| U.S.: | 1.51 |

Ozone [ppb] level in 2022 was 27.4. This is better than average. Closest monitor was 17.8 miles away from the city center.
| City: | 27.4 |
| U.S.: | 33.3 |
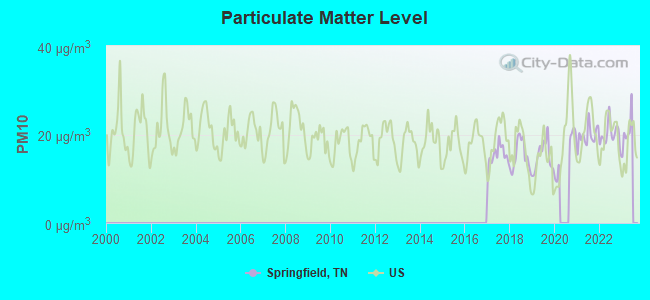
Particulate Matter (PM10) [µg/m3] level in 2022 was 20.0. This is about average. Closest monitor was 21.7 miles away from the city center.
| City: | 20.0 |
| U.S.: | 19.2 |
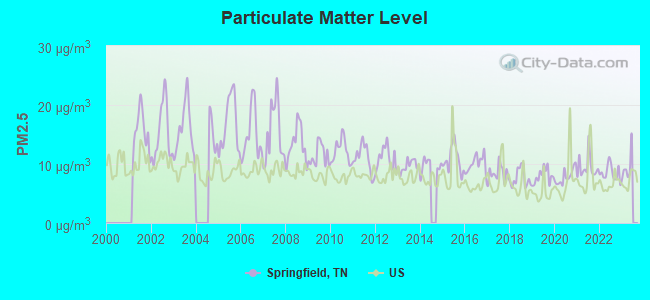
Particulate Matter (PM2.5) [µg/m3] level in 2022 was 8.50. This is about average. Closest monitor was 18.3 miles away from the city center.
| City: | 8.50 |
| U.S.: | 8.11 |
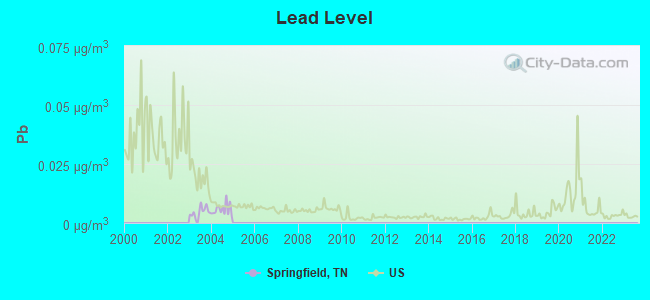
Lead (Pb) [µg/m3] level in 2004 was 0.00577. This is significantly better than average. Closest monitor was 0.8 miles away from the city center.
| City: | 0.00577 |
| U.S.: | 0.00931 |
Tornado activity:
Springfield-area historical tornado activity is slightly above Tennessee state average. It is 61% greater than the overall U.S. average.
On 4/27/1970, a category F4 (max. wind speeds 207-260 mph) tornado 14.4 miles away from the Springfield city center killed 3 people and injured 85 people and caused between $500,000 and $5,000,000 in damages.
On 4/16/1998, a category F3 (max. wind speeds 158-206 mph) tornado 9.2 miles away from the city center caused $400,000 in damages.
Earthquake activity:
Springfield-area historical earthquake activity is significantly above Tennessee state average. It is 202% greater than the overall U.S. average.On 4/18/2008 at 09:36:59, a magnitude 5.4 (5.1 MB, 4.8 MS, 5.4 MW, 5.2 MW, Class: Moderate, Intensity: VI - VII) earthquake occurred 145.9 miles away from the city center
On 4/18/2008 at 09:36:59, a magnitude 5.2 (5.2 MW, Depth: 8.9 mi) earthquake occurred 145.9 miles away from the city center
On 6/18/2002 at 17:37:15, a magnitude 5.0 (4.3 MB, 4.6 MW, 5.0 LG) earthquake occurred 114.2 miles away from Springfield center
On 6/10/1987 at 23:48:54, a magnitude 5.1 (4.9 MB, 4.4 MS, 4.6 MS, 5.1 LG) earthquake occurred 169.8 miles away from Springfield center
On 9/26/1990 at 13:18:51, a magnitude 5.0 (4.7 MB, 4.8 LG, 5.0 LG, Depth: 7.7 mi) earthquake occurred 154.1 miles away from the city center
On 7/27/1980 at 18:52:21, a magnitude 5.2 (5.1 MB, 4.7 MS, 5.0 UK, 5.2 UK) earthquake occurred 199.9 miles away from Springfield center
Magnitude types: regional Lg-wave magnitude (LG), body-wave magnitude (MB), surface-wave magnitude (MS), moment magnitude (MW)
Natural disasters:
The number of natural disasters in Robertson County (8) is smaller than the US average (15).Major Disasters (Presidential) Declared: 5
Emergencies Declared: 1
Causes of natural disasters: Floods: 5, Storms: 5, Tornadoes: 3, Flash Flood: 1, Hurricane: 1, Ice Storm: 1, Landslide: 1, Mudslide: 1, Wind: 1, Winter Storm: 1, Other: 1 (Note: some incidents may be assigned to more than one category).
Hospitals in Springfield:
- CARIS HEALTHCARE (2308A MEMORIAL BLVD)
- NORTH CREST HOME HEALTH AND HOSPICE (101 EAST MOORELAND DRIVE)
- NORTHCREST MEDICAL CENTER (Voluntary non-profit - Other, 100 NORTHCREST DRIVE)
- SALEM VILLAGES OF TN (718 CHEATHAM STREET)
- SALEM VILLAGES OF TN (307 W HILLCREST DRIVE)
Nursing Homes in Springfield:
- CHRISTIAN CARE CENTER OF SPRINGFIELD, LLC (704 5TH AVENUE EAST)
- GOLDEN LIVINGCENTER - SPRINGFIELD (104 WATSON ROAD)
- NHC HEALTHCARE, SPRINGFIELD (608 8TH AVE EAST)
- SPRINGFIELD HEALTH CARE FACILITY (608 8TH AVE)
Dialysis Facilities in Springfield:
Home Health Centers in Springfield:
Airports and heliports located in Springfield:
- Springfield Robertson County Airport (M91) (Runways: 1, Air Taxi Ops: 500, Itinerant Ops: 15,000, Local Ops: 29,200, Military Ops: 19,000)
- Foreman Field Airport (9TN4) (Runways: 1)
- Holenthawall Airport (3TN9) (Runways: 1)
- Nobuzzn Airport (8TN5) (Runways: 1)
- Northcrest Medical Center Heliport (TN00)
Colleges/universities with over 2000 students nearest to Springfield:
- Tennessee State University (about 24 miles; Nashville, TN; Full-time enrollment: 7,341)
- Volunteer State Community College (about 24 miles; Gallatin, TN; FT enrollment: 5,311)
- Vanderbilt University (about 25 miles; Nashville, TN; FT enrollment: 10,518)
- Nashville State Community College (about 26 miles; Nashville, TN; FT enrollment: 6,436)
- Trevecca Nazarene University (about 26 miles; Nashville, TN; FT enrollment: 2,223)
- Belmont University (about 26 miles; Nashville, TN; FT enrollment: 5,795)
- Austin Peay State University (about 27 miles; Clarksville, TN; FT enrollment: 8,621)
Public high schools in Springfield:
- SPRINGFIELD HIGH SCHOOL (Students: 981, Location: 5240 HWY 76 EAST, Grades: 9-12)
- ROBERTSON CO. VIRTUAL SCHOOL (Location: 800 MS COUTS BL, Grades: 7-12)
Private high school in Springfield:
Public elementary/middle schools in Springfield:
- COOPERTOWN ELEMENTARY (Students: 618, Location: 3746 HWY 49 WEST, Grades: KG-3)
- SPRINGFIELD MIDDLE SCHOOL (Students: 560, Location: 715 5TH AVENUE WEST, Grades: 6-8)
- CHEATHAM PARK ELEMENTARY (Students: 376, Location: 301 LOCUST ST, Grades: 1-5)
- KRISLE ELEMENTARY (Students: 342, Location: 6712 HWY 49 EAST, Grades: PK-5)
- COOPERTOWN MIDDLE SCHOOL (Students: 301, Location: 3820 HIGHWAY 49 WEST, Grades: 4-8)
- WESTSIDE ELEMENTARY (Location: 309 ALSUP DR, Grades: 1-5)
User-submitted facts and corrections:
- The official site for springfield gov... is www.springfield-tn.org
- The Springfield Country Club has been demolished to make way for a housing community to be built on the once used golf course.
Points of interest:
Notable locations in Springfield: Springfield Country Club (A), Robertson County Fairgrounds (B), Springfield Fire Department Station 2 (C), Springfield Fire Department Station 1 Headquarters (D), Springfield City Hall (E), Robertson County Courthouse (F), Robertson County EMS (G), First Call Ambulance Service Roberts (H). Display/hide their locations on the map
Churches in Springfield include: Central Christian Church (A), First Assembly of God Church (B), First Baptist Church (C), Greater South Baptist Church (D), Our Lady of Lourdes Catholic Church (E), Faith Covenant Church (F), Springfield Baptist Church (G), North Springfield Baptist Church (H), Mount Denson Cumberland Presbyterian Church (I). Display/hide their locations on the map
Cemeteries: White Cemetery (1), Mount Denson Cemetery (2), McIntosh Cemetery (3), Bell Cemetery (4), Duncan Cemetery (5), Chambliss Cemetery (6), Bell Cemetery (7). Display/hide their locations on the map
Streams, rivers, and creeks: Carr Creek (A), Black Branch (B). Display/hide their locations on the map
Tourist attractions: Robertson County History Museum (Cultural Attractions- Events- & Facilities; 124 6th Avenue West) (1), Sonny's Amusement CO (707 Willow Street) (2), Chamber of Commerce (100 5th Avenue West) (3). Display/hide their approximate locations on the map
Hotels: Best Western Springfield Inn (2001 Memorial Boulevard) (1), Hampton Inn Springfield- TN (620 22nd Avenue East) (2). Display/hide their approximate locations on the map
Courts: Robertson County - Judge General Sessions Court (531 South Brown Street) (1), Robertson County - Juvenile Court Clerk (529 South Brown Street) (2), Robertson County - Juvenile Court (531 South Brown Street) (3), Robertson County - Chancery Court Clerk (207 Courthouse) (4), County Services Information (207 Courthouse) (5), Robertson County - Clerk Of Circuit Court- Circuit Court Clerk (207 Courthouse) (6). Display/hide their approximate locations on the map
Birthplace of: Frank Royal - College football player (Middle Tenn. St. Blue Raiders).
Drinking water stations with addresses in Springfield and their reported violations in the past:
SPRINGFIELD WATER SYSTEM (Population served: 38,261, Surface water):Past monitoring violations:
- Single Turbidity Exceed (Enhanced SWTR) - In OCT-2013, Contaminant: IESWTR. Follow-up actions: St Public Notif received (NOV-12-2013), St Compliance achieved (NOV-30-2013), St Public Notif requested (DEC-02-2013), St Violation/Reminder Notice (2 times from DEC-02-2013 to FEB-18-2014)
- Single Turbidity Exceed (Enhanced SWTR) - In JAN-2012, Contaminant: IESWTR. Follow-up actions: St Public Notif requested (JAN-03-2012), St Violation/Reminder Notice (JAN-03-2012), St Public Notif received (JAN-25-2012), St Compliance achieved (FEB-29-2012), St Compliance Meeting conducted (MAR-27-2012)
- Monitoring, Repeat Major (TCR) - In DEC-2010, Contaminant: Coliform (TCR). Follow-up actions: St Compliance achieved (JAN-31-2011), St Public Notif requested (FEB-04-2011), St Violation/Reminder Notice (FEB-04-2011), St Public Notif received (MAY-11-2011)
| This city: | 2.6 people |
| Tennessee: | 2.5 people |
| This city: | 67.2% |
| Whole state: | 67.3% |
| This city: | 7.1% |
| Whole state: | 5.8% |
Likely homosexual households (counted as self-reported same-sex unmarried-partner households)
- Lesbian couples: 0.3% of all households
- Gay men: 0.3% of all households
People in group quarters in Springfield in 2010:
- 279 people in local jails and other municipal confinement facilities
- 278 people in nursing facilities/skilled-nursing facilities
- 20 people in group homes intended for adults
- 13 people in emergency and transitional shelters (with sleeping facilities) for people experiencing homelessness
People in group quarters in Springfield in 2000:
- 229 people in nursing homes
- 171 people in local jails and other confinement facilities (including police lockups)
- 15 people in other noninstitutional group quarters
Banks with most branches in Springfield (2011 data):
- The Farmers Bank: Springfield Branch at 1203 Memorial Boulevard, branch established on 1975/05/12; Tom Austin Highway - Springfield Off at 3490 Tom Austin Highway, branch established on 2009/08/24. Info updated 2007/09/05: Bank assets: $520.2 mil, Deposits: $433.0 mil, headquarters in Portland, TN, positive income, Commercial Lending Specialization, 10 total offices, Holding Company: First Farmers Bancshares, Inc.
- F&M Bank: Springfield Branch at 3519 Tom Austin Highway, branch established on 1995/03/10. Info updated 2007/01/30: Bank assets: $790.6 mil, Deposits: $644.4 mil, headquarters in Clarksville, TN, positive income, Commercial Lending Specialization, 21 total offices, Holding Company: F&M Financial Corporation
- U.S. Bank National Association: Springfield Branch at 2127 Memorial Boulevard, branch established on 1925/02/16. Info updated 2012/01/30: Bank assets: $330,470.8 mil, Deposits: $236,091.5 mil, headquarters in Cincinnati, OH, positive income, 3121 total offices, Holding Company: U.S. Bancorp
- Regions Bank: Springfield Tn at 3572 Tom Austin Highway, branch established on 1934/06/01. Info updated 2011/02/24: Bank assets: $123,368.2 mil, Deposits: $98,301.3 mil, headquarters in Birmingham, AL, positive income, Commercial Lending Specialization, 1778 total offices, Holding Company: Regions Financial Corporation
- Bank of America, National Association: Springfield Memorial Branch at 2021 Memorial Boulevard, branch established on 1988/06/13. Info updated 2009/11/18: Bank assets: $1,451,969.3 mil, Deposits: $1,077,176.8 mil, headquarters in Charlotte, NC, positive income, 5782 total offices, Holding Company: Bank Of America Corporation
- SunTrust Bank: Springfield Mm Branch - 824 at 2600 Memorial Boulevard, branch established on 1991/07/29. Info updated 2010/05/27: Bank assets: $171,291.7 mil, Deposits: $129,833.2 mil, headquarters in Atlanta, GA, positive income, Commercial Lending Specialization, 1716 total offices, Holding Company: Suntrust Banks, Inc.
- Commerce Union Bank: at 701 South Main Street, branch established on 2006/08/14. Info updated 2006/08/21: Bank assets: $208.9 mil, Deposits: $158.1 mil, local headquarters, positive income, Commercial Lending Specialization, 3 total offices
- Volunteer State Bank: Springfield Branch at 1310 Memorial Boulevard, branch established on 1987/02/23. Info updated 2006/11/03: Bank assets: $383.7 mil, Deposits: $311.8 mil, headquarters in Portland, TN, positive income, Commercial Lending Specialization, 9 total offices, Holding Company: Volunteer State Bancshares, Inc.
- Community Bank & Trust: Springfield Office/Branch Of Communi at 3564 Tom Austin Highway, branch established on 2005/04/18. Info updated 2006/11/03: Bank assets: $216.9 mil, Deposits: $181.0 mil, headquarters in Ashland City, TN, negative income in the last year, Commercial Lending Specialization, 5 total offices, Holding Company: Community Trust, Inc.
For population 15 years and over in Springfield:
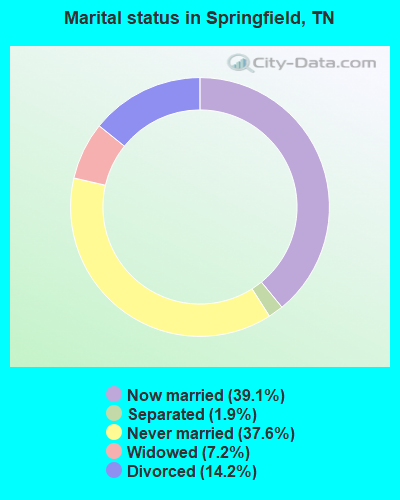
- Never married: 37.6%
- Now married: 39.1%
- Separated: 1.9%
- Widowed: 7.2%
- Divorced: 14.2%
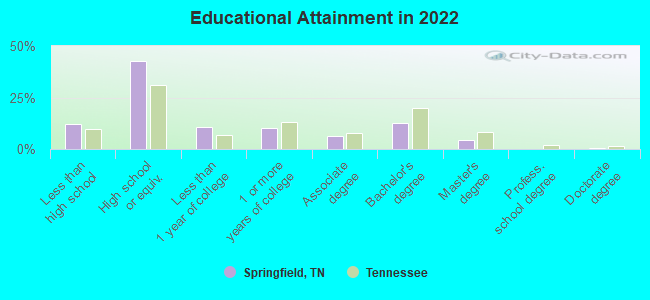
For population 25 years and over in Springfield:
- High school or higher: 85.9%
- Bachelor's degree or higher: 16.1%
- Graduate or professional degree: 4.4%
- Unemployed: 6.4%
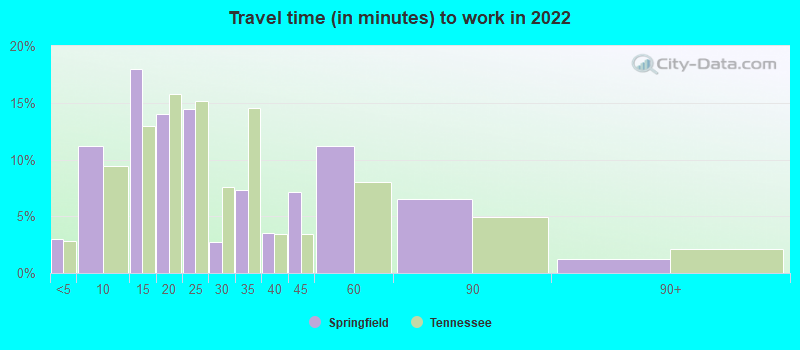
- Mean travel time to work (commute): 23.8 minutes
| Here: | 10.6 |
| Tennessee average: | 11.4 |
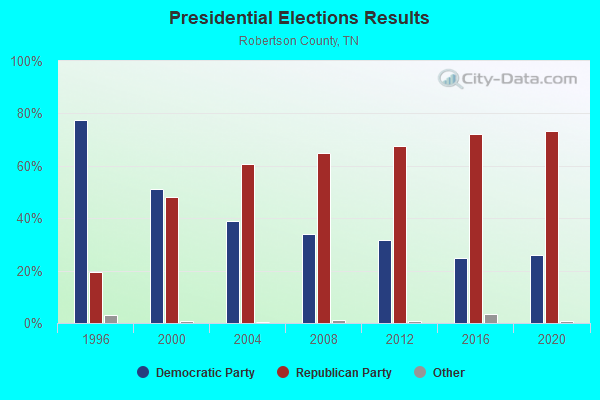
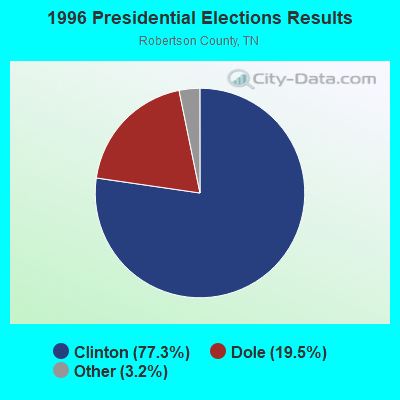
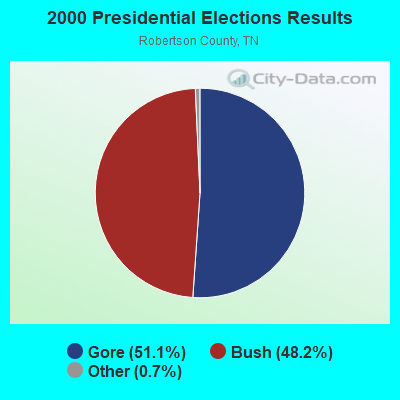
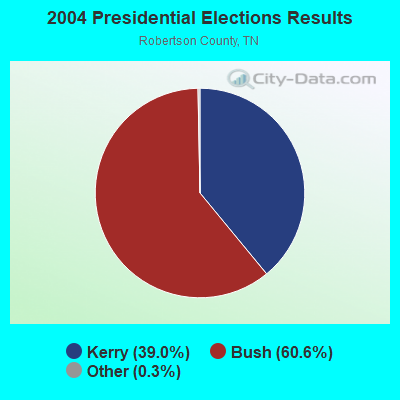

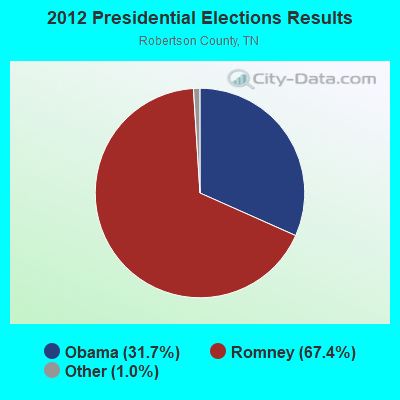
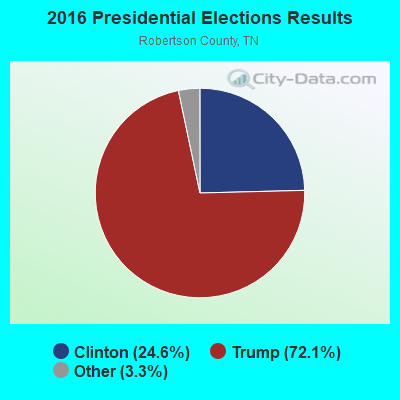
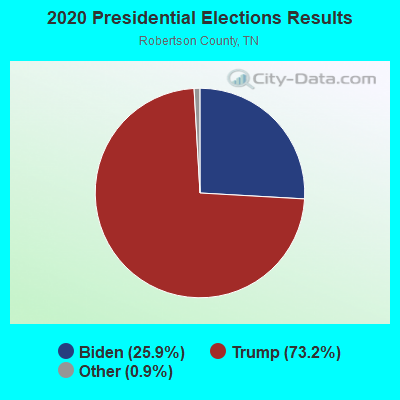
Graphs represent county-level data. Detailed 2008 Election Results
Religion statistics for Springfield, TN (based on Robertson County data)
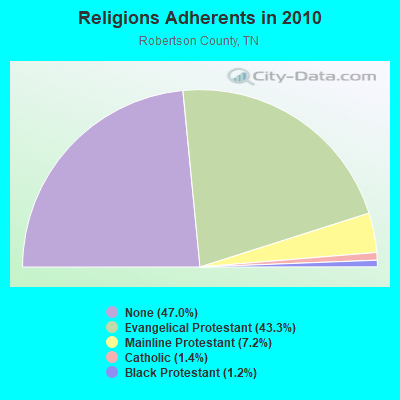
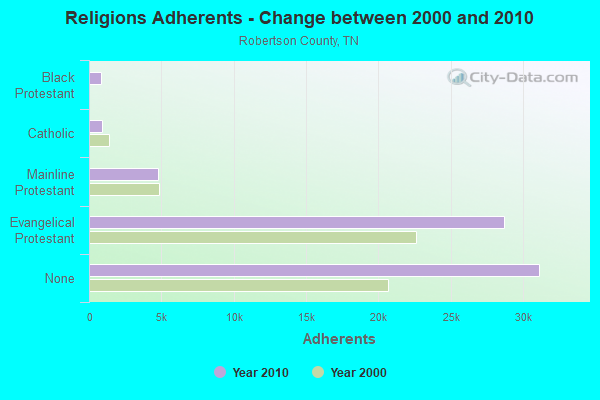
| Religion | Adherents | Congregations |
|---|---|---|
| Evangelical Protestant | 28,690 | 92 |
| Mainline Protestant | 4,749 | 25 |
| Catholic | 900 | 1 |
| Black Protestant | 802 | 5 |
| Other | 1 | 1 |
| None | 31,141 | - |
Food Environment Statistics:
| Robertson County: | 1.74 / 10,000 pop. |
| Tennessee: | 1.99 / 10,000 pop. |
| This county: | 0.16 / 10,000 pop. |
| State: | 0.17 / 10,000 pop. |
| Robertson County: | 0.63 / 10,000 pop. |
| State: | 0.65 / 10,000 pop. |
| Here: | 4.75 / 10,000 pop. |
| Tennessee: | 5.16 / 10,000 pop. |
| Robertson County: | 3.64 / 10,000 pop. |
| Tennessee: | 6.56 / 10,000 pop. |
| Robertson County: | 12.4% |
| State: | 11.4% |
| This county: | 31.3% |
| Tennessee: | 30.2% |
| Robertson County: | 17.4% |
| Tennessee: | 13.5% |
Health and Nutrition:
| This city: | 47.4% |
| State: | 49.3% |
| Springfield: | 43.3% |
| State: | 46.1% |
| Springfield: | 29.2 |
| Tennessee: | 28.8 |
| Springfield: | 21.4% |
| Tennessee: | 21.0% |
| Springfield: | 12.6% |
| Tennessee: | 10.5% |
| This city: | 6.8 |
| Tennessee: | 6.8 |
| Springfield: | 33.6% |
| Tennessee: | 33.9% |
| This city: | 53.7% |
| Tennessee: | 55.9% |
| Here: | 78.7% |
| Tennessee: | 79.1% |
More about Health and Nutrition of Springfield, TN Residents
| Local government employment and payroll (March 2022) | |||||
| Function | Full-time employees | Monthly full-time payroll | Average yearly full-time wage | Part-time employees | Monthly part-time payroll |
|---|---|---|---|---|---|
| Water Supply | 37 | $71,064 | $23,048 | 0 | $0 |
| Police Protection - Officers | 33 | $153,483 | $55,812 | 0 | $0 |
| Firefighters | 32 | $141,666 | $53,125 | 4 | $440 |
| Other and Unallocable | 30 | $162,349 | $64,940 | 3 | $4,548 |
| Financial Administration | 22 | $38,041 | $20,750 | 0 | $0 |
| Gas Supply | 20 | $93,861 | $56,317 | 0 | $0 |
| Streets and Highways | 18 | $83,859 | $55,906 | 0 | $0 |
| Electric Power | 16 | $103,943 | $77,957 | 0 | $0 |
| Other Government Administration | 14 | $45,831 | $39,284 | 0 | $0 |
| Parks and Recreation | 12 | $48,367 | $48,367 | 4 | $9,854 |
| Police - Other | 10 | $42,652 | $51,182 | 0 | $0 |
| Sewerage | 9 | $18,100 | $24,133 | 0 | $0 |
| Solid Waste Management | 9 | $31,474 | $41,965 | 0 | $0 |
| Fire - Other | 1 | $9,169 | $110,028 | 0 | $0 |
| Judicial and Legal | 0 | $0 | 2 | $3,726 | |
| Totals for Government | 263 | $1,043,860 | $47,629 | 13 | $18,568 |
Springfield government finances - Expenditure in 2021 (per resident):
- Construction - Sewerage: $5,966,000 ($310.39)
Water Utilities: $3,845,000 ($200.04)
General - Other: $1,141,000 ($59.36)
Electric Utilities: $1,106,000 ($57.54)
Gas Utilities: $855,000 ($44.48)
Solid Waste Management: $433,000 ($22.53)
- Current Operations - Electric Utilities: $27,052,000 ($1407.42)
Gas Utilities: $7,003,000 ($364.34)
Water Utilities: $4,228,000 ($219.97)
Police Protection: $4,189,000 ($217.94)
Local Fire Protection: $2,930,000 ($152.44)
Sewerage: $2,884,000 ($150.04)
Parks and Recreation: $2,316,000 ($120.49)
Regular Highways: $1,997,000 ($103.90)
Solid Waste Management: $1,116,000 ($58.06)
General - Other: $744,000 ($38.71)
Housing and Community Development: $535,000 ($27.83)
Central Staff Services: $322,000 ($16.75)
Financial Administration: $155,000 ($8.06)
Miscellaneous Commercial Activities - Other: $147,000 ($7.65)
Judicial and Legal Services: $87,000 ($4.53)
- Electric Utilities - Interest on Debt: $79,000 ($4.11)
- Gas Utilities - Interest on Debt: $89,000 ($4.63)
- General - Interest on Debt: $1,614,000 ($83.97)
- Other Capital Outlay - Regular Highways: $1,138,000 ($59.21)
Parks and Recreation: $275,000 ($14.31)
Police Protection: $253,000 ($13.16)
Local Fire Protection: $243,000 ($12.64)
General - Other: $98,000 ($5.10)
Central Staff Services: $50,000 ($2.60)
Housing and Community Development: $40,000 ($2.08)
Miscellaneous Commercial Activities - Other: $7,000 ($0.36)
Financial Administration: $1,000 ($0.05)
- Water Utilities - Interest on Debt: $353,000 ($18.37)
Springfield government finances - Revenue in 2021 (per resident):
- Charges - Sewerage: $7,387,000 ($384.32)
Solid Waste Management: $1,652,000 ($85.95)
Other: $1,223,000 ($63.63)
- Federal Intergovernmental - Housing and Community Development: $27,000 ($1.40)
- Miscellaneous - Special Assessments: $1,983,000 ($103.17)
Rents: $184,000 ($9.57)
Fines and Forfeits: $175,000 ($9.10)
General Revenue - Other: $130,000 ($6.76)
Interest Earnings: $130,000 ($6.76)
Sale of Property: $120,000 ($6.24)
- Revenue - Electric Utilities: $29,473,000 ($1533.37)
Water Utilities: $8,583,000 ($446.54)
Gas Utilities: $7,819,000 ($406.79)
- State Intergovernmental - General Local Government Support: $1,972,000 ($102.60)
Highways: $568,000 ($29.55)
Other: $190,000 ($9.89)
- Tax - General Sales and Gross Receipts: $7,759,000 ($403.67)
Property: $6,374,000 ($331.62)
Alcoholic Beverage Sales: $1,028,000 ($53.48)
Other Selective Sales: $861,000 ($44.79)
Other License: $146,000 ($7.60)
Public Utilities Sales: $1,000 ($0.05)
Springfield government finances - Debt in 2021 (per resident):
- Long Term Debt - Beginning Outstanding - Unspecified Public Purpose: $46,818,000 ($2435.77)
Outstanding Unspecified Public Purpose: $40,763,000 ($2120.75)
Retired Unspecified Public Purpose: $6,055,000 ($315.02)
Springfield government finances - Cash and Securities in 2021 (per resident):
- Bond Funds - Cash and Securities: $1,362,000 ($70.86)
- Other Funds - Cash and Securities: $57,138,000 ($2972.69)
- Sinking Funds - Cash and Securities: $797,000 ($41.47)
| Businesses in Springfield, TN | ||||
| Name | Count | Name | Count | |
|---|---|---|---|---|
| ALDI | 1 | Kroger | 1 | |
| AT&T | 1 | La-Z-Boy | 1 | |
| Ace Hardware | 1 | Little Caesars Pizza | 1 | |
| Advance Auto Parts | 1 | Lowe's | 1 | |
| Applebee's | 1 | MasterBrand Cabinets | 6 | |
| Arby's | 1 | McDonald's | 2 | |
| AutoZone | 1 | Nike | 2 | |
| Burger King | 1 | Papa John's Pizza | 1 | |
| CVS | 1 | Pizza Hut | 1 | |
| Chevrolet | 1 | RadioShack | 1 | |
| Cricket Wireless | 2 | Rite Aid | 1 | |
| Curves | 1 | SONIC Drive-In | 1 | |
| Decora Cabinetry | 2 | Subway | 1 | |
| Domino's Pizza | 1 | Taco Bell | 1 | |
| Dunkin Donuts | 1 | U-Haul | 1 | |
| FedEx | 4 | UPS | 4 | |
| Ford | 1 | Walgreens | 1 | |
| H&R Block | 1 | Walmart | 1 | |
| Hardee's | 1 | Wendy's | 1 | |
| Hilton | 1 | YMCA | 1 | |
| KFC | 1 | |||
Strongest AM radio stations in Springfield:
- WSGI (1100 AM; daytime; 1 kW; SPRINGFIELD, TN; Owner: LIGHTNING BROADCASTING, LLC)
- WJQY (1590 AM; 1 kW; SPRINGFIELD, TN; Owner: SAGA COMMUNICATIONS OF TUCKESSEE, LLC)
- WLAC (1510 AM; 50 kW; NASHVILLE, TN; Owner: CAPSTAR TX LIMITED PARTNERSHIP)
- WKDA (1200 AM; 50 kW; NASHVILLE, TN; Owner: RADIO NASHVILLE, INC.)
- WNQM (1300 AM; 50 kW; NASHVILLE, TN; Owner: WNQM. INC.)
- WAMB (1160 AM; 50 kW; DONELSON, TN; Owner: GREAT SOUTHERN BROADCASTING COMPANY, INC.)
- WSM (650 AM; 50 kW; NASHVILLE, TN; Owner: GAYLORD ENTERTAINMENT COMPANY)
- WPLN (1430 AM; 15 kW; MADISON, TN)
- WYFN (980 AM; 5 kW; NASHVILLE, TN; Owner: BIBLE BRADCASTING NETWORK, INC.)
- WHIN (1010 AM; 5 kW; GALLATIN, TN; Owner: WHIN, INC.)
- WCOR (900 AM; 5 kW; LEBANON, TN)
- WVOL (1470 AM; 5 kW; BERRY HILL, TN)
- WMDB (880 AM; daytime; 2 kW; NASHVILLE, TN; Owner: BABB BROADCASTING COMPANY)
Strongest FM radio stations in Springfield:
- WJOI-FM (94.3 FM; SPRINGFIELD, TN; Owner: SAGA COMMUNICATIONS OF TUCKESSEE, LLC)
- WMAK (96.3 FM; MURFREESBORO, TN; Owner: SOUTH CENTRAL COMMUNICATIONS CORP.)
- WRVW (107.5 FM; LEBANON, TN; Owner: CAPSTAR TX LIMITED PARTNERSHIP)
- WGFX (104.5 FM; GALLATIN, TN; Owner: CITADEL BROADCASTING COMPANY)
- WUBT (101.1 FM; RUSSELLVILLE, KY; Owner: CAPSTAR TX LIMITED PARTNERSHIP)
- WSM-FM (95.5 FM; NASHVILLE, TN; Owner: CUMULUS LICENSING CORP.)
- WRQQ (97.1 FM; GOODLETTSVILLE, TN; Owner: CUMULUS LICENSING CORP.)
- WJXA (92.9 FM; NASHVILLE, TN; Owner: SOUTH CENTRAL COMMUNICATIONS CORP.)
- WKDF (103.3 FM; NASHVILLE, TN; Owner: CITADEL BROADCASTING COMPANY)
- WNRQ (105.9 FM; NASHVILLE, TN; Owner: CAPSTAR TX LIMITED PARTNERSHIP)
- WNPL (106.7 FM; BELLE MEADE, TN; Owner: CUMULUS LICENSING CORP.)
- WQQK (92.1 FM; HENDERSONVILLE, TN; Owner: PHOENIX OF HENDERSONVILLE, INC.)
- WQZQ-FM (102.5 FM; DICKSON, TN; Owner: MONTGOMERY BROADCASTING COMPANY)
- WSIX-FM (97.9 FM; NASHVILLE, TN; Owner: CAPSTAR TX LIMITED PARTNERSHIP)
- WPLN-FM (90.3 FM; NASHVILLE, TN; Owner: NASHVILLE PUBLIC RADIO)
- WAYM (88.7 FM; COLUMBIA, TN; Owner: WAY-FM MEDIA GROUP, INC.)
- WFFI (93.7 FM; KINGSTON SPRINGS, TN; Owner: CARON BROADCASTING, INC.)
- WRVU (91.1 FM; NASHVILLE, TN; Owner: VANDERBILT STUDENT COMMUNICATIONS, INC.)
- WMOT (89.5 FM; MURFREESBORO, TN; Owner: MIDDLE TENNESSEE STATE UNIVERSITY)
- WRLT (100.1 FM; FRANKLIN, TN; Owner: TUNED-IN BROADCASTING, INC)
TV broadcast stations around Springfield:
- WTVF (Channel 5; NASHVILLE, TN; Owner: NEWSCHANNEL 5 NETWORK, LP)
- WNPX (Channel 28; COOKEVILLE, TN; Owner: PAXSON COMMUNICATIONS LICENSE COMPANY, LLC)
- WUXP-TV (Channel 30; NASHVILLE, TN; Owner: WUXP LICENSEE, LLC)
- WPGD (Channel 50; HENDERSONVILLE, TN; Owner: TRINITY BROADCASTING NETWORK)
- WSMV-TV (Channel 4; NASHVILLE, TN; Owner: MEREDITH CORPORATION)
- WZTV (Channel 17; NASHVILLE, TN; Owner: WZTV LICENSEE, LLC)
- WNPX-LP (Channel 20; NASHVILLE, TN; Owner: PAXSON COMMUNICATIONS LPTV, INC.)
- WKRN-TV (Channel 2; NASHVILLE, TN; Owner: WKRN, G.P.)
- WNPT (Channel 8; NASHVILLE, TN; Owner: NASHVILLE PUBLIC TELEVISION, INC.)
- WNAB (Channel 58; NASHVILLE, TN; Owner: NASHVILLE LICENSE HOLDINGS, L.L.C.)
- W36AK (Channel 36; NASHVILLE, TN; Owner: TRINITY BROADCASTING NETWORK)
- WGAP-LP (Channel 26; NASHVILLE, TN; Owner: SOUTH CENTRAL COMMUNICATIONS CORP.)
- WJDE-LP (Channel 24; NASHVILLE, TN; Owner: SOUTH CENTRAL COMMUNICATIONS CORP.)
- WRMX-LP (Channel 12; NASHVILLE, TN; Owner: SOUTH CENTRAL COMMUNICATIONS CORP.)
- WIIW-LP (Channel 14; NASHVILLE, TN; Owner: EQUITY BROADCASTING CORPORATION)
- WHTN (Channel 39; MURFREESBORO, TN; Owner: CHRISTIAN TELEVISION NETWORK, INC.)
- WJNK-LP (Channel 61; NASHVILLE, TN; Owner: THREE ANGELS BROADCASTING NETWORK, INC.)
- W52CT (Channel 52; NASHVILLE, TN; Owner: JKB ASSOCIATES, INC.)
- National Bridge Inventory (NBI) Statistics
- 40Number of bridges
- 364ft / 111mTotal length
- $10,679,000Total costs
- 157,922Total average daily traffic
- 15,428Total average daily truck traffic
- New bridges - historical statistics
- 11900-1909
- 31930-1939
- 51940-1949
- 21950-1959
- 91960-1969
- 81970-1979
- 41980-1989
- 41990-1999
- 32000-2009
- 12010-2019
FCC Registered Antenna Towers: 121 (See the full list of FCC Registered Antenna Towers)
FCC Registered Commercial Land Mobile Towers: 1 (See the full list of FCC Registered Commercial Land Mobile Towers in Springfield, TN)
FCC Registered Private Land Mobile Towers: 2 (See the full list of FCC Registered Private Land Mobile Towers)
FCC Registered Broadcast Land Mobile Towers: 27 (See the full list of FCC Registered Broadcast Land Mobile Towers)
FCC Registered Microwave Towers: 16 (See the full list of FCC Registered Microwave Towers in this town)
FCC Registered Paging Towers: 3 (See the full list of FCC Registered Paging Towers)
FCC Registered Maritime Coast & Aviation Ground Towers: 4 (See the full list of FCC Registered Maritime Coast & Aviation Ground Towers)
FCC Registered Amateur Radio Licenses: 154 (See the full list of FCC Registered Amateur Radio Licenses in Springfield)
FAA Registered Aircraft Manufacturers and Dealers: 3 (See the full list of FAA Registered Manufacturers and Dealers in Springfield)
FAA Registered Aircraft: 29 (See the full list of FAA Registered Aircraft)
| Home Mortgage Disclosure Act Aggregated Statistics For Year 2009 (Based on 3 partial tracts) | ||||||||||||||
| A) FHA, FSA/RHS & VA Home Purchase Loans | B) Conventional Home Purchase Loans | C) Refinancings | D) Home Improvement Loans | E) Loans on Dwellings For 5+ Families | F) Non-occupant Loans on < 5 Family Dwellings (A B C & D) | G) Loans On Manufactured Home Dwelling (A B C & D) | ||||||||
|---|---|---|---|---|---|---|---|---|---|---|---|---|---|---|
| Number | Average Value | Number | Average Value | Number | Average Value | Number | Average Value | Number | Average Value | Number | Average Value | Number | Average Value | |
| LOANS ORIGINATED | 52 | $113,111 | 34 | $99,366 | 108 | $117,163 | 4 | $35,912 | 1 | $196,680 | 42 | $109,046 | 3 | $171,930 |
| APPLICATIONS APPROVED, NOT ACCEPTED | 1 | $76,070 | 2 | $31,990 | 9 | $92,451 | 2 | $23,720 | 0 | $0 | 1 | $47,690 | 0 | $0 |
| APPLICATIONS DENIED | 12 | $128,072 | 5 | $168,334 | 52 | $119,028 | 16 | $15,130 | 0 | $0 | 1 | $445,900 | 0 | $0 |
| APPLICATIONS WITHDRAWN | 7 | $102,924 | 3 | $94,150 | 34 | $135,394 | 1 | $35,860 | 0 | $0 | 4 | $121,132 | 0 | $0 |
| FILES CLOSED FOR INCOMPLETENESS | 1 | $265,740 | 0 | $0 | 8 | $136,214 | 1 | $2,310 | 0 | $0 | 2 | $31,425 | 0 | $0 |
Detailed HMDA statistics for the following Tracts: 0803.00 , 0804.01, 0804.02
| Private Mortgage Insurance Companies Aggregated Statistics For Year 2009 (Based on 3 partial tracts) | ||||
| A) Conventional Home Purchase Loans | B) Refinancings | |||
|---|---|---|---|---|
| Number | Average Value | Number | Average Value | |
| LOANS ORIGINATED | 1 | $146,830 | 6 | $156,503 |
| APPLICATIONS APPROVED, NOT ACCEPTED | 0 | $0 | 2 | $94,870 |
| APPLICATIONS DENIED | 0 | $0 | 0 | $0 |
| APPLICATIONS WITHDRAWN | 0 | $0 | 0 | $0 |
| FILES CLOSED FOR INCOMPLETENESS | 0 | $0 | 0 | $0 |
Detailed PMIC statistics for the following Tracts: 0803.00 , 0804.01, 0804.02
2002 - 2018 National Fire Incident Reporting System (NFIRS) incidents
- Fire incident types reported to NFIRS in Springfield, TN
- 1,10745.2%Outside Fires
- 82133.6%Structure Fires
- 37815.4%Mobile Property/Vehicle Fires
- 1415.8%Other
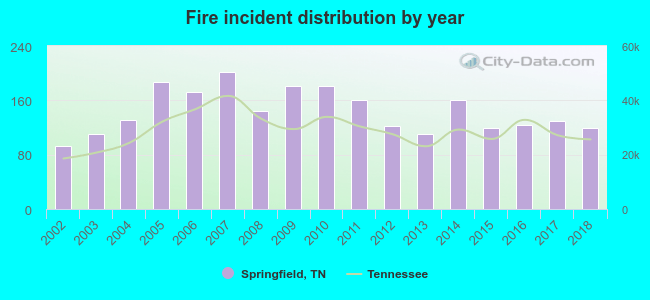 Based on the data from the years 2002 - 2018 the average number of fire incidents per year is 144. The highest number of fire incidents - 201 took place in 2007, and the least - 93 in 2002. The data has an increasing trend.
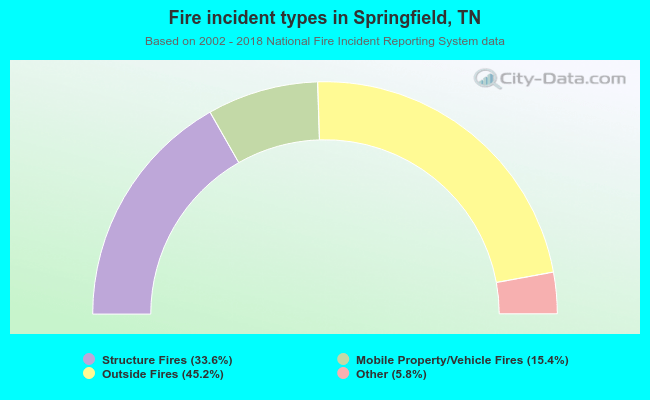 When looking into fire subcategories, the most incidents belonged to: Outside Fires (45.2%), and Structure Fires (33.6%).
Fire-safe hotels and motels in Springfield, Tennessee:
- Best Western Springfield Inn, 2001 Memorial Blvd, Springfield, Tennessee 37172 , Phone: (615) 384-1234, Fax: (615) 384-7884
- Hampton Inn, 620 22nd Avenue E, Springfield, Tennessee 37172 , Phone: (615) 384-1166, Fax: (615) 384-1152
- Holiday Inn Express & Suites Springfield, 2518 Memorial Blvd, Springfield, Tennessee 37172 , Phone: (615) 547-8225
| Most common first names in Springfield, TN among deceased individuals | ||
| Name | Count | Lived (average) |
|---|---|---|
| James | 276 | 71.8 years |
| William | 193 | 74.1 years |
| Mary | 185 | 77.8 years |
| John | 176 | 72.9 years |
| Robert | 164 | 72.4 years |
| Charles | 101 | 71.6 years |
| George | 86 | 75.1 years |
| Annie | 83 | 83.1 years |
| Thomas | 75 | 75.6 years |
| Willie | 69 | 77.3 years |
| Most common last names in Springfield, TN among deceased individuals | ||
| Last name | Count | Lived (average) |
|---|---|---|
| Smith | 123 | 74.0 years |
| Jones | 100 | 74.7 years |
| Johnson | 80 | 73.5 years |
| Wilson | 68 | 78.8 years |
| Williams | 67 | 75.7 years |
| Brown | 65 | 76.7 years |
| Woodard | 59 | 74.7 years |
| Ellis | 58 | 75.4 years |
| Farmer | 54 | 73.6 years |
| Head | 50 | 77.7 years |
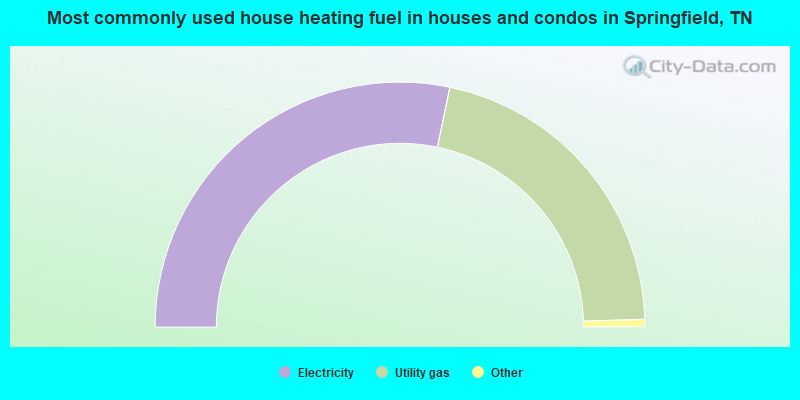
- 56.6%Electricity
- 42.5%Utility gas
- 0.3%Bottled, tank, or LP gas
- 0.3%No fuel used
- 0.2%Wood
- 0.2%Fuel oil, kerosene, etc.
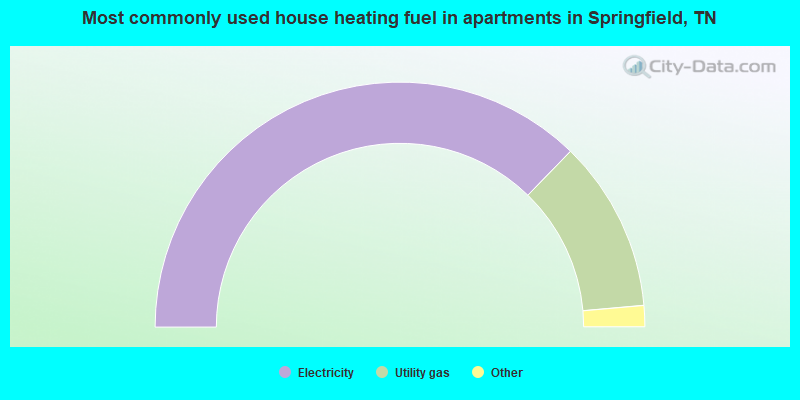
- 74.6%Electricity
- 22.7%Utility gas
- 1.7%No fuel used
- 1.1%Bottled, tank, or LP gas
Springfield compared to Tennessee state average:
- Unemployed percentage below state average.
- Black race population percentage above state average.
- Hispanic race population percentage significantly above state average.
- Median age below state average.
- Foreign-born population percentage significantly above state average.
- Length of stay since moving in above state average.
- Institutionalized population percentage above state average.
Springfield on our top lists:
- #51 on the list of "Top 101 cities with largest percentage of females in occupations: production occupations (population 5,000+)"
- #97 on the list of "Top 101 cities with largest percentage of males in industries: wholesale trade (population 5,000+)"

|
|
Total of 58 patent applications in 2008-2024.