Metropolitan Government, Tennessee

Submit your own pictures of this place and show them to the world
- OSM Map
- General Map
- Google Map
- MSN Map

| Males: 300,564 | |
| Females: 320,352 |
| Median resident age: | 34.1 years |
| Tennessee median age: | 35.9 years |
Zip code: 37210
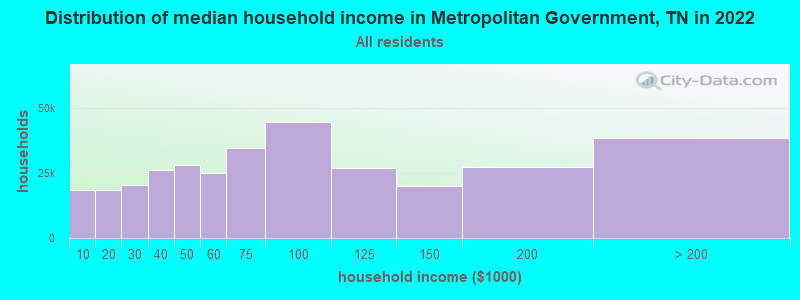
| Metropolitan Government: | $72,473 |
| TN: | $65,254 |
Estimated per capita income in 2022: $48,105 (it was $23,069 in 2000)
Metropolitan Government CCD income, earnings, and wages data
Estimated median house or condo value in 2022: $434,700 (it was $114,200 in 2000)
| Metropolitan Government: | $434,700 |
| TN: | $284,800 |
Mean prices in 2022: all housing units: $551,762; detached houses: $591,687; townhouses or other attached units: $423,064; in 2-unit structures: $310,328; in 3-to-4-unit structures: $217,230; in 5-or-more-unit structures: $375,382; mobile homes: $149,045; occupied boats, rvs, vans, etc.: $252,644
Metropolitan Government, TN residents, houses, and apartments details
Detailed information about poverty and poor residents in Metropolitan Government, TN
Compare current foreclosures near Metropolitan Government, TN:


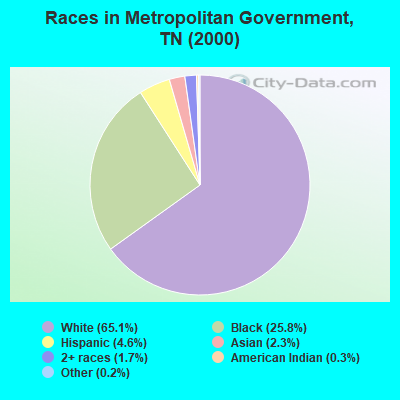
- 371,15065.1%White alone
- 146,93925.8%Black alone
- 26,0914.6%Hispanic
- 13,1862.3%Asian alone
- 9,7261.7%Two or more races
- 1,4970.3%American Indian alone
- 9380.2%Other race alone
- 3640.06%Native Hawaiian and Other
Pacific Islander alone
Races in Metropolitan Government detailed stats: ancestries, foreign born residents, place of birth
 Recent articles from our blog. Our writers, many of them Ph.D. graduates or candidates, create easy-to-read articles on a wide variety of topics.
Current Local Time: CST time zone
Land area: 502.3 square miles.
Population density: 1,236 people per square mile (low).
| Metropolitan Government CCD: | 0.9% ($985) |
| Tennessee: | 0.8% ($715) |
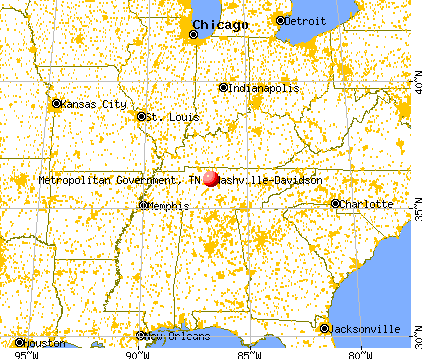
Nearest city with pop. 1,000,000+: Chicago, IL  (396.2 miles , pop. 2,896,016).
Nearest cities:
), ), ), )Latitude: 36.16 N, Longitude: 86.77 W

| Here: | 2.5% |
| Tennessee: | 3.0% |
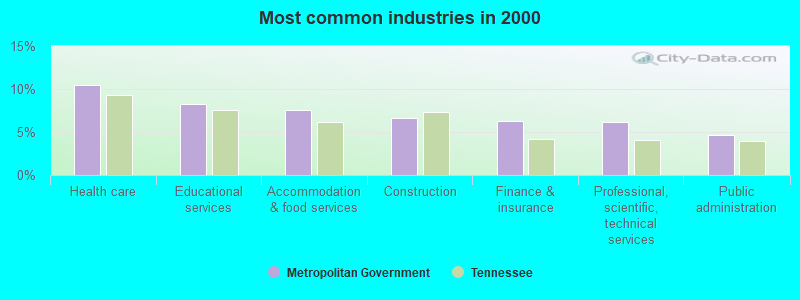
- Health care (10.5%)
- Educational services (8.2%)
- Accommodation & food services (7.6%)
- Construction (6.6%)
- Finance & insurance (6.2%)
- Professional, scientific, technical services (6.2%)
- Public administration (4.7%)
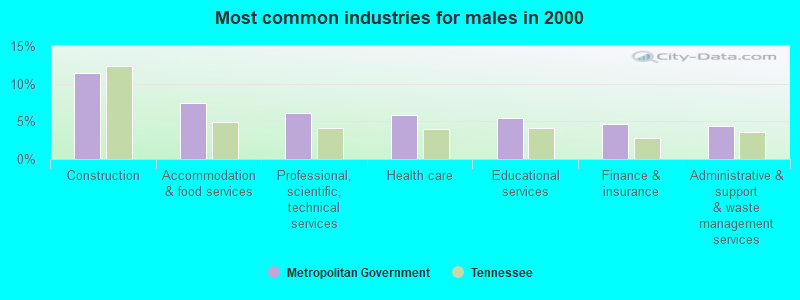
- Construction (11.4%)
- Accommodation & food services (7.4%)
- Professional, scientific, technical services (6.1%)
- Health care (5.8%)
- Educational services (5.4%)
- Finance & insurance (4.6%)
- Administrative & support & waste management services (4.3%)
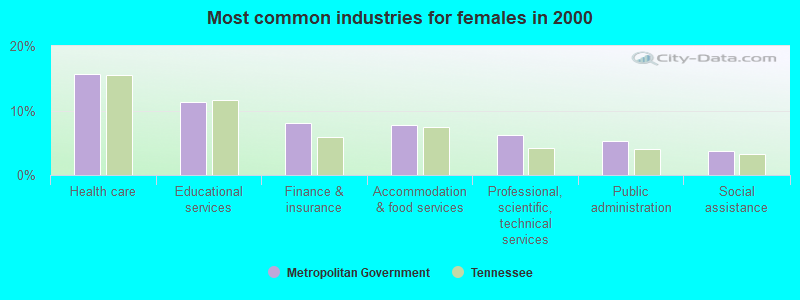
- Health care (15.7%)
- Educational services (11.3%)
- Finance & insurance (8.0%)
- Accommodation & food services (7.7%)
- Professional, scientific, technical services (6.2%)
- Public administration (5.2%)
- Social assistance (3.7%)
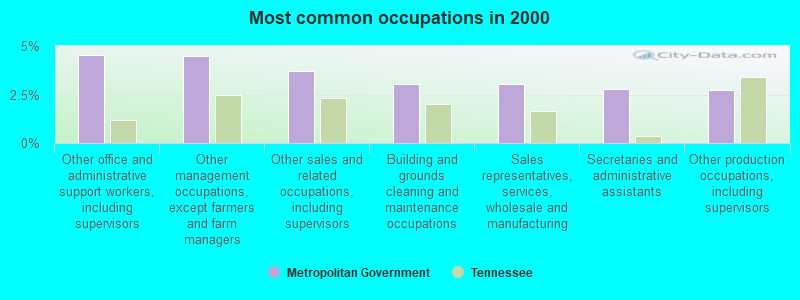
- Other office and administrative support workers, including supervisors (4.5%)
- Other management occupations, except farmers and farm managers (4.5%)
- Other sales and related occupations, including supervisors (3.7%)
- Building and grounds cleaning and maintenance occupations (3.0%)
- Sales representatives, services, wholesale and manufacturing (3.0%)
- Secretaries and administrative assistants (2.8%)
- Other production occupations, including supervisors (2.7%)
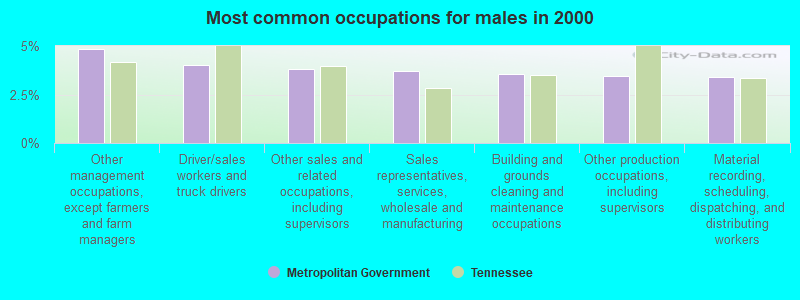
- Other management occupations, except farmers and farm managers (4.8%)
- Driver/sales workers and truck drivers (4.0%)
- Other sales and related occupations, including supervisors (3.8%)
- Sales representatives, services, wholesale and manufacturing (3.7%)
- Building and grounds cleaning and maintenance occupations (3.6%)
- Other production occupations, including supervisors (3.4%)
- Material recording, scheduling, dispatching, and distributing workers (3.4%)
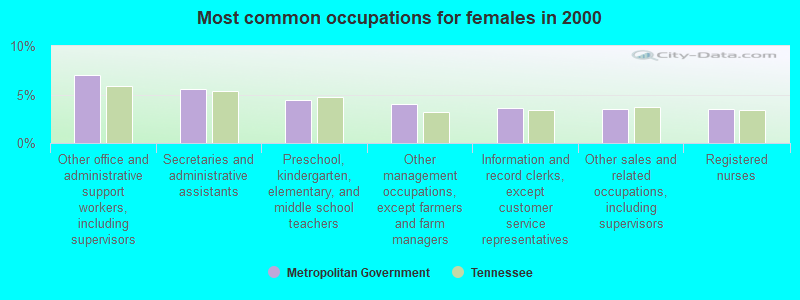
- Other office and administrative support workers, including supervisors (7.0%)
- Secretaries and administrative assistants (5.6%)
- Preschool, kindergarten, elementary, and middle school teachers (4.4%)
- Other management occupations, except farmers and farm managers (4.0%)
- Information and record clerks, except customer service representatives (3.6%)
- Other sales and related occupations, including supervisors (3.5%)
- Registered nurses (3.5%)
Average climate in Metropolitan Government, Tennessee
Based on data reported by over 4,000 weather stations


(lower is better)
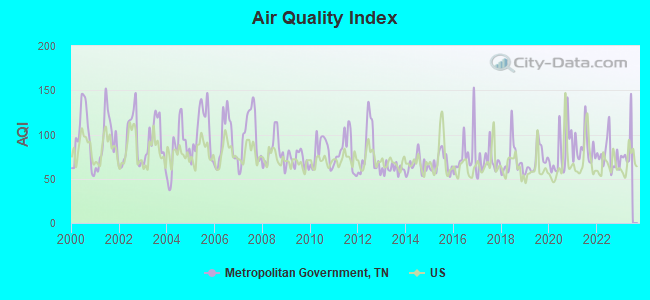
Air Quality Index (AQI) level in 2022 was 76.0. This is about average.
| City: | 76.0 |
| U.S.: | 72.6 |
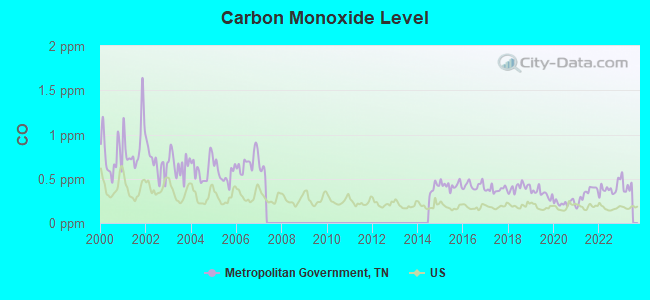
Carbon Monoxide (CO) [ppm] level in 2022 was 0.390. This is significantly worse than average. Closest monitor was 1.4 miles away from the city center.
| City: | 0.390 |
| U.S.: | 0.251 |
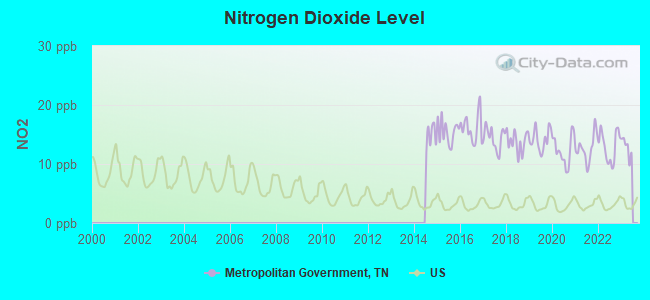
Nitrogen Dioxide (NO2) [ppb] level in 2022 was 13.0. This is significantly worse than average. Closest monitor was 1.1 miles away from the city center.
| City: | 13.0 |
| U.S.: | 5.1 |
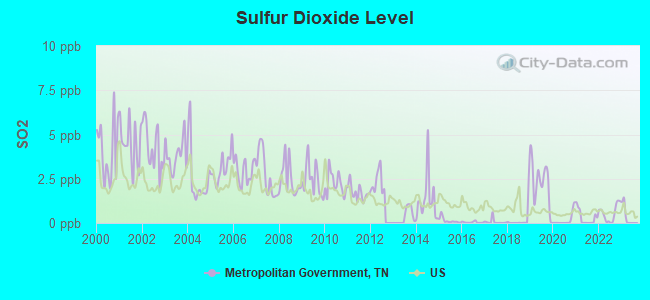
Sulfur Dioxide (SO2) [ppb] level in 2022 was 0.553. This is significantly better than average. Closest monitor was 1.1 miles away from the city center.
| City: | 0.553 |
| U.S.: | 1.515 |
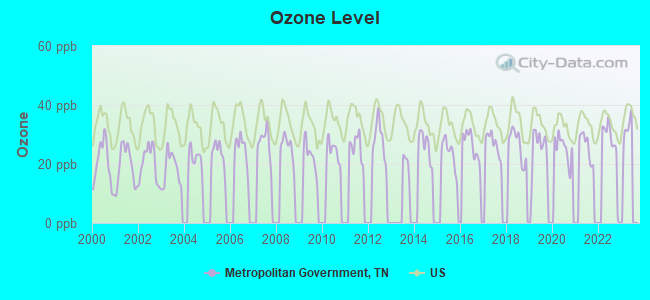
Ozone [ppb] level in 2022 was 26.8. This is better than average. Closest monitor was 3.6 miles away from the city center.
| City: | 26.8 |
| U.S.: | 33.3 |
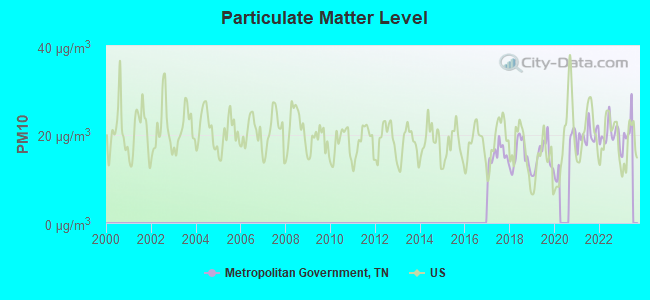
Particulate Matter (PM10) [µg/m3] level in 2022 was 20.0. This is about average. Closest monitor was 1.1 miles away from the city center.
| City: | 20.0 |
| U.S.: | 19.2 |
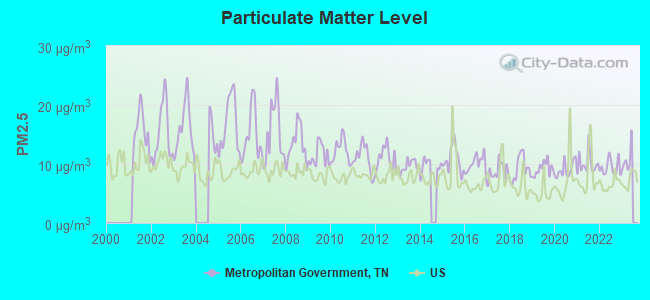
Particulate Matter (PM2.5) [µg/m3] level in 2022 was 9.43. This is about average. Closest monitor was 2.0 miles away from the city center.
| City: | 9.43 |
| U.S.: | 8.11 |
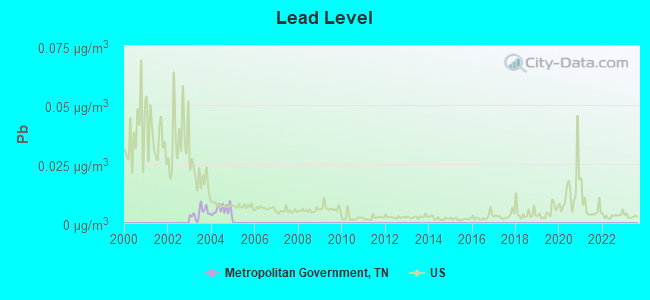
Lead (Pb) [µg/m3] level in 2004 was 0.00568. This is significantly better than average. Closest monitor was 1.1 miles away from the city center.
| City: | 0.00568 |
| U.S.: | 0.00931 |
Tornado activity:
Metropolitan Government-area historical tornado activity is slightly above Tennessee state average. It is 69% greater than the overall U.S. average.
On 12/24/1988, a category F4 (max. wind speeds 207-260 mph) tornado 8.8 miles away from the Metropolitan Government place center killed one person and injured 7 people and caused between $5,000,000 and $50,000,000 in damages.
On 4/16/1998, a category F5 (max. wind speeds 261-318 mph) tornado 42.6 miles away from the place center killed 3 people and injured 36 people and caused $13 million in damages.
Earthquake activity:
Metropolitan Government-area historical earthquake activity is significantly above Tennessee state average. It is 196% greater than the overall U.S. average.On 4/18/2008 at 09:36:59, a magnitude 5.4 (5.1 MB, 4.8 MS, 5.4 MW, 5.2 MW, Class: Moderate, Intensity: VI - VII) earthquake occurred 170.3 miles away from the city center
On 4/18/2008 at 09:36:59, a magnitude 5.2 (5.2 MW, Depth: 8.9 mi) earthquake occurred 170.3 miles away from the city center
On 6/18/2002 at 17:37:15, a magnitude 5.0 (4.3 MB, 4.6 MW, 5.0 LG) earthquake occurred 138.4 miles away from Metropolitan Government center
On 4/29/2003 at 08:59:39, a magnitude 4.9 (4.4 MB, 4.6 MW, 4.9 LG, Class: Light, Intensity: IV - V) earthquake occurred 131.7 miles away from Metropolitan Government center
On 9/26/1990 at 13:18:51, a magnitude 5.0 (4.7 MB, 4.8 LG, 5.0 LG, Depth: 7.7 mi) earthquake occurred 168.8 miles away from Metropolitan Government center
On 7/27/1980 at 18:52:21, a magnitude 5.2 (5.1 MB, 4.7 MS, 5.0 UK, 5.2 UK) earthquake occurred 210.4 miles away from the city center
Magnitude types: regional Lg-wave magnitude (LG), body-wave magnitude (MB), surface-wave magnitude (MS), moment magnitude (MW)
Natural disasters:
The number of natural disasters in Davidson County (17) is near the US average (15).Major Disasters (Presidential) Declared: 14
Emergencies Declared: 1
Causes of natural disasters: Floods: 12, Storms: 12, Tornadoes: 10, Winds: 4, Winter Storms: 2, Flash Flood: 1, Hurricane: 1, Ice Storm: 1, Other: 1 (Note: some incidents may be assigned to more than one category).
Hospitals and medical centers near Metropolitan Government:
- TREVECCA HEALTH CARE CENTER (Nursing Home, about 2 miles away; NASHVILLE, TN)
- EAST VILLA NH (Nursing Home, about 2 miles away; NASHVILLE, TN)
- NASHVILLE HOME TRAINING DIALYSIS (Dialysis Facility, about 2 miles away; NASHVILLE, TN)
- DCI MEDICAL CENTER (Dialysis Facility, about 2 miles away; NASHVILLE, TN)
- DCI HOME TRAINING OF MIDDLE TN (Dialysis Facility, about 2 miles away; NASHVILLE, TN)
- LAKESHORE WEDGEWOOD (Nursing Home, about 2 miles away; NASHVILLE, TN)
- ALIVE HOSPICE INC (Hospital, about 2 miles away; NASHVILLE, TN)
Colleges/universities with over 2000 students nearest to Metropolitan Government:
- Trevecca Nazarene University (about 2 miles; Nashville, TN; Full-time enrollment: 2,223)
- Belmont University (about 3 miles; Nashville, TN; FT enrollment: 5,795)
- Vanderbilt University (about 3 miles; Nashville, TN; FT enrollment: 10,518)
- Tennessee State University (about 4 miles; Nashville, TN; FT enrollment: 7,341)
- Lipscomb University (about 5 miles; Nashville, TN; FT enrollment: 3,827)
- Nashville State Community College (about 6 miles; Nashville, TN; FT enrollment: 6,436)
- Volunteer State Community College (about 21 miles; Gallatin, TN; FT enrollment: 5,311)
Points of interest:
Notable locations in Metropolitan Government: Kitty B West Amphitheatre (A), Bloomsteins Landing (B), Davidsons Landing (C), Dozier Landing (D), Opryland Dock (E), Indian Creek Boat Ramp (F), Tidwell Parking Lot (G), Village at Vanderbilt (H), Robertsons Landing (I), Seats Landing (J), Timmons Landing (K), Watkins Landing (L), Hidden Acres Farm (M), Rock Harbor Marina (N), Richland Golf Club (O), Creekside Farm (P), Radnor Yards (Q), West Nashville Junction (R), Lebanon Junction (S), Home of the Aged (T). Display/hide their locations on the map
Shopping Centers: Dickerson Plaza Shopping Center (1), Dover Pointe Shopping Center (2), Edge-O-Lake Shopping Center (3), Factory Stores of America Shopping Center (4), Graces Plaza Shopping Center (5), H G Hill Shopping Center (6), Hill Shopping Center (7), Hills Hickory Hollow Center Shopping Center (8), Hillsboro Village Shopping Center (9). Display/hide their locations on the map
Churches in Metropolitan Government include: Rosebank Church (A), Rosedale Church (B), Saint Andrews Church (C), Saint Bartholomews Church (D), Saint Davids Church (E), Saint Johns Church (F), Saint Lukes Church (G), Saint Matthias Church (H), Saint Pauls Church (I). Display/hide their locations on the map
Cemeteries: Temple Cemetery (1), Webb Cemetery (2), Wright Cemetery (3), White Cemetery (4), Waldron Cemetery (5), Union Hill Cemetery (6), Turner Cemetery (7). Display/hide their locations on the map
Lakes and reservoirs: Meadowbrook Lake (A), Lake Louise (B), Glen Echo Lake (C), Marrowbone Lake (D), Bush Lake (E), Cheek Lake (F), Radnor Lake (G), Crocker Springs Lake (H). Display/hide their locations on the map
Streams, rivers, and creeks: Mansker Creek (A), Lumsley Fork (B), Little East Fork (C), Little Creek (D), Linton Branch (E), Jocelyn Hollow Branch (F), Whittemore Branch (G), Island Branch (H), Holt Creek (I). Display/hide their locations on the map
Parks in Metropolitan Government include: J Percy Priest Wildlife Management Area (1), Nashville Shores Recreation Area (2), Ezele Road Park (3), Clifton Park (4), Cumberland Park (5), Lock Two Park (6), LP Field (7), Napier Park (8), Metro Riverfront Park (9). Display/hide their locations on the map
| This place: | 2.3 people |
| Tennessee: | 2.5 people |
| This place: | 38.3% |
| Whole state: | 69.8% |
| This place: | 5.2% |
| Whole state: | 4.2% |
Likely homosexual households (counted as self-reported same-sex unmarried-partner households)
- Lesbian couples: 0.3% of all households
- Gay men: 0.4% of all households
| This place: | 13.0% |
| Whole state: | 13.5% |
| This place: | 6.5% |
| Whole state: | 5.8% |
People in group quarters in Metropolitan Government in 2000:
- 11,313 people in college dormitories (includes college quarters off campus)
- 3,027 people in state prisons
- 2,515 people in local jails and other confinement facilities (including police lockups)
- 2,335 people in nursing homes
- 1,678 people in other noninstitutional group quarters
- 481 people in hospitals/wards and hospices for chronically ill
- 481 people in other hospitals or wards for chronically ill
- 458 people in mental (psychiatric) hospitals or wards
- 329 people in orthopedic wards and institutions for the physically handicapped
- 301 people in other types of correctional institutions
- 258 people in schools, hospitals, or wards for the intellectually disabled
- 233 people in homes or halfway houses for drug/alcohol abuse
- 226 people in homes for the mentally retarded
- 201 people in other group homes
- 172 people in training schools for juvenile delinquents
- 147 people in homes for abused, dependent, and neglected children
- 119 people in hospitals or wards for drug/alcohol abuse
- 113 people in religious group quarters
- 93 people in wards in general hospitals for patients who have no usual home elsewhere
- 88 people in other nonhousehold living situations
- 63 people in unknown juvenile institutions
- 15 people in homes for the mentally ill
For population 15 years and over in Metropolitan Government:
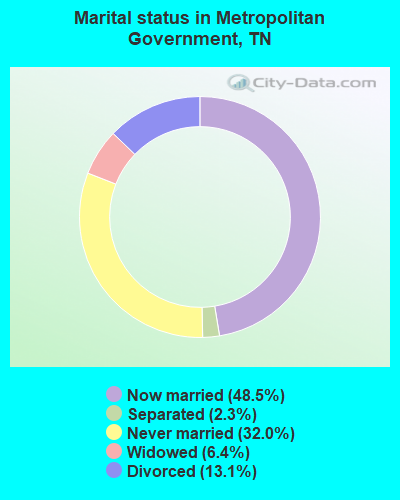
- Never married: 32.0%
- Now married: 48.5%
- Separated: 2.3%
- Widowed: 6.4%
- Divorced: 13.1%
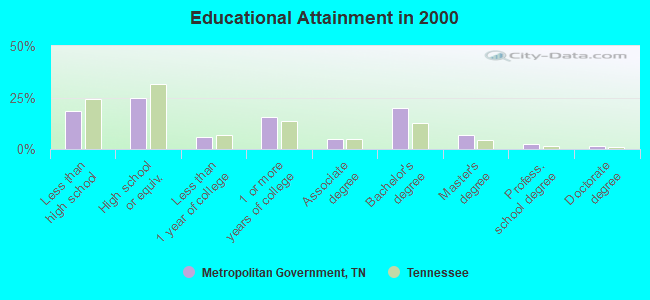
For population 25 years and over in Metropolitan Government:
- High school or higher: 81.5%
- Bachelor's degree or higher: 30.5%
- Graduate or professional degree: 10.4%
- Unemployed: 5.2%
- Mean travel time to work (commute): 22.6 minutes
| Here: | 12.6 |
| Tennessee average: | 13.3 |
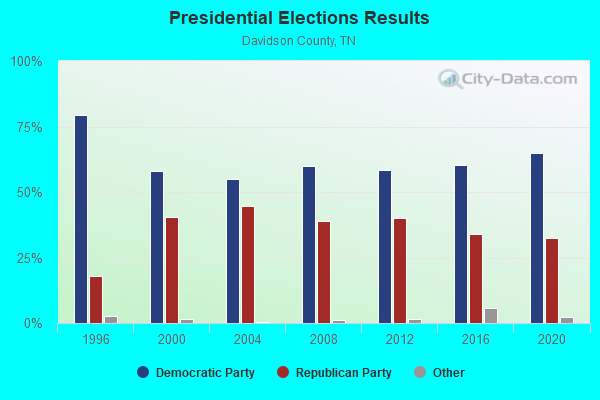
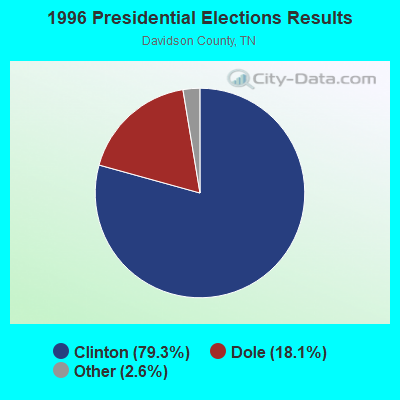
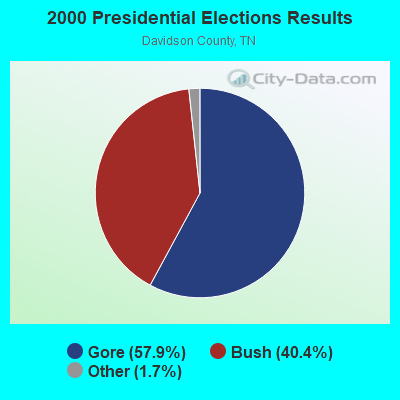
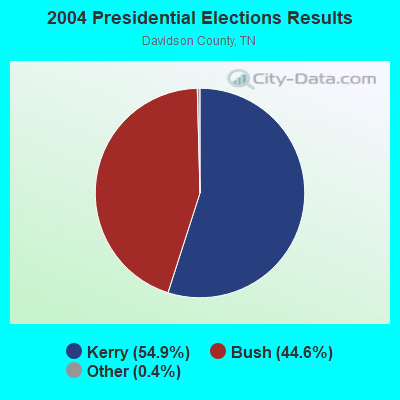
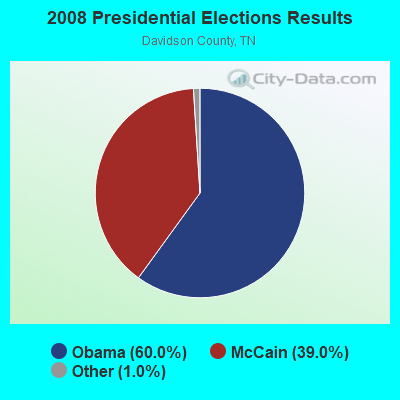
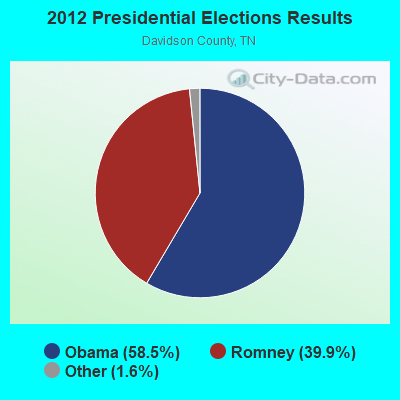
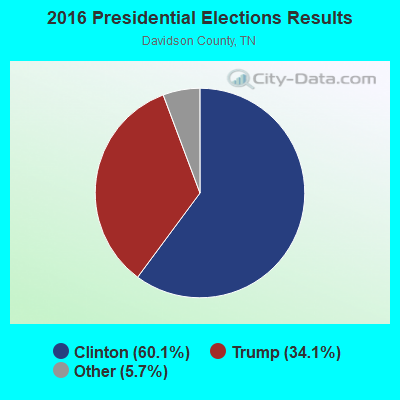
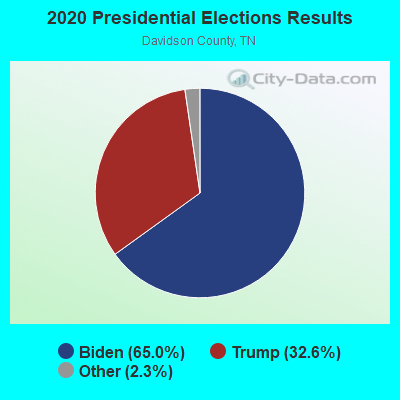
Graphs represent county-level data. Detailed 2008 Election Results
Religion statistics for Metropolitan Government, TN (based on Davidson County data)
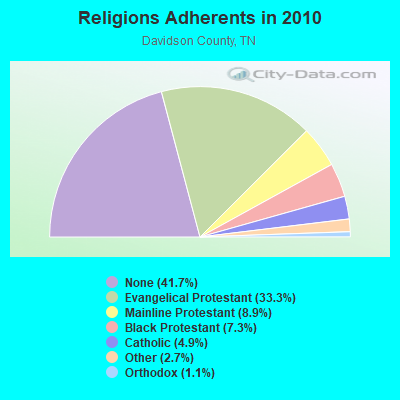
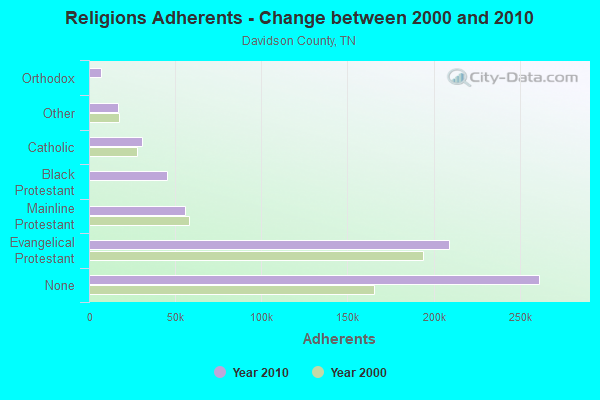
| Religion | Adherents | Congregations |
|---|---|---|
| Evangelical Protestant | 208,931 | 485 |
| Mainline Protestant | 55,873 | 132 |
| Black Protestant | 45,441 | 86 |
| Catholic | 30,874 | 18 |
| Other | 17,082 | 51 |
| Orthodox | 7,022 | 10 |
| None | 261,458 | - |
Food Environment Statistics:
| Here: | 2.02 / 10,000 pop. |
| Tennessee: | 1.99 / 10,000 pop. |
| Davidson County: | 0.10 / 10,000 pop. |
| Tennessee: | 0.17 / 10,000 pop. |
| Here: | 0.52 / 10,000 pop. |
| State: | 0.65 / 10,000 pop. |
| This county: | 4.43 / 10,000 pop. |
| State: | 5.16 / 10,000 pop. |
| Here: | 8.80 / 10,000 pop. |
| Tennessee: | 6.56 / 10,000 pop. |
| Davidson County: | 10.6% |
| Tennessee: | 11.4% |
| Davidson County: | 30.1% |
| Tennessee: | 30.2% |
| This county: | 17.2% |
| Tennessee: | 13.5% |
9.81% of this county's 2021 resident taxpayers lived in other counties in 2020 ($81,596 average adjusted gross income)
| Here: | 9.81% |
| Tennessee average: | 8.49% |
0.01% of residents moved from foreign countries ($54 average AGI)
Davidson County: 0.01% Tennessee average: 0.02%
Top counties from which taxpayers relocated into this county between 2020 and 2021:
| from Rutherford County, TN | |
| from Williamson County, TN | |
| from Sumner County, TN |
10.77% of this county's 2020 resident taxpayers moved to other counties in 2021 ($70,227 average adjusted gross income)
| Here: | 10.77% |
| Tennessee average: | 7.40% |
0.01% of residents moved to foreign countries ($170 average AGI)
Davidson County: 0.01% Tennessee average: 0.01%
Top counties to which taxpayers relocated from this county between 2020 and 2021:
| to Rutherford County, TN | |
| to Williamson County, TN | |
| to Sumner County, TN |
Strongest AM radio stations in Metropolitan Government:
- WNSG (1240 AM; 1 kW; NASHVILLE, TN; Owner: MORTENSON BROADCASTING COMPANY)
- WAMB (1160 AM; 50 kW; DONELSON, TN; Owner: GREAT SOUTHERN BROADCASTING COMPANY, INC.)
- WENO (760 AM; daytime; 1 kW; NASHVILLE, TN; Owner: WENO, INC.)
- WKDA (1200 AM; 50 kW; NASHVILLE, TN; Owner: RADIO NASHVILLE, INC.)
- WCOR (900 AM; 5 kW; LEBANON, TN)
- WNQM (1300 AM; 50 kW; NASHVILLE, TN; Owner: WNQM. INC.)
- WSM (650 AM; 50 kW; NASHVILLE, TN; Owner: GAYLORD ENTERTAINMENT COMPANY)
- WLAC (1510 AM; 50 kW; NASHVILLE, TN; Owner: CAPSTAR TX LIMITED PARTNERSHIP)
- WVOL (1470 AM; 5 kW; BERRY HILL, TN)
- WPLN (1430 AM; 15 kW; MADISON, TN)
- WYFN (980 AM; 5 kW; NASHVILLE, TN; Owner: BIBLE BRADCASTING NETWORK, INC.)
- WNAH (1360 AM; 1 kW; NASHVILLE, TN; Owner: HERMITAGE BROADCASTING EAST)
- WMDB (880 AM; daytime; 2 kW; NASHVILLE, TN; Owner: BABB BROADCASTING COMPANY)
Strongest FM radio stations in Metropolitan Government:
- WNPL (106.7 FM; BELLE MEADE, TN; Owner: CUMULUS LICENSING CORP.)
- WNAZ-FM (89.1 FM; NASHVILLE, TN; Owner: TREVECCA NAZARENE UNIVERSITY, INC.)
- WGFX (104.5 FM; GALLATIN, TN; Owner: CITADEL BROADCASTING COMPANY)
- WSM-FM (95.5 FM; NASHVILLE, TN; Owner: CUMULUS LICENSING CORP.)
- WMAK (96.3 FM; MURFREESBORO, TN; Owner: SOUTH CENTRAL COMMUNICATIONS CORP.)
- WRVW (107.5 FM; LEBANON, TN; Owner: CAPSTAR TX LIMITED PARTNERSHIP)
- WRVU (91.1 FM; NASHVILLE, TN; Owner: VANDERBILT STUDENT COMMUNICATIONS, INC.)
- WSIX-FM (97.9 FM; NASHVILLE, TN; Owner: CAPSTAR TX LIMITED PARTNERSHIP)
- WKDF (103.3 FM; NASHVILLE, TN; Owner: CITADEL BROADCASTING COMPANY)
- WNRQ (105.9 FM; NASHVILLE, TN; Owner: CAPSTAR TX LIMITED PARTNERSHIP)
- WPLN-FM (90.3 FM; NASHVILLE, TN; Owner: NASHVILLE PUBLIC RADIO)
- WAYM (88.7 FM; COLUMBIA, TN; Owner: WAY-FM MEDIA GROUP, INC.)
- W271AB (102.1 FM; NASHVILLE, TN; Owner: MONTGOMERY BROADCASTING COMPANY)
- WJXA (92.9 FM; NASHVILLE, TN; Owner: SOUTH CENTRAL COMMUNICATIONS CORP.)
- WRLT (100.1 FM; FRANKLIN, TN; Owner: TUNED-IN BROADCASTING, INC)
- WFFI (93.7 FM; KINGSTON SPRINGS, TN; Owner: CARON BROADCASTING, INC.)
- WRQQ (97.1 FM; GOODLETTSVILLE, TN; Owner: CUMULUS LICENSING CORP.)
- WMOT (89.5 FM; MURFREESBORO, TN; Owner: MIDDLE TENNESSEE STATE UNIVERSITY)
- WQQK (92.1 FM; HENDERSONVILLE, TN; Owner: PHOENIX OF HENDERSONVILLE, INC.)
- WBUZ (102.9 FM; LA VERGNE, TN; Owner: WYCQ, INC)
TV broadcast stations around Metropolitan Government:
- W36AK (Channel 36; NASHVILLE, TN; Owner: TRINITY BROADCASTING NETWORK)
- WGAP-LP (Channel 26; NASHVILLE, TN; Owner: SOUTH CENTRAL COMMUNICATIONS CORP.)
- WJDE-LP (Channel 24; NASHVILLE, TN; Owner: SOUTH CENTRAL COMMUNICATIONS CORP.)
- WRMX-LP (Channel 12; NASHVILLE, TN; Owner: SOUTH CENTRAL COMMUNICATIONS CORP.)
- WJNK-LP (Channel 61; NASHVILLE, TN; Owner: THREE ANGELS BROADCASTING NETWORK, INC.)
- W52CT (Channel 52; NASHVILLE, TN; Owner: JKB ASSOCIATES, INC.)
- WSMV-TV (Channel 4; NASHVILLE, TN; Owner: MEREDITH CORPORATION)
- WZTV (Channel 17; NASHVILLE, TN; Owner: WZTV LICENSEE, LLC)
- WTVF (Channel 5; NASHVILLE, TN; Owner: NEWSCHANNEL 5 NETWORK, LP)
- WUXP-TV (Channel 30; NASHVILLE, TN; Owner: WUXP LICENSEE, LLC)
- WNPX (Channel 28; COOKEVILLE, TN; Owner: PAXSON COMMUNICATIONS LICENSE COMPANY, LLC)
- WKRN-TV (Channel 2; NASHVILLE, TN; Owner: WKRN, G.P.)
- WNPT (Channel 8; NASHVILLE, TN; Owner: NASHVILLE PUBLIC TELEVISION, INC.)
- WNPX-LP (Channel 20; NASHVILLE, TN; Owner: PAXSON COMMUNICATIONS LPTV, INC.)
- WNAB (Channel 58; NASHVILLE, TN; Owner: NASHVILLE LICENSE HOLDINGS, L.L.C.)
- WHTN (Channel 39; MURFREESBORO, TN; Owner: CHRISTIAN TELEVISION NETWORK, INC.)
- WPGD (Channel 50; HENDERSONVILLE, TN; Owner: TRINITY BROADCASTING NETWORK)
- WIIW-LP (Channel 14; NASHVILLE, TN; Owner: EQUITY BROADCASTING CORPORATION)
- WJFB (Channel 66; LEBANON, TN; Owner: BRYANT BROADCASTING, INC.)
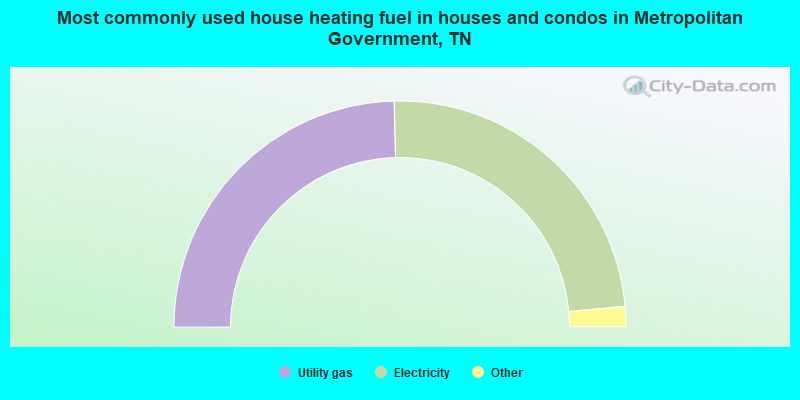
- 49.2%Utility gas
- 47.9%Electricity
- 1.9%Bottled, tank, or LP gas
- 0.4%Fuel oil, kerosene, etc.
- 0.4%Wood
- 0.1%No fuel used
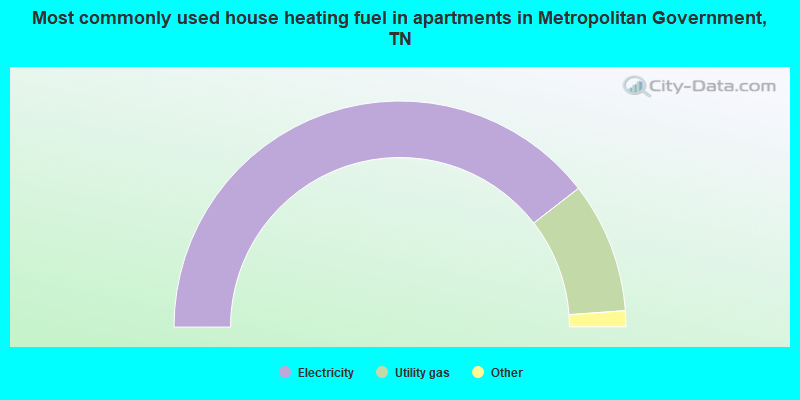
- 79.0%Electricity
- 18.7%Utility gas
- 0.9%Bottled, tank, or LP gas
- 0.6%No fuel used
- 0.6%Fuel oil, kerosene, etc.
Metropolitan Government compared to Tennessee state average:
- Median house value above state average.
- Unemployed percentage below state average.
- Median age below state average.
- Foreign-born population percentage significantly below state average.
- Renting percentage significantly below state average.
- Length of stay since moving in significantly above state average.
- Number of rooms per house significantly below state average.
- House age significantly below state average.
- Institutionalized population percentage significantly above state average.
Metropolitan Government, TN compared to other similar cities:
Metropolitan Government on our top lists:
- #1 on the list of "Top 101 cities with the lowest percentage of family households, population 100,000+"
- #2 on the list of "Top 101 cities with largest percentage of females in occupations: printing workers (population 50,000+)"
- #3 on the list of "Top 101 cities with largest percentage of males in occupations: entertainers and performers, sports, and related workers (population 50,000+)"
- #4 on the list of "Top 101 cities with largest percentage of males in industries: music stores (population 50,000+)"
- #4 on the list of "Top 101 cities with largest percentage of males in industries: book stores and news dealers (population 50,000+)"
- #4 on the list of "Top 101 cities with largest percentage of males in industries: printing and related support activities (population 50,000+)"
- #6 on the list of "Top 101 cities with largest percentage of females in industries: printing and related support activities (population 50,000+)"
- #6 on the list of "Top 101 cities with largest percentage of females in occupations: entertainers and performers, sports, and related workers (population 50,000+)"
- #8 on the list of "Top 101 cities with largest percentage of females in industries: music stores (population 50,000+)"
- #9 on the list of "Top 101 cities with largest percentage of males in occupations: painters and paperhangers (population 50,000+)"
- #9 on the list of "Top 101 cities with largest percentage of males in industries: motor vehicles, parts and supplies merchant wholesalers (population 50,000+)"
- #10 on the list of "Top 101 cities with largest percentage of females in industries: religious, grantmaking, civic, professional, and similar organizations (population 50,000+)"
- #10 on the list of "Top 101 cities with largest percentage of males in industries: textile mills and textile products (population 50,000+)"
- #11 on the list of "Top 101 cities with largest percentage of males in industries: publishing, and motion picture and sound recording industries (population 50,000+)"
- #11 on the list of "Top 101 cities with largest percentage of females in industries: book stores and news dealers (population 50,000+)"
- #11 on the list of "Top 101 cities with largest percentage of males in industries: religious, grantmaking, civic, professional, and similar organizations (population 50,000+)"
- #12 on the list of "Top 101 cities with largest percentage of males in occupations: media and communication equipment workers (population 50,000+)"
- #13 on the list of "Top 101 cities with largest percentage of males in industries: paper and paper products merchant wholesalers (population 50,000+)"
- #13 on the list of "Top 101 cities with largest percentage of females in industries: publishing, and motion picture and sound recording industries (population 50,000+)"
- #14 on the list of "Top 101 cities with largest percentage of females in occupations: construction trades workers except carpenters, electricians, painters, plumbers, and construction laborers (population 50,000+)"
- #15 on the list of "Top 101 counties with the most Black Protestant adherents"
- #21 on the list of "Top 101 counties with the most Evangelical Protestant adherents"
- #25 on the list of "Top 101 counties with the most Black Protestant congregations"
- #33 on the list of "Top 101 counties with the most Evangelical Protestant congregations"
- #40 on the list of "Top 101 counties with the most Orthodox adherents"
State forum archive:
- Tennessee Pages: 2 3 4 5 6 7 8 9 10 11 12 13 14 15 16 17 18 19 20 21 22 23 24 25 26 27 28 29 30 31 32
- Chattanooga Pages: 2 3 4 5 6 7 8 9 10 11 12 13
- Cookeville Pages: 2 3 4 5 6 7 8 9 10 11
- Kingsport - Johnson City - Bristol Pages: 2 3 4 5 6 7 8 9 10 11 12 13 14 15 16 17 18 19
- Knoxville Pages: 2 3 4 5 6 7 8 9 10 11 12 13 14 15 16 17 18 19 20 21 22 23 24 25 26 27 28 29 30 31
- Memphis Pages: 2 3 4 5 6 7 8 9 10 11 12 13 14 15 16 17 18 19 20
- Nashville Pages: 2 3 4 5 6 7 8 9 10 11 12 13 14 15 16 17 18 19 20 21 22 23 24 25 26 27 28 29 30 31 32 33 34 35 36 37 38 39 40 41 42 43 44 45 46 47 48 49 50 51 52 53 54 55 56 57