Estimated zip code population in 2022: 21,116 Zip code population in 2010: 15,786 Zip code population in 2000: 11,836
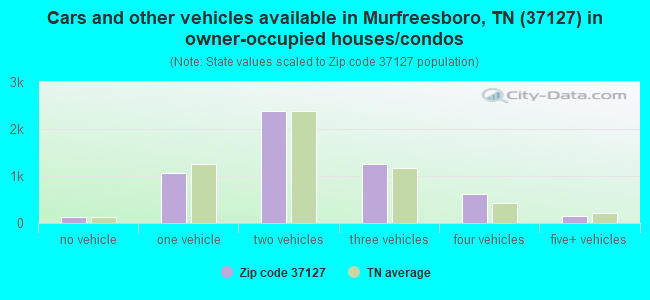
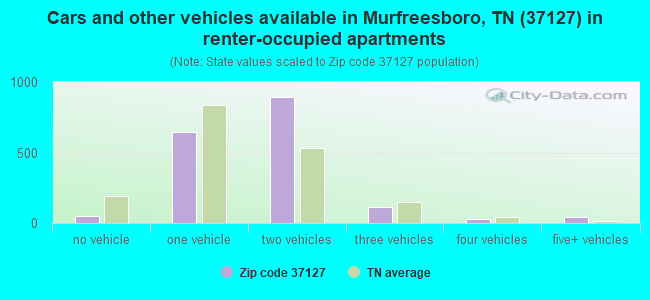
Houses and condos: 7,572 Renter-occupied apartments: 1,761
% of renters here:
24%
State:
33%
March 2022 cost of living index in zip code 37127: 89.0 (less than average, U.S. average is 100)
Land area: 48.5 sq. mi. Water area: 0.0 sq. mi.
Population density: 435 people per square mile
(low).
OSM Map
General Map
Google Map
MSN Map
OSM Map
General Map
Google Map
MSN Map
OSM Map
General Map
Google Map
MSN Map
OSM Map
General Map
Google Map
MSN Map
Please wait while loading the map...
Real estate property taxes paid for housing units in 2022:
This zip code:
0.4% ($1,568)
Tennessee:
0.5% ($1,376)
Median real estate property taxes paid for housing units with mortgages in 2022: $1,669 (0.4%) Median real estate property taxes paid for housing units with no mortgage in 2022: $1,448 (0.4%)
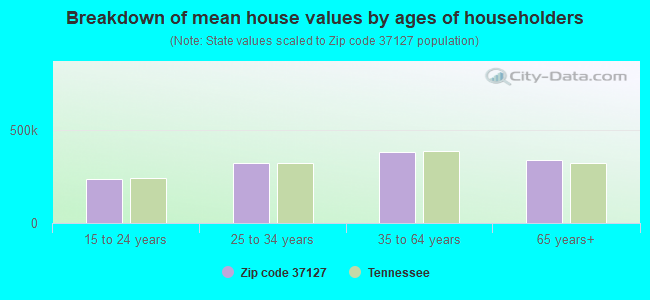
Estimated median house/condo value in 2022: $367,994
37127:
$367,994
Tennessee:
$284,800
According to our research of Tennessee and other state lists, there were 22 registered sex offenders living in 37127 zip code as of April 26, 2024. The ratio of all residents to sex offenders in zip code 37127 is 816 to 1. The ratio of registered sex offenders to all residents in this zip code is lower than the state average.
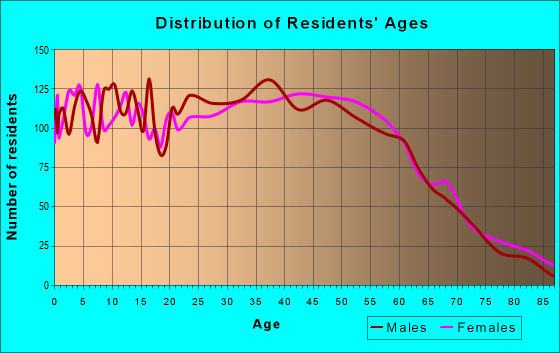
Median resident age:
This zip code:
33.7 years
Tennessee median age:
39.2 years
Average household size:
This zip code:
2.9 people
Tennessee:
2.4 people
Averages for the 2020 tax year for zip code 37127, filed in 2021:
Average Adjusted Gross Income (AGI) in 2020: $63,752 (Individual Income Tax Returns)
Here:
$63,752
State:
$69,014
Salary/wage: $55,884 (reported on 85.1% of returns)
Here:
$55,884
State:
$55,872
(% of AGI for various income ranges: 1125.0% for AGIs below $25k, 3576.7% for AGIs $25k-50k, 6454.2% for AGIs $50k-75k, 9350.6% for AGIs $75k-100k, 17190.8% for AGIs $100k-200k, 67206.7% for AGIs over 200k)
Taxable interest for individuals: $1,240 (reported on 24.4% of returns)
This zip code:
$1,240
Tennessee:
$1,945
(% of AGI for various income ranges: 11.2% for AGIs below $25k, 13.7% for AGIs $25k-50k, 24.5% for AGIs $50k-75k, 35.2% for AGIs $75k-100k, 120.2% for AGIs $100k-200k, 851.1% for AGIs over 200k)
Ordinary dividends: $4,089 (reported on 13.3% of returns)
Here:
$4,089
State:
$8,105
(% of AGI for various income ranges: 14.4% for AGIs below $25k, 21.5% for AGIs $25k-50k, 30.2% for AGIs $50k-75k, 39.2% for AGIs $75k-100k, 166.2% for AGIs $100k-200k, 2665.6% for AGIs over 200k)
Net capital gain/loss in AGI: +$10,749 (reported on 12.8% of returns)
Here:
+$10,749
State:
+$33,664
(% of AGI for various income ranges: 7.1% for AGIs below $25k, 16.8% for AGIs $25k-50k, 36.9% for AGIs $50k-75k, 60.2% for AGIs $75k-100k, 336.8% for AGIs $100k-200k, 10057.8% for AGIs over 200k)
Profit/loss from business: +$17,453 (reported on 17.2% of returns)
Here:
+$17,453
State:
+$18,991
(% of AGI for various income ranges: 100.2% for AGIs below $25k, 206.7% for AGIs $25k-50k, 238.1% for AGIs $50k-75k, 497.1% for AGIs $75k-100k, 892.1% for AGIs $100k-200k, 8956.7% for AGIs over 200k)
Taxable individual retirement arrangement distribution: $17,485 (reported on 6.7% of returns)
37127:
$17,485
Tennessee:
$20,036
(% of AGI for various income ranges: 32.3% for AGIs below $25k, 58.3% for AGIs $25k-50k, 108.2% for AGIs $50k-75k, 313.1% for AGIs $75k-100k, 526.0% for AGIs $100k-200k, 1135.6% for AGIs over 200k)
Self-employed (Keogh) retirement plans: $18,900 (reported on 0.2% of returns)
37127:
$18,900
Tennessee:
$28,955
(% of AGI for various income ranges: 41.5% for AGIs $100k-200k)
Total itemized deductions: $33,510 (reported on 5.1% of returns)
Here:
$33,510
State:
$40,136
(% of AGI for various income ranges: 19.9% for AGIs below $25k, 94.6% for AGIs $25k-50k, 226.6% for AGIs $50k-75k, 277.6% for AGIs $75k-100k, 565.1% for AGIs $100k-200k, 4785.6% for AGIs over 200k)
Charity contributions: $14,010 (reported on 4.3% of returns)
Here:
$14,010
State:
$19,852
(% of AGI for various income ranges: 17.8% for AGIs $25k-50k, 34.8% for AGIs $50k-75k, 80.6% for AGIs $75k-100k, 203.8% for AGIs $100k-200k, 2901.1% for AGIs over 200k)
Taxes paid: $4,777 (reported on 4.9% of returns)
37127:
$4,777
State:
$6,038
(% of AGI for various income ranges: 13.3% for AGIs $25k-50k, 26.0% for AGIs $50k-75k, 40.1% for AGIs $75k-100k, 88.7% for AGIs $100k-200k, 651.1% for AGIs over 200k)
Earned income credit: $2,190 (reported on 13.2% of returns)
Here:
$2,190
State:
$2,391
(% of AGI for various income ranges: 71.6% for AGIs below $25k, 57.6% for AGIs $25k-50k, 1.4% for AGIs $50k-75k)
Percentage of individuals using paid preparers for their 2020 taxes: 94.8%
Here:
95%
State:
93%
(% for various income ranges: 93.2% for AGIs below $25k, 95.4% for AGIs $25k-50k, 95.6% for AGIs $50k-75k, 96.4% for AGIs $75k-100k, 94.7% for AGIs $100k-200k, 96.6% for AGIs over 200k)
Averages for the 2012 tax year for zip code 37127, filed in 2013:
Average Adjusted Gross Income (AGI) in 2012: $55,289 (Individual Income Tax Returns)
Here:
$55,289
State:
$53,767
Salary/wage: $49,541 (reported on 87.5% of returns)
Here:
$49,541
State:
$45,421
(% of AGI for various income ranges: 78.1% for AGIs below $25k, 84.7% for AGIs $25k-50k, 82.5% for AGIs $50k-75k, 85.4% for AGIs $75k-100k, 81.0% for AGIs $100k-200k, 52.4% for AGIs over 200k)
Taxable interest for individuals: $1,360 (reported on 30.3% of returns)
This zip code:
$1,360
Tennessee:
$1,732
(% of AGI for various income ranges: 1.0% for AGIs below $25k, 0.5% for AGIs $25k-50k, 0.4% for AGIs $50k-75k, 0.3% for AGIs $75k-100k, 0.6% for AGIs $100k-200k, 2.1% for AGIs over 200k)
Ordinary dividends: $3,864 (reported on 13.7% of returns)
Here:
$3,864
State:
$6,739
(% of AGI for various income ranges: 1.7% for AGIs below $25k, 0.5% for AGIs $25k-50k, 0.4% for AGIs $50k-75k, 0.4% for AGIs $75k-100k, 0.9% for AGIs $100k-200k, 2.7% for AGIs over 200k)
Net capital gain/loss in AGI: +$6,057 (reported on 10.5% of returns)
Here:
+$6,057
State:
+$19,082
(% of AGI for various income ranges: 0.3% for AGIs $25k-50k, 0.5% for AGIs $75k-100k, 0.9% for AGIs $100k-200k, 5.5% for AGIs over 200k)
Profit/loss from business: +$15,926 (reported on 16.1% of returns)
Here:
+$15,926
State:
+$15,240
(% of AGI for various income ranges: 7.5% for AGIs below $25k, 3.1% for AGIs $25k-50k, 3.3% for AGIs $50k-75k, 2.2% for AGIs $75k-100k, 3.4% for AGIs $100k-200k, 11.8% for AGIs over 200k)
Taxable individual retirement arrangement distribution: $13,154 (reported on 7.4% of returns)
37127:
$13,154
Tennessee:
$15,505
(% of AGI for various income ranges: 2.0% for AGIs below $25k, 1.8% for AGIs $25k-50k, 2.3% for AGIs $50k-75k, 1.7% for AGIs $75k-100k, 2.3% for AGIs $100k-200k)
Self-employment retirement plans: $13,033 (reported on 0.4% of returns)
37127:
$13,033
Tennessee:
$22,567
Total itemized deductions: $18,415 (19% of AGI, reported on 28.6% of returns)
Here:
$18,415
State:
$21,976
Here:
19.2% of AGI
State:
17.8% of AGI
(% of AGI for various income ranges: 7.5% for AGIs below $25k, 9.6% for AGIs $25k-50k, 10.0% for AGIs $50k-75k, 10.2% for AGIs $75k-100k, 10.5% for AGIs $100k-200k, 7.3% for AGIs over 200k)
Charity contributions: $4,906 (reported on 22.9% of returns)
Here:
$4,906
State:
$6,709
(% of AGI for various income ranges: 0.9% for AGIs below $25k, 1.3% for AGIs $25k-50k, 1.9% for AGIs $50k-75k, 1.8% for AGIs $75k-100k, 2.4% for AGIs $100k-200k, 3.1% for AGIs over 200k)
Taxes paid: $3,893 (reported on 28.3% of returns)
37127:
$3,893
State:
$4,829
(% of AGI for various income ranges: 1.2% for AGIs below $25k, 1.7% for AGIs $25k-50k, 1.9% for AGIs $50k-75k, 2.1% for AGIs $75k-100k, 2.5% for AGIs $100k-200k, 1.7% for AGIs over 200k)
Earned income credit: $2,074 (reported on 16.1% of returns)
Here:
$2,074
State:
$2,404
(% of AGI for various income ranges: 5.5% for AGIs below $25k, 1.1% for AGIs $25k-50k)
Percentage of individuals using paid preparers for their 2012 taxes: 47.7%
Here:
48%
State:
52%
(% for various income ranges: 44.4% for AGIs below $25k, 48.9% for AGIs $25k-50k, 48.4% for AGIs $50k-75k, 47.1% for AGIs $75k-100k, 51.2% for AGIs $100k-200k, 76.9% for AGIs over 200k)
Averages for the 2004 tax year for zip code 37127, filed in 2005:
Average Adjusted Gross Income (AGI) in 2004: $50,631 (Individual Income Tax Returns)
Here:
$50,631
State:
$44,088
Salary/wage: $46,242 (reported on 89.0% of returns)
Here:
$46,242
State:
$38,825
(% of AGI for various income ranges: 145.0% for AGIs below $10k, 81.4% for AGIs $10k-25k, 87.4% for AGIs $25k-50k, 88.9% for AGIs $50k-75k, 89.9% for AGIs $75k-100k, 66.2% for AGIs over 100k)
Taxable interest for individuals: $1,242 (reported on 38.7% of returns)
This zip code:
$1,242
Tennessee:
$1,802
(% of AGI for various income ranges: 6.2% for AGIs below $10k, 1.8% for AGIs $10k-25k, 0.7% for AGIs $25k-50k, 0.7% for AGIs $50k-75k, 0.3% for AGIs $75k-100k, 1.3% for AGIs over 100k)
Taxable dividends: $1,875 (reported on 16.9% of returns)
Here:
$1,875
State:
$3,727
(% of AGI for various income ranges: 2.0% for AGIs below $10k, 0.7% for AGIs $10k-25k, 0.4% for AGIs $25k-50k, 0.4% for AGIs $50k-75k, 0.3% for AGIs $75k-100k, 1.0% for AGIs over 100k)
Net capital gain/loss: +$8,192 (reported on 13.8% of returns)
Here:
+$8,192
State:
+$15,776
(% of AGI for various income ranges: 2.3% for AGIs below $10k, 0.1% for AGIs $10k-25k, 0.4% for AGIs $25k-50k, 0.6% for AGIs $50k-75k, 0.5% for AGIs $75k-100k, 5.8% for AGIs over 100k)
Profit/loss from business: +$12,866 (reported on 16.4% of returns)
Here:
+$12,866
State:
+$12,882
(% of AGI for various income ranges: 4.9% for AGIs below $10k, 7.1% for AGIs $10k-25k, 3.8% for AGIs $25k-50k, 3.1% for AGIs $50k-75k, 4.0% for AGIs $75k-100k, 4.6% for AGIs over 100k)
IRA payment deduction: $2,489 (reported on 2.2% of returns)
37127:
$2,489
Tennessee:
$2,934
(% of AGI for various income ranges: 0.2% for AGIs $10k-25k, 0.2% for AGIs $25k-50k, 0.1% for AGIs $50k-75k, 0.1% for AGIs $75k-100k, 0.1% for AGIs over 100k)
Self-employed pension: $11,410 (reported on 0.6% of returns)
Here:
$11,410
Tennessee:
$16,857
Total itemized deductions: $15,365 (19% of AGI, reported on 37.2% of returns)
Here:
$15,365
State:
$18,035
Here:
19.0% of AGI
State:
19.9% of AGI
(% of AGI for various income ranges: 14.0% for AGIs below $10k, 9.2% for AGIs $10k-25k, 12.6% for AGIs $25k-50k, 12.9% for AGIs $50k-75k, 12.9% for AGIs $75k-100k, 8.9% for AGIs over 100k)
Charity contributions deductions: $3,622 (4% of AGI, reported on 31.5% of returns)
Here:
$3,622
State:
$5,167
Here:
4.2% of AGI
State:
5.3% of AGI
(% of AGI for various income ranges: 1.0% for AGIs below $10k, 1.1% for AGIs $10k-25k, 1.8% for AGIs $25k-50k, 2.3% for AGIs $50k-75k, 2.4% for AGIs $75k-100k, 2.7% for AGIs over 100k)
Total tax: $7,979 (reported on 79.3% of returns)
37127:
$7,979
State:
$7,482
(% of AGI for various income ranges: 4.0% for AGIs below $10k, 4.5% for AGIs $10k-25k, 6.9% for AGIs $25k-50k, 8.6% for AGIs $50k-75k, 10.5% for AGIs $75k-100k, 21.1% for AGIs over 100k)
Earned income credit: $1,561 (reported on 12.3% of returns)
Here:
$1,561
State:
$1,826
Percentage of individuals using paid preparers for their 2004 taxes: 54.6%
Here:
55%
State:
60%
(% for various income ranges: 45.6% for AGIs below $10k, 55.5% for AGIs $10k-25k, 58.6% for AGIs $25k-50k, 54.9% for AGIs $50k-75k, 51.5% for AGIs $75k-100k, 61.9% for AGIs over 100k)
Likely homosexual households (counted as self-reported same-sex unmarried-partner households)
Lesbian couples: 0.2% of all households
Gay men: 0.0% of all households
Household received Food Stamps/SNAP in the past 12 months: 427 Household did not receive Food Stamps/SNAP in the past 12 months: 6,924
Women who had a birth in the past 12 months: 468 (251 now married, 213 unmarried) Women who did not have a birth in the past 12 months: 4,856 (2,632 now married, 2,225 unmarried)
Housing units in zip code 37127 with a mortgage: 3,714 (336 second mortgage, 193 both second mortgage and home equity loan) Houses without a mortgage: 79
Median monthly owner costs for units with a mortgage: $1,653 Median monthly owner costs for units without a mortgage: $466
Residents with income below the poverty level in 2022:
This zip code:
9.6%
Whole state:
13.3%
Residents with income below 50% of the poverty level in 2022:
This zip code:
4.4%
Whole state:
7.1%
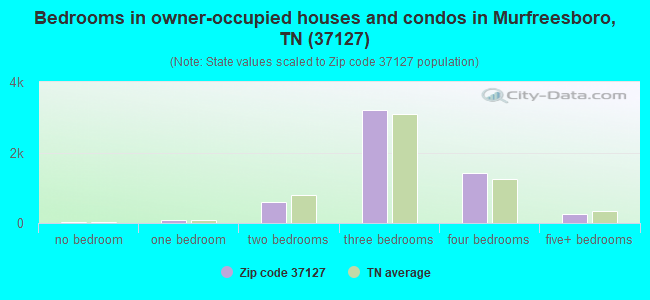
Median number of rooms in houses and condos:
Here:
6.9
State:
6.5
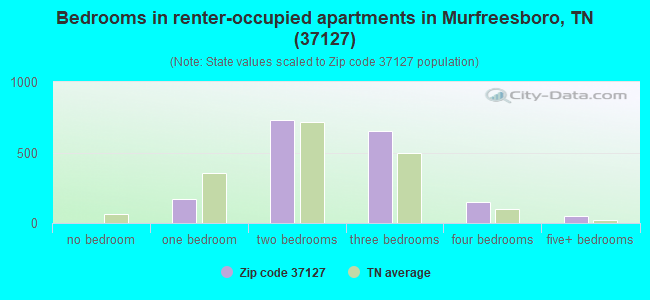
Median number of rooms in apartments:
Here:
4.6
State:
4.4
Notable locations in this zip code not listed on our city pages
Notable locations in zip code 37127: Murfreesboro Country Club (A), Murfreesboro Fire Department Station 2 (B), Southeast Rutherford Volunteer Fire Department (C). Display/hide their locations on the map
Churches in zip code 37127 include: Little Bethel Church (A), Prosperity Church (B), Gray Chapel (C), Pleasant View Church (D), Cedar Grove Church (E), Mount Zion Baptist Church (F), Mount Tabor Church (G), Mount Hermon Church (H), Rucker Baptist Church (I). Display/hide their locations on the map
Cemeteries: Works Cemetery (1), Webb Cemetery (2), Ward cemetery (3), Stroop Cemetery (4), Smith Cemetery (5), Ring Cemetery (6), Powell Cemetery (7). Display/hide their locations on the map
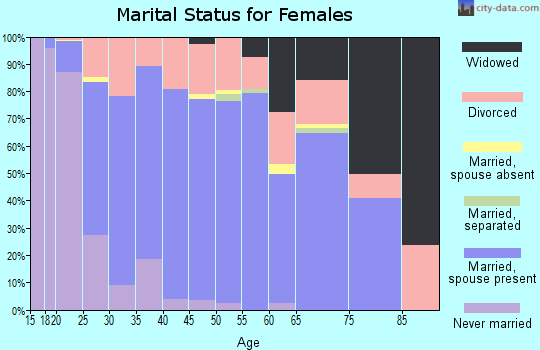
3,695 married couples with children.
1,290 single-parent households (117 men, 1,173 women).
91.2% of residents of 37127 zip code speak English at home.
3.7% of residents speak Spanish at home (70% very well, 22% well, 8% not well).
0.1% of residents speak other Indo-European language at home (38% very well, 62% well).
2.9% of residents speak Asian or Pacific Island language at home (62% very well, 12% well, 26% not well).
2.0% of residents speak other language at home (85% very well, 11% not well, 4% not at all).
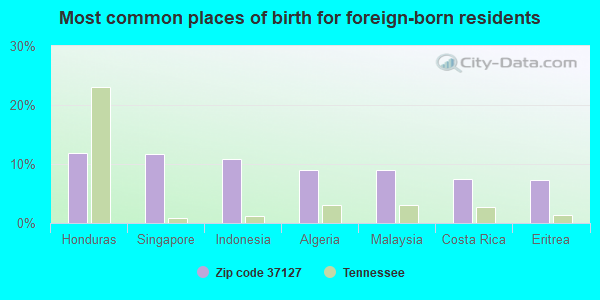
Foreign born population: 1,248 (5.9%) (63.0% of them are naturalized citizens)
Facilities with environmental interests located in this zip code:
BUCHANAN ELEMENTARY SCHOOL (6050 MANCHESTER HW in MURFREESBORO, TN)
(Geographic Names Information System) (National Center for Education Statistics) - STATE ID-0005 Organizations: RUTHERFORD COUNTY SCHOOL DIST (SCHOOL DISTRICT)
BUCHANAN ELEM. SCHOOL (6050 MANCHESTER HWY in MURFREESBORO, TN)
National Pollutant Discharge Elimination System NON-MAJOR (Tracking pollutant discharge elimination systems) - permit Business SIC classification: SEWERAGE SYSTEMS Organizations: BUCHANAN SCHOOL (CONTACT/OPERATOR)
, RUTHERFORD CO SCHOOLS-BUCHANAN (CONTACT/OWNER)
Alternative names: RUTHERFORD CO-BUCHANAN ES, RUTHERFORD COUNTY SCHOOLS
DEDICATED TRANSPORTATION SERVICE (225 NEW THOMAS LANE in MURFREESBORO, TN)
(Resource Conservation and Recovery Act (tracking hazardous waste)) Business NAICS classification: GENERAL AUTOMOTIVE REPAIR.
Housing units lacking complete plumbing facilities: 0.3% Housing units lacking complete kitchen facilities: 0.9%
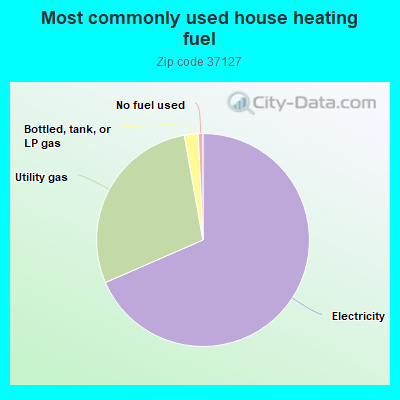
68.4%Electricity
28.7%Utility gas
2.1%Bottled, tank, or LP gas
0.7%No fuel used
Place of birth for U.S.-born residents:
This state: 11,856
Northeast: 893
Midwest: 2,415
South: 3,489
West: 774
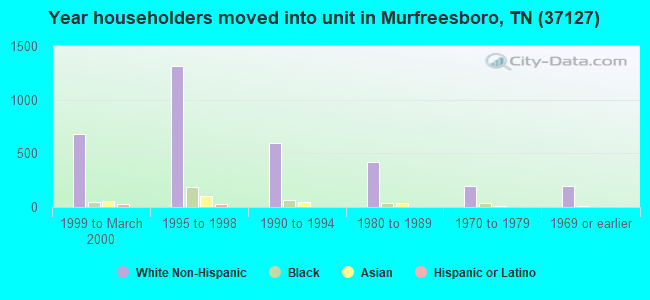
49% of the 37127 zip code residents lived in the same house 5 years ago. Out of people who lived in different houses, 58% lived in this county. Out of people who lived in different counties, 50% lived in Tennessee.
94% of the 37127 zip code residents lived in the same house 1 year ago. Out of people who lived in different houses, 43% moved from this county. Out of people who lived in different houses, 35% moved from different county within same state. Out of people who lived in different houses, 24% moved from different state. Out of people who lived in different houses, 3% moved from abroad.
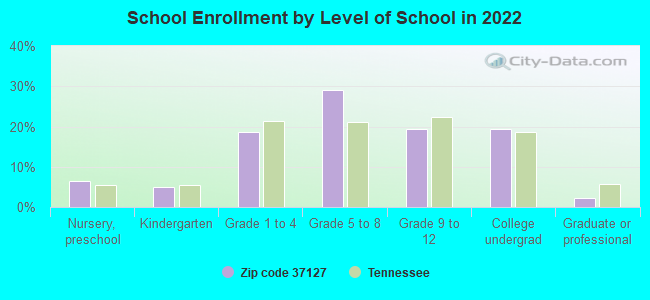
Private vs. public school enrollment:
Students in private schools in grades 1 to 8 (elementary and middle school): 547
Here:
22.3%
Tennessee:
15.0%
Students in private schools in grades 9 to 12 (high school): 278
Here:
28.2%
Tennessee:
16.2%
Students in private undergraduate colleges: 207
Here:
20.9%
Tennessee:
23.5%
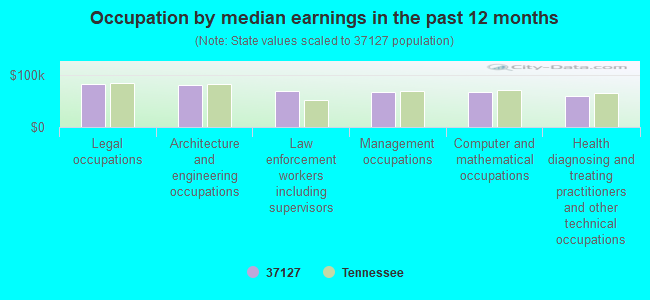
Occupation by median earnings in the past 12 months ($)
82,256Legal occupations
80,729Architecture and engineering occupations
68,299Law enforcement workers including supervisors
67,961Management occupations
67,079Computer and mathematical occupations
58,760Health diagnosing and treating practitioners and other technical occupations
Companies with federal contracts located in this zip code:
MUSIC WORLD (2762 S CHURCH ST in MURFREESBORO, TN; small business)
$8,451 with Army for Musical Instruments. Signed on 2005-09-07. Completion date: 2005-10-06.
ABERRANT SYSTEMS, INC (530 JOE B JACKSON PKWY in MURFREESBORO, TN; small business)
$0 with Defense Logistics Agency for Circuit Breakers. Signed on 2002-08-20. Completion date: 2004-08-20.
Top industries in this zip code by the number of employees in 2005:
Health Care and Social Assistance: Nursing Care Facilities (100-249 employees: 1 establishment)
Administrative and Support and Waste Management and Remediation Services: Landscaping Services (20-49: 1, 10-19: 2, 5-9: 1, 1-4: 4)
People in group quarters in 2010:
107 people in nursing facilities/skilled-nursing facilities
12 people in college/university student housing
People in group quarters in 2000:
121 people in nursing homes
10 people in other group homes
6 people in other noninstitutional group quarters
Fatal accident statistics in 2014:
Fatal accident count: 2
Vehicles involved in fatal accidents: 2
Fatal accidents caused by drunken drivers: 1
Fatalities: 2
Persons involved in fatal accidents: 2
Pedestrians involved in fatal accidents: 0
Fatal accident statistics in 2013:
Fatal accident count: 5
Vehicles involved in fatal accidents: 9
Fatal accidents caused by drunken drivers: 1
Fatalities: 5
Persons involved in fatal accidents: 13
Pedestrians involved in fatal accidents: 0
Home Mortgage Disclosure Act Aggregated Statistics For Year 2009 (Based on 2 full and 8 partial tracts)
A) FHA, FSA/RHS & VA Home Purchase Loans
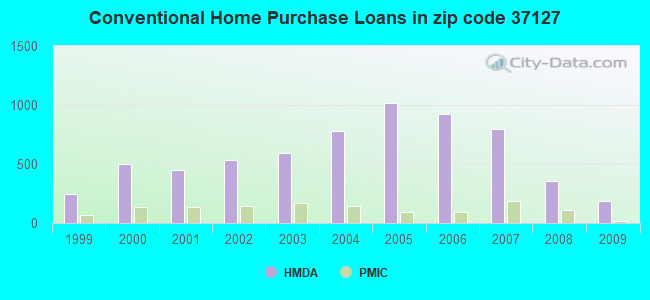
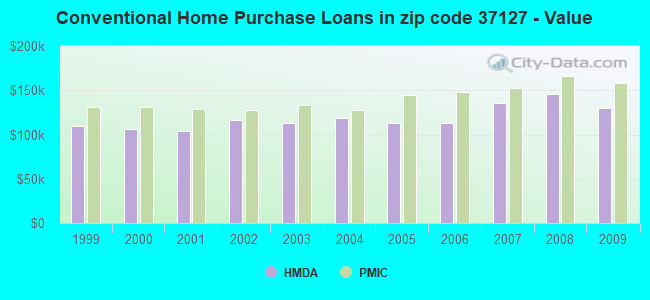
B) Conventional Home Purchase Loans
C) Refinancings
D) Home Improvement Loans
E) Loans on Dwellings For 5+ Families
F) Non-occupant Loans on < 5 Family Dwellings (A B C & D)
G) Loans On Manufactured Home Dwelling (A B C & D)
Number
Average Value
Number
Average Value
Number
Average Value
Number
Average Value
Number
Average Value
Number
Average Value
Number
Average Value
LOANS ORIGINATED
290
$156,613
184
$130,346
875
$154,757
40
$62,154
2
$210,905
81
$91,445
6
$58,278
APPLICATIONS APPROVED, NOT ACCEPTED
4
$156,208
2
$104,565
84
$158,712
5
$13,982
0
$0
4
$69,258
1
$30,620
APPLICATIONS DENIED
30
$139,816
21
$138,268
259
$171,025
45
$35,863
0
$0
9
$119,110
3
$61,913
APPLICATIONS WITHDRAWN
34
$172,191
40
$146,178
194
$150,700
2
$91,045
0
$0
9
$94,802
3
$41,660
FILES CLOSED FOR INCOMPLETENESS
9
$189,934
6
$140,428
47
$185,014
10
$155,867
0
$0
0
$0
0
$0
Aggregated Statistics For Year 2008 (Based on 2 full and 8 partial tracts)
A) FHA, FSA/RHS & VA Home Purchase Loans
B) Conventional Home Purchase Loans
C) Refinancings
D) Home Improvement Loans
E) Loans on Dwellings For 5+ Families
F) Non-occupant Loans on < 5 Family Dwellings (A B C & D)
G) Loans On Manufactured Home Dwelling (A B C & D)
Number
Average Value
Number
Average Value
Number
Average Value
Number
Average Value
Number
Average Value
Number
Average Value
Number
Average Value
LOANS ORIGINATED
185
$153,208
357
$146,271
561
$151,526
58
$37,447
2
$1,398,510
154
$122,236
8
$63,622
APPLICATIONS APPROVED, NOT ACCEPTED
8
$141,098
22
$137,146
64
$129,313
14
$36,282
0
$0
9
$81,237
1
$11,040
APPLICATIONS DENIED
34
$145,939
52
$134,134
353
$154,069
72
$54,326
1
$106,890
26
$90,958
7
$81,113
APPLICATIONS WITHDRAWN
10
$126,567
38
$143,405
136
$149,988
12
$28,054
0
$0
8
$116,005
0
$0
FILES CLOSED FOR INCOMPLETENESS
0
$0
5
$158,172
27
$144,566
5
$55,694
0
$0
2
$160,000
0
$0
Aggregated Statistics For Year 2007 (Based on 2 full and 8 partial tracts)
A) FHA, FSA/RHS & VA Home Purchase Loans
B) Conventional Home Purchase Loans
C) Refinancings
D) Home Improvement Loans
E) Loans on Dwellings For 5+ Families
F) Non-occupant Loans on < 5 Family Dwellings (A B C & D)
G) Loans On Manufactured Home Dwelling (A B C & D)
Number
Average Value
Number
Average Value
Number
Average Value
Number
Average Value
Number
Average Value
Number
Average Value
Number
Average Value
LOANS ORIGINATED
143
$153,376
798
$135,392
591
$133,767
93
$41,642
1
$3,285,370
214
$105,531
9
$82,051
APPLICATIONS APPROVED, NOT ACCEPTED
5
$151,028
58
$117,877
118
$103,041
31
$62,905
0
$0
19
$67,662
7
$81,704
APPLICATIONS DENIED
21
$150,965
113
$105,882
422
$135,936
125
$63,296
0
$0
34
$120,659
12
$82,795
APPLICATIONS WITHDRAWN
18
$123,516
84
$131,891
201
$144,325
37
$76,322
0
$0
23
$92,117
1
$87,080
FILES CLOSED FOR INCOMPLETENESS
0
$0
19
$173,916
50
$165,201
0
$0
0
$0
7
$104,539
0
$0
Aggregated Statistics For Year 2006 (Based on 2 full and 8 partial tracts)
A) FHA, FSA/RHS & VA Home Purchase Loans
B) Conventional Home Purchase Loans
C) Refinancings
D) Home Improvement Loans
E) Loans on Dwellings For 5+ Families
F) Non-occupant Loans on < 5 Family Dwellings (A B C & D)
G) Loans On Manufactured Home Dwelling (A B C & D)
Number
Average Value
Number
Average Value
Number
Average Value
Number
Average Value
Number
Average Value
Number
Average Value
Number
Average Value
LOANS ORIGINATED
134
$145,119
920
$112,568
514
$116,225
97
$48,384
3
$1,110,913
209
$95,018
10
$70,302
APPLICATIONS APPROVED, NOT ACCEPTED
2
$104,015
83
$107,197
95
$119,761
24
$26,100
0
$0
13
$95,992
8
$44,886
APPLICATIONS DENIED
5
$111,342
162
$104,588
446
$124,613
68
$38,690
0
$0
36
$72,229
14
$80,072
APPLICATIONS WITHDRAWN
10
$163,143
132
$130,700
329
$136,264
23
$80,803
0
$0
35
$87,144
5
$75,542
FILES CLOSED FOR INCOMPLETENESS
0
$0
24
$101,409
81
$129,222
2
$335,000
0
$0
4
$78,312
0
$0
Aggregated Statistics For Year 2005 (Based on 2 full and 8 partial tracts)
A) FHA, FSA/RHS & VA Home Purchase Loans
B) Conventional Home Purchase Loans
C) Refinancings
D) Home Improvement Loans
E) Loans on Dwellings For 5+ Families
F) Non-occupant Loans on < 5 Family Dwellings (A B C & D)
G) Loans On Manufactured Home Dwelling (A B C & D)
Number
Average Value
Number
Average Value
Number
Average Value
Number
Average Value
Number
Average Value
Number
Average Value
Number
Average Value
LOANS ORIGINATED
190
$132,347
1,017
$112,991
649
$116,708
67
$30,467
2
$12,149,345
224
$88,296
19
$62,987
APPLICATIONS APPROVED, NOT ACCEPTED
2
$133,000
110
$83,372
119
$105,868
26
$23,678
0
$0
12
$109,855
10
$46,676
APPLICATIONS DENIED
10
$113,042
136
$95,673
470
$114,289
72
$35,475
0
$0
15
$106,588
18
$68,837
APPLICATIONS WITHDRAWN
17
$129,474
126
$112,247
419
$126,464
28
$120,771
0
$0
24
$88,645
5
$76,804
FILES CLOSED FOR INCOMPLETENESS
0
$0
24
$113,304
52
$126,694
1
$68,270
0
$0
2
$68,915
1
$51,200
Aggregated Statistics For Year 2004 (Based on 2 full and 8 partial tracts)
A) FHA, FSA/RHS & VA Home Purchase Loans
B) Conventional Home Purchase Loans
C) Refinancings
D) Home Improvement Loans
E) Loans on Dwellings For 5+ Families
F) Non-occupant Loans on < 5 Family Dwellings (A B C & D)
G) Loans On Manufactured Home Dwelling (A B C & D)
Number
Average Value
Number
Average Value
Number
Average Value
Number
Average Value
Number
Average Value
Number
Average Value
Number
Average Value
LOANS ORIGINATED
216
$123,257
782
$118,906
735
$118,157
52
$41,590
4
$6,143,290
182
$86,946
11
$69,020
APPLICATIONS APPROVED, NOT ACCEPTED
1
$68,020
63
$83,858
142
$113,314
17
$55,046
1
$903,030
16
$68,268
18
$46,701
APPLICATIONS DENIED
18
$125,550
112
$88,264
565
$108,816
68
$26,753
0
$0
25
$74,278
22
$47,932
APPLICATIONS WITHDRAWN
17
$96,698
97
$121,928
336
$113,930
7
$66,134
1
$188,920
21
$115,231
6
$78,727
FILES CLOSED FOR INCOMPLETENESS
2
$171,755
20
$99,012
80
$136,294
8
$76,885
0
$0
1
$69,960
0
$0
Aggregated Statistics For Year 2003 (Based on 2 full and 8 partial tracts)
A) FHA, FSA/RHS & VA Home Purchase Loans
B) Conventional Home Purchase Loans
C) Refinancings
D) Home Improvement Loans
F) Non-occupant Loans on < 5 Family Dwellings (A B C & D)
Number
Average Value
Number
Average Value
Number
Average Value
Number
Average Value
Number
Average Value
LOANS ORIGINATED
300
$127,398
597
$112,532
1,529
$114,258
57
$16,954
162
$84,328
APPLICATIONS APPROVED, NOT ACCEPTED
3
$101,977
61
$121,393
198
$104,304
2
$14,230
12
$72,272
APPLICATIONS DENIED
31
$136,198
104
$96,033
482
$103,351
53
$17,077
31
$82,449
APPLICATIONS WITHDRAWN
15
$130,901
86
$135,643
314
$119,521
3
$25,900
30
$99,437
FILES CLOSED FOR INCOMPLETENESS
1
$100,410
21
$99,757
47
$122,884
2
$25,000
4
$80,500
Aggregated Statistics For Year 2002 (Based on 2 full and 8 partial tracts)
A) FHA, FSA/RHS & VA Home Purchase Loans
B) Conventional Home Purchase Loans
C) Refinancings
D) Home Improvement Loans
E) Loans on Dwellings For 5+ Families
F) Non-occupant Loans on < 5 Family Dwellings (A B C & D)
Number
Average Value
Number
Average Value
Number
Average Value
Number
Average Value
Number
Average Value
Number
Average Value
LOANS ORIGINATED
343
$115,729
535
$116,056
1,040
$117,131
57
$24,867
1
$17,901,920
185
$89,608
APPLICATIONS APPROVED, NOT ACCEPTED
2
$104,645
42
$87,184
165
$107,097
9
$35,256
0
$0
7
$58,241
APPLICATIONS DENIED
24
$100,791
86
$73,309
362
$96,666
44
$18,053
0
$0
13
$47,439
APPLICATIONS WITHDRAWN
20
$120,924
63
$114,305
194
$105,270
2
$5,000
0
$0
18
$93,844
FILES CLOSED FOR INCOMPLETENESS
3
$129,100
21
$111,529
54
$106,414
1
$30,120
0
$0
2
$80,205
Aggregated Statistics For Year 2001 (Based on 2 full and 8 partial tracts)
A) FHA, FSA/RHS & VA Home Purchase Loans
B) Conventional Home Purchase Loans
C) Refinancings
D) Home Improvement Loans
E) Loans on Dwellings For 5+ Families
F) Non-occupant Loans on < 5 Family Dwellings (A B C & D)
Number
Average Value
Number
Average Value
Number
Average Value
Number
Average Value
Number
Average Value
Number
Average Value
LOANS ORIGINATED
354
$112,426
448
$104,459
875
$110,249
68
$19,814
1
$1,554,720
120
$75,320
APPLICATIONS APPROVED, NOT ACCEPTED
4
$96,545
50
$101,812
98
$92,411
18
$17,269
0
$0
6
$49,947
APPLICATIONS DENIED
49
$102,104
145
$78,961
377
$84,664
77
$13,150
0
$0
9
$54,494
APPLICATIONS WITHDRAWN
23
$99,530
37
$110,286
202
$96,111
13
$26,265
0
$0
10
$58,081
FILES CLOSED FOR INCOMPLETENESS
4
$88,628
28
$107,219
40
$91,256
0
$0
0
$0
2
$47,815
Aggregated Statistics For Year 2000 (Based on 2 full and 8 partial tracts)
A) FHA, FSA/RHS & VA Home Purchase Loans
B) Conventional Home Purchase Loans
C) Refinancings
D) Home Improvement Loans
E) Loans on Dwellings For 5+ Families
F) Non-occupant Loans on < 5 Family Dwellings (A B C & D)
Number
Average Value
Number
Average Value
Number
Average Value
Number
Average Value
Number
Average Value
Number
Average Value
LOANS ORIGINATED
351
$102,348
501
$106,056
269
$100,233
76
$15,317
0
$0
81
$92,826
APPLICATIONS APPROVED, NOT ACCEPTED
3
$55,647
53
$81,357
86
$91,852
20
$22,918
0
$0
9
$82,639
APPLICATIONS DENIED
37
$86,833
158
$77,925
291
$85,926
66
$21,265
0
$0
18
$95,837
APPLICATIONS WITHDRAWN
22
$93,040
54
$103,248
156
$72,320
13
$15,585
1
$58,300
13
$82,556
FILES CLOSED FOR INCOMPLETENESS
7
$113,166
12
$135,819
34
$99,397
0
$0
0
$0
0
$0
Aggregated Statistics For Year 1999 (Based on 1 full and 4 partial tracts)
A) FHA, FSA/RHS & VA Home Purchase Loans
B) Conventional Home Purchase Loans
C) Refinancings
D) Home Improvement Loans
E) Loans on Dwellings For 5+ Families
F) Non-occupant Loans on < 5 Family Dwellings (A B C & D)
2002 - 2018 National Fire Incident Reporting System (NFIRS) incidents
According to the data from the years 2002 - 2018 the average number of fires per year is 39. The highest number of reported fires - 81 took place in 2018, and the least - 13 in 2004. The data has a rising trend.
When looking into fire subcategories, the most reports belonged to: Outside Fires (41.3%), and Structure Fires (37.2%).
Fire incident types reported to NFIRS in Zip Code 37127


 Nearest zip codes: 37132, 37037, 37130, 37149, 37128, 37020.
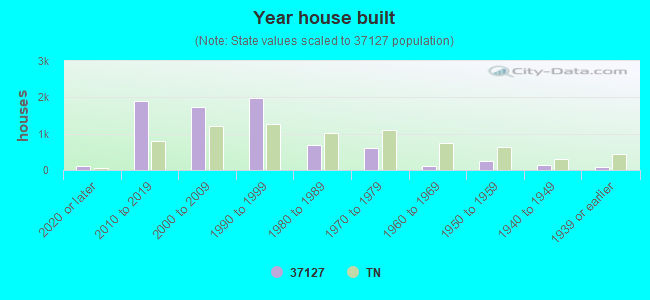


 According to the data from the years 2002 - 2018 the average number of fires per year is 39. The highest number of reported fires - 81 took place in 2018, and the least - 13 in 2004. The data has a rising trend.
 When looking into fire subcategories, the most reports belonged to: Outside Fires (41.3%), and Structure Fires (37.2%).