Estimated zip code population in 2022: 59,189 Zip code population in 2010: 52,070 Zip code population in 2000: 43,564
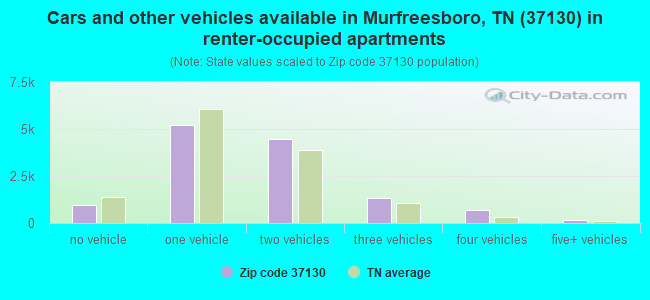
Houses and condos: 27,031 Renter-occupied apartments: 12,783
% of renters here:
52%
State:
33%
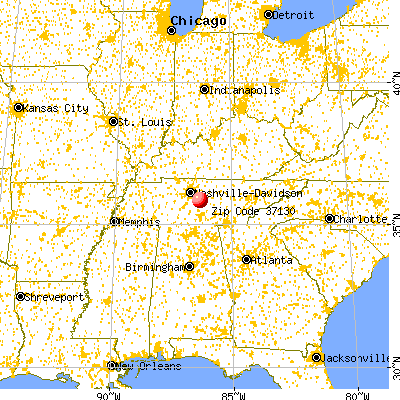
March 2022 cost of living index in zip code 37130: 90.5 (less than average, U.S. average is 100)
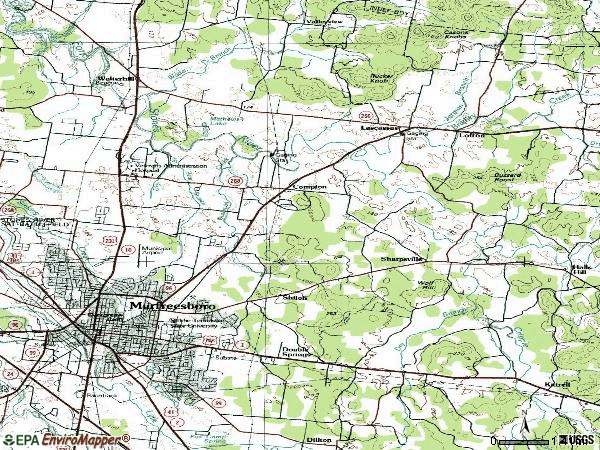
Land area: 52.3 sq. mi. Water area: 0.1 sq. mi.
Population density: 1,131 people per square mile
(low).
OSM Map
General Map
Google Map
MSN Map
OSM Map
General Map
Google Map
MSN Map
OSM Map
General Map
Google Map
MSN Map
OSM Map
General Map
Google Map
MSN Map
Please wait while loading the map...
Real estate property taxes paid for housing units in 2022:
This zip code:
0.5% ($1,732)
Tennessee:
0.5% ($1,376)
Median real estate property taxes paid for housing units with mortgages in 2022: $1,776 (0.4%) Median real estate property taxes paid for housing units with no mortgage in 2022: $1,651 (0.5%)
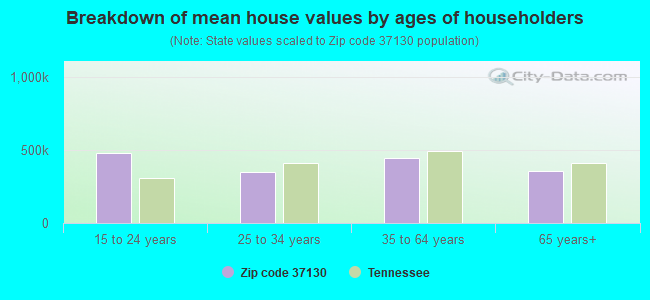
Estimated median house/condo value in 2022: $369,958
37130:
$369,958
Tennessee:
$284,800
According to our research of Tennessee and other state lists, there were 123 registered sex offenders living in 37130 zip code as of April 27, 2024. The ratio of all residents to sex offenders in zip code 37130 is 456 to 1. The ratio of registered sex offenders to all residents in this zip code is lower than the state average.
Median resident age:
This zip code:
33.0 years
Tennessee median age:
39.2 years
Average household size:
This zip code:
2.4 people
Tennessee:
2.4 people
Averages for the 2020 tax year for zip code 37130, filed in 2021:
Average Adjusted Gross Income (AGI) in 2020: $56,127 (Individual Income Tax Returns)
Here:
$56,127
State:
$69,014
Salary/wage: $46,432 (reported on 86.1% of returns)
Here:
$46,432
State:
$55,872
(% of AGI for various income ranges: 1222.4% for AGIs below $25k, 3699.0% for AGIs $25k-50k, 6496.6% for AGIs $50k-75k, 9581.6% for AGIs $75k-100k, 17795.0% for AGIs $100k-200k, 75275.9% for AGIs over 200k)
Taxable interest for individuals: $1,891 (reported on 19.7% of returns)
This zip code:
$1,891
Tennessee:
$1,945
(% of AGI for various income ranges: 6.9% for AGIs below $25k, 12.9% for AGIs $25k-50k, 33.7% for AGIs $50k-75k, 57.1% for AGIs $75k-100k, 179.3% for AGIs $100k-200k, 1620.3% for AGIs over 200k)
Ordinary dividends: $8,103 (reported on 11.7% of returns)
Here:
$8,103
State:
$8,105
(% of AGI for various income ranges: 9.6% for AGIs below $25k, 11.9% for AGIs $25k-50k, 50.2% for AGIs $50k-75k, 102.7% for AGIs $75k-100k, 414.3% for AGIs $100k-200k, 5556.9% for AGIs over 200k)
Net capital gain/loss in AGI: +$21,855 (reported on 11.3% of returns)
Here:
+$21,855
State:
+$33,664
(% of AGI for various income ranges: 6.6% for AGIs below $25k, 16.8% for AGIs $25k-50k, 54.6% for AGIs $50k-75k, 157.3% for AGIs $75k-100k, 697.7% for AGIs $100k-200k, 18179.7% for AGIs over 200k)
Profit/loss from business: +$20,850 (reported on 16.2% of returns)
Here:
+$20,850
State:
+$18,991
(% of AGI for various income ranges: 111.3% for AGIs below $25k, 137.6% for AGIs $25k-50k, 257.7% for AGIs $50k-75k, 568.8% for AGIs $75k-100k, 1265.6% for AGIs $100k-200k, 14702.8% for AGIs over 200k)
Taxable individual retirement arrangement distribution: $20,299 (reported on 5.7% of returns)
37130:
$20,299
Tennessee:
$20,036
(% of AGI for various income ranges: 17.1% for AGIs below $25k, 42.4% for AGIs $25k-50k, 150.4% for AGIs $50k-75k, 295.1% for AGIs $75k-100k, 818.5% for AGIs $100k-200k, 2865.2% for AGIs over 200k)
Self-employed (Keogh) retirement plans: $26,123 (reported on 0.5% of returns)
37130:
$26,123
Tennessee:
$28,955
(% of AGI for various income ranges: 49.9% for AGIs $100k-200k, 926.9% for AGIs over 200k)
Total itemized deductions: $34,714 (reported on 4.9% of returns)
Here:
$34,714
State:
$40,136
(% of AGI for various income ranges: 16.2% for AGIs below $25k, 66.8% for AGIs $25k-50k, 189.0% for AGIs $50k-75k, 363.3% for AGIs $75k-100k, 866.6% for AGIs $100k-200k, 6564.5% for AGIs over 200k)
Charity contributions: $15,522 (reported on 4.2% of returns)
Here:
$15,522
State:
$19,852
(% of AGI for various income ranges: 2.2% for AGIs below $25k, 11.0% for AGIs $25k-50k, 37.1% for AGIs $50k-75k, 103.5% for AGIs $75k-100k, 329.1% for AGIs $100k-200k, 3539.0% for AGIs over 200k)
Taxes paid: $5,891 (reported on 4.5% of returns)
37130:
$5,891
State:
$6,038
(% of AGI for various income ranges: 1.9% for AGIs below $25k, 6.9% for AGIs $25k-50k, 25.8% for AGIs $50k-75k, 55.1% for AGIs $75k-100k, 154.7% for AGIs $100k-200k, 1102.1% for AGIs over 200k)
Earned income credit: $2,189 (reported on 19.5% of returns)
Here:
$2,189
State:
$2,391
(% of AGI for various income ranges: 87.9% for AGIs below $25k, 60.9% for AGIs $25k-50k, 1.1% for AGIs $50k-75k)
Percentage of individuals using paid preparers for their 2020 taxes: 93.8%
Here:
94%
State:
93%
(% for various income ranges: 93.0% for AGIs below $25k, 95.2% for AGIs $25k-50k, 93.7% for AGIs $50k-75k, 91.9% for AGIs $75k-100k, 93.9% for AGIs $100k-200k, 93.4% for AGIs over 200k)
Averages for the 2012 tax year for zip code 37130, filed in 2013:
Average Adjusted Gross Income (AGI) in 2012: $43,799 (Individual Income Tax Returns)
Here:
$43,799
State:
$53,767
Salary/wage: $37,477 (reported on 88.2% of returns)
Here:
$37,477
State:
$45,421
(% of AGI for various income ranges: 84.8% for AGIs below $25k, 86.4% for AGIs $25k-50k, 79.1% for AGIs $50k-75k, 76.6% for AGIs $75k-100k, 73.6% for AGIs $100k-200k, 57.2% for AGIs over 200k)
Taxable interest for individuals: $1,583 (reported on 22.3% of returns)
This zip code:
$1,583
Tennessee:
$1,732
(% of AGI for various income ranges: 0.5% for AGIs below $25k, 0.5% for AGIs $25k-50k, 0.7% for AGIs $50k-75k, 0.6% for AGIs $75k-100k, 0.8% for AGIs $100k-200k, 1.4% for AGIs over 200k)
Ordinary dividends: $5,546 (reported on 11.5% of returns)
Here:
$5,546
State:
$6,739
(% of AGI for various income ranges: 0.7% for AGIs below $25k, 0.6% for AGIs $25k-50k, 0.9% for AGIs $50k-75k, 0.8% for AGIs $75k-100k, 1.4% for AGIs $100k-200k, 3.7% for AGIs over 200k)
Net capital gain/loss in AGI: +$10,233 (reported on 8.9% of returns)
Here:
+$10,233
State:
+$19,082
(% of AGI for various income ranges: 0.2% for AGIs $25k-50k, 0.5% for AGIs $50k-75k, 0.5% for AGIs $75k-100k, 1.4% for AGIs $100k-200k, 8.2% for AGIs over 200k)
Profit/loss from business: +$18,751 (reported on 14.0% of returns)
Here:
+$18,751
State:
+$15,240
(% of AGI for various income ranges: 6.3% for AGIs below $25k, 2.7% for AGIs $25k-50k, 3.4% for AGIs $50k-75k, 4.1% for AGIs $75k-100k, 6.1% for AGIs $100k-200k, 11.6% for AGIs over 200k)
Taxable individual retirement arrangement distribution: $14,205 (reported on 6.2% of returns)
37130:
$14,205
Tennessee:
$15,505
(% of AGI for various income ranges: 1.2% for AGIs below $25k, 1.3% for AGIs $25k-50k, 2.0% for AGIs $50k-75k, 2.5% for AGIs $75k-100k, 3.1% for AGIs $100k-200k, 1.8% for AGIs over 200k)
Self-employment retirement plans: $19,433 (reported on 0.5% of returns)
37130:
$19,433
Tennessee:
$22,567
(% of AGI for various income ranges: 0.1% for AGIs $25k-50k, 0.3% for AGIs $100k-200k, 0.7% for AGIs over 200k)
Total itemized deductions: $20,345 (18% of AGI, reported on 18.9% of returns)
Here:
$20,345
State:
$21,976
Here:
18.4% of AGI
State:
17.8% of AGI
(% of AGI for various income ranges: 3.9% for AGIs below $25k, 6.7% for AGIs $25k-50k, 9.9% for AGIs $50k-75k, 10.8% for AGIs $75k-100k, 11.9% for AGIs $100k-200k, 8.9% for AGIs over 200k)
Charity contributions: $5,981 (reported on 15.5% of returns)
Here:
$5,981
State:
$6,709
(% of AGI for various income ranges: 0.4% for AGIs below $25k, 1.0% for AGIs $25k-50k, 1.7% for AGIs $50k-75k, 2.5% for AGIs $75k-100k, 3.2% for AGIs $100k-200k, 3.3% for AGIs over 200k)
Taxes paid: $4,393 (reported on 18.5% of returns)
37130:
$4,393
State:
$4,829
(% of AGI for various income ranges: 0.6% for AGIs below $25k, 1.1% for AGIs $25k-50k, 2.0% for AGIs $50k-75k, 2.3% for AGIs $75k-100k, 2.9% for AGIs $100k-200k, 1.9% for AGIs over 200k)
Earned income credit: $2,171 (reported on 22.9% of returns)
Here:
$2,171
State:
$2,404
(% of AGI for various income ranges: 6.3% for AGIs below $25k, 1.2% for AGIs $25k-50k)
Percentage of individuals using paid preparers for their 2012 taxes: 47.6%
Here:
48%
State:
52%
(% for various income ranges: 44.3% for AGIs below $25k, 46.9% for AGIs $25k-50k, 51.6% for AGIs $50k-75k, 50.0% for AGIs $75k-100k, 57.6% for AGIs $100k-200k, 76.0% for AGIs over 200k)
Averages for the 2004 tax year for zip code 37130, filed in 2005:
Average Adjusted Gross Income (AGI) in 2004: $40,680 (Individual Income Tax Returns)
Here:
$40,680
State:
$44,088
Salary/wage: $35,524 (reported on 88.6% of returns)
Here:
$35,524
State:
$38,825
(% of AGI for various income ranges: 100.8% for AGIs below $10k, 84.9% for AGIs $10k-25k, 86.8% for AGIs $25k-50k, 83.1% for AGIs $50k-75k, 82.7% for AGIs $75k-100k, 62.9% for AGIs over 100k)
Taxable interest for individuals: $1,689 (reported on 31.1% of returns)
This zip code:
$1,689
Tennessee:
$1,802
(% of AGI for various income ranges: 1.9% for AGIs below $10k, 1.4% for AGIs $10k-25k, 1.0% for AGIs $25k-50k, 1.3% for AGIs $50k-75k, 1.2% for AGIs $75k-100k, 1.4% for AGIs over 100k)
Taxable dividends: $2,773 (reported on 15.5% of returns)
Here:
$2,773
State:
$3,727
(% of AGI for various income ranges: 1.3% for AGIs below $10k, 0.6% for AGIs $10k-25k, 0.6% for AGIs $25k-50k, 0.7% for AGIs $50k-75k, 0.9% for AGIs $75k-100k, 1.6% for AGIs over 100k)
Net capital gain/loss: +$9,769 (reported on 12.6% of returns)
Here:
+$9,769
State:
+$15,776
(% of AGI for various income ranges: -0.5% for AGIs below $10k, 0.3% for AGIs $10k-25k, 0.4% for AGIs $25k-50k, 0.8% for AGIs $50k-75k, 1.3% for AGIs $75k-100k, 7.4% for AGIs over 100k)
Profit/loss from business: +$18,522 (reported on 13.6% of returns)
Here:
+$18,522
State:
+$12,882
(% of AGI for various income ranges: 3.4% for AGIs below $10k, 4.9% for AGIs $10k-25k, 2.5% for AGIs $25k-50k, 3.0% for AGIs $50k-75k, 3.7% for AGIs $75k-100k, 11.4% for AGIs over 100k)
IRA payment deduction: $2,421 (reported on 1.5% of returns)
37130:
$2,421
Tennessee:
$2,934
(% of AGI for various income ranges: 0.1% for AGIs below $10k, 0.1% for AGIs $10k-25k, 0.1% for AGIs $25k-50k, 0.1% for AGIs $50k-75k, 0.1% for AGIs $75k-100k, 0.1% for AGIs over 100k)
Self-employed pension: $16,109 (reported on 0.7% of returns)
Here:
$16,109
Tennessee:
$16,857
(% of AGI for various income ranges: 0.1% for AGIs $10k-25k, 0.1% for AGIs $50k-75k, 0.1% for AGIs $75k-100k, 0.7% for AGIs over 100k)
Total itemized deductions: $16,950 (20% of AGI, reported on 24.8% of returns)
Here:
$16,950
State:
$18,035
Here:
19.7% of AGI
State:
19.9% of AGI
(% of AGI for various income ranges: 4.7% for AGIs below $10k, 5.8% for AGIs $10k-25k, 9.3% for AGIs $25k-50k, 12.3% for AGIs $50k-75k, 13.8% for AGIs $75k-100k, 10.7% for AGIs over 100k)
Charity contributions deductions: $4,858 (5% of AGI, reported on 20.9% of returns)
Here:
$4,858
State:
$5,167
Here:
5.3% of AGI
State:
5.3% of AGI
(% of AGI for various income ranges: 0.4% for AGIs below $10k, 0.7% for AGIs $10k-25k, 1.5% for AGIs $25k-50k, 2.3% for AGIs $50k-75k, 2.7% for AGIs $75k-100k, 3.9% for AGIs over 100k)
Total tax: $6,839 (reported on 72.3% of returns)
37130:
$6,839
State:
$7,482
(% of AGI for various income ranges: 2.3% for AGIs below $10k, 4.2% for AGIs $10k-25k, 7.1% for AGIs $25k-50k, 9.1% for AGIs $50k-75k, 10.7% for AGIs $75k-100k, 20.5% for AGIs over 100k)
Earned income credit: $1,681 (reported on 18.6% of returns)
Here:
$1,681
State:
$1,826
Percentage of individuals using paid preparers for their 2004 taxes: 54.0%
Here:
54%
State:
60%
(% for various income ranges: 46.5% for AGIs below $10k, 56.3% for AGIs $10k-25k, 55.4% for AGIs $25k-50k, 54.9% for AGIs $50k-75k, 54.1% for AGIs $75k-100k, 63.6% for AGIs over 100k)
Likely homosexual households (counted as self-reported same-sex unmarried-partner households)
Lesbian couples: 0.1% of all households
Gay men: 0.1% of all households
Household received Food Stamps/SNAP in the past 12 months: 2,473 Household did not receive Food Stamps/SNAP in the past 12 months: 22,006
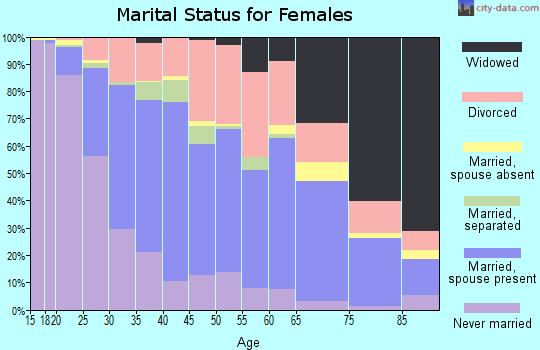
Women who had a birth in the past 12 months: 1,215 (806 now married, 407 unmarried) Women who did not have a birth in the past 12 months: 15,864 (5,055 now married, 10,804 unmarried)
Housing units in zip code 37130 with a mortgage: 7,547 (627 second mortgage, 180 home equity loan, 454 both second mortgage and home equity loan) Houses without a mortgage: 297
Median monthly owner costs for units with a mortgage: $1,510 Median monthly owner costs for units without a mortgage: $508
Residents with income below the poverty level in 2022:
This zip code:
16.7%
Whole state:
13.3%
Residents with income below 50% of the poverty level in 2022:
This zip code:
8.2%
Whole state:
7.1%
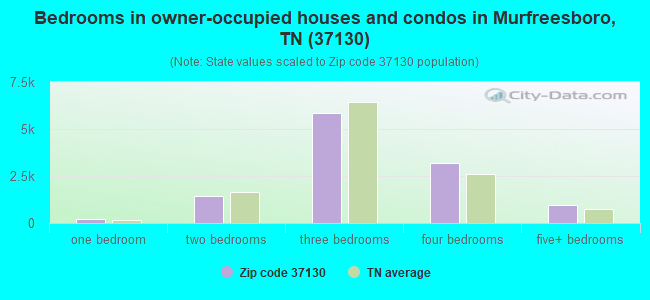
Median number of rooms in houses and condos:
Here:
6.7
State:
6.5
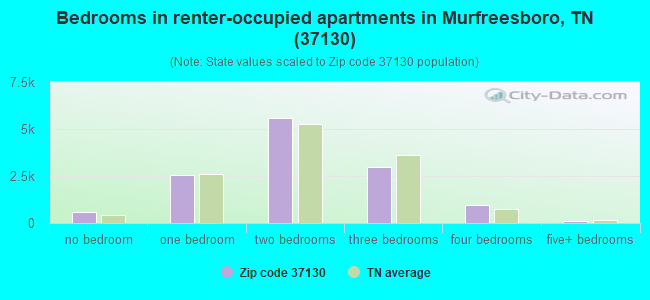
Median number of rooms in apartments:
Here:
4.1
State:
4.4
Notable locations in this zip code not listed on our city pages
Notable locations in zip code 37130: Foxfire Farm (A), Rutherford County Landfill (B), Woodmore Cafeteria (C), Wood Hall (D), Voorhies Industrial Studies Building (E), Todd Library (F), Smith Hall (G), Sims Hall (H), Saunders Fine Arts Building (I), Rutledge Hall (J), Peck Hall (K), Nicks Hall (L), Murphy Athletic Center (M), Kirksey Old Main (N), Judd Hall (O), Jones Hall (P), James Union Building (Q), Gracy Hall (R), Gore Hall (S), Forrest Hall (T). Display/hide their locations on the map
Shopping Centers: Plaza South Shopping Center (1), Northfield Crossing Shopping Center (2), Mercury Plaza Shopping Center (3), Memorial Village Shopping Center (4), Coronado Square Shopping Center (5). Display/hide their locations on the map
Churches in zip code 37130 include: Little Bethel Church (A), Republican Grove Church (B), Bethlehem Church (C), Christianship Ministries Gathering of Disciples (D), Taylors Chapel (E), Walnut Grove Church (F), Woodbury Road Church (G), Haynes Chapel (H), Walter Hill Church (I). Display/hide their locations on the map
Cemeteries: Thompson Cemetery (1), Yandell Cemetery (2), Wrather Cemetery (3), Weatherly Cemetery (4), Watkins Cemetery (5), Wade Cemetery (6), Thompson Cemetery (7). Display/hide their locations on the map
Reservoirs: Todds Lake (A), Walter Hill Lake (B), Browns Mill Lake (C), Mathews Lake (D), Todds Lake Number Two (E). Display/hide their locations on the map
Streams, rivers, and creeks: Double Springs Branch (A), Bradley Creek (B), Cripple Creek (C), Bear Branch (D), Wades Branch (E), Bushman Creek (F). Display/hide their locations on the map
6,328 married couples with children.
3,369 single-parent households (675 men, 2,694 women).
87.4% of residents of 37130 zip code speak English at home.
8.1% of residents speak Spanish at home (64% very well, 12% well, 15% not well, 9% not at all).
0.9% of residents speak other Indo-European language at home (95% very well, 5% well).
2.0% of residents speak Asian or Pacific Island language at home (66% very well, 19% well, 16% not well).
1.6% of residents speak other language at home (70% very well, 11% well, 18% not well).
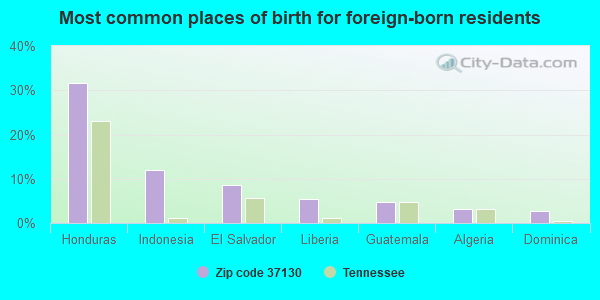
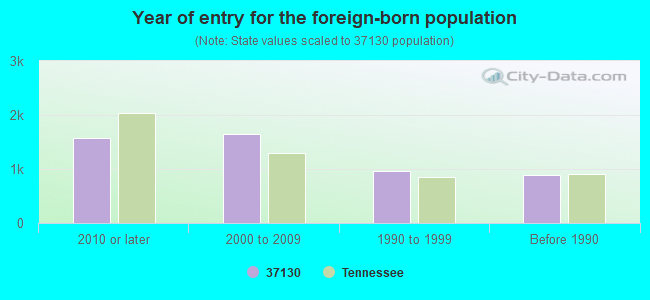
Foreign born population: 4,294 (7.3%) (35.1% of them are naturalized citizens)
Major facilities with environmental interests located in this zip code:
BRADLEY ELEMENTARY SCHOOL (511 MERCURY BL in MURFREESBORO, TN)
(Geographic Names Information System) (National Center for Education Statistics) - STATE ID-0010 Organizations: MURFREESBORO CITY ELEM SCH DIS (SCHOOL DISTRICT)
CENTRAL MIDDLE SCHOOL (701 EAST MAIN ST in MURFREESBORO, TN)
(Geographic Names Information System) (National Center for Education Statistics) - STATE ID-0010 Organizations: RUTHERFORD COUNTY SCHOOL DIST (SCHOOL DISTRICT)
AMERICAN COLORS INC (1201 HALEY RD. in MURFREESBORO, TN)
AIR SYNTHETIC MINOR (AIRS/AFS) HAZARDOUS WASTE BIENNIAL REPORTER (Resource Conservation and Recovery Act (tracking hazardous waste)) Large Quantity Generators, more that 1000 kg of hazardous waste/month (Resource Conservation and Recovery Act (tracking hazardous waste)) TRI REPORTER (Tracking of toxic chemicals releasing facilities) Business SIC classification: PLASTICS MATERIALS, SYNTHETIC RESINS, AND NONVULCANIZABLE ELASTOMERS; PAINTS, VARNISHES, LACQUERS, ENAMELS, AND ALLIED PRODUCTS Organizations: JIM HALLOCK, VICE PRESIDENT (CONTACT/OPERATOR)
DANIEL MCKEE ALTERNATIVE SCHOOL (2623 HALLS HILL PK in MURFREESBORO, TN)
(National Center for Education Statistics) - STATE ID-0027 Organizations: RUTHERFORD COUNTY SCHOOL DIST (SCHOOL DISTRICT)
CHROMALOX DIVISION, EMERSON ELECTRIC (600 RIDGELY ROAD in MURFREESBORO, TN)
AIR MINOR (AIRS/AFS) CRITERIA AND HAZARDOUS AIR POLLUTANT INVENTORY (Inventory of air pollution sources) Conditionally Exempt Small Quantity Generators, less than 100 kg/month of hazardous waste (Resource Conservation and Recovery Act (tracking hazardous waste)) - notification TRI REPORTER (Tracking of toxic chemicals releasing facilities) Business SIC classification: ELECTRIC HOUSEWARES AND FANS; ELECTRICAL MACHINERY, EQUIPMENT, AND SUPPLIES Business NAICS classification: ELECTRIC HOUSEWARES AND HOUSEHOLD FAN MANUFACTURING. Alternative names: EMERSON ELEC. CO. WIEGAND INDL.
ASTRUM R E CORPORATION (201 SAMSONITE BLVD in MURFREESBORO, TN)
HAZARDOUS WASTE BIENNIAL REPORTER (Resource Conservation and Recovery Act (tracking hazardous waste)) (Resource Conservation and Recovery Act (tracking hazardous waste)) TRI REPORTER (Tracking of toxic chemicals releasing facilities) Business SIC and NAICS classification: METAL HOUSEHOLD FURNITURE Alternative names: SAMSONITE FURNITURE CO.
ATMOS ENERGY CORPORATION (1021 WEST LOKEY AVENUE in MURFREESBORO, TN)
(Resource Conservation and Recovery Act (tracking hazardous waste)) Organizations: STUART SCHULZ (CONTACT/OPERATOR)
Alternative names: UNITED CITIES GAS COMPANY
A & M EXPRESS (I 40 EXIT 126 HOLIDAY TN in MURFREESBORO, TN)
(Resource Conservation and Recovery Act (tracking hazardous waste))
A-1 CLEANERS (202 N. THOMPSON LN SUITE G in MURFREESBORO, TN)
AIR MINOR (AIRS/AFS) Business SIC classification: COIN-OPERATED LAUNDRIES AND DRYCLEANING
ACCURATE METAL PRODUCTS CO INC (325 E VINE STREET in MURFREESBORO, TN)
(Resource Conservation and Recovery Act (tracking hazardous waste))
AGEE OIL COMPANY, INC. (129 S. CANNON DR. in MURFREESBORO, TN)
AIR MINOR (AIRS/AFS) Business SIC classification: PETROLEUM BULK STATIONS AND TERMINALS
ALCO PLASTICS OF MURFREESBORO (627 PATTERSON STREET in MURFREESBORO, TN)
(Resource Conservation and Recovery Act (tracking hazardous waste))
ALEXANDER CHEVROLET-GEO LLC (1422 N W BROAD STREET in MURFREESBORO, TN)
Conditionally Exempt Small Quantity Generators, less than 100 kg/month of hazardous waste (Resource Conservation and Recovery Act (tracking hazardous waste)) Organizations: DAVID WARRICK (CONTACT/OPERATOR)
, DONALD W ALEXANDER (CONTACT/OWNER)
Housing units lacking complete plumbing facilities: 1.2% Housing units lacking complete kitchen facilities: 2.5%
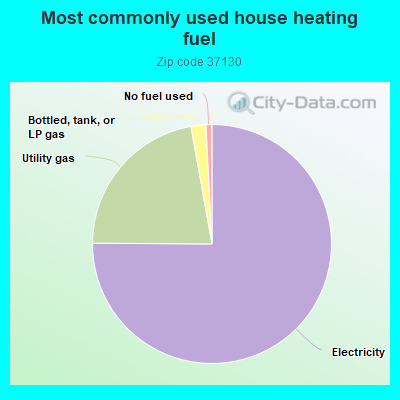
74.9%Electricity
22.0%Utility gas
2.0%Bottled, tank, or LP gas
0.8%No fuel used
Population in 1990: 35,559. Population change in the 1990s: +8,005 (+22.5%).
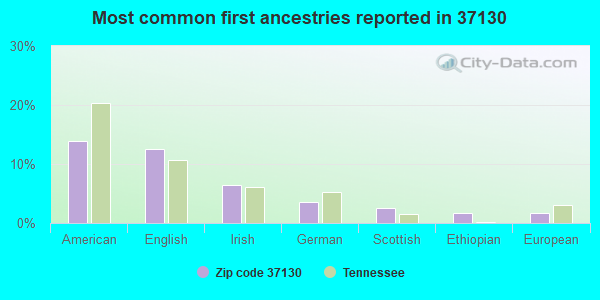
Place of birth for U.S.-born residents:
This state: 31,743
Northeast: 1,836
Midwest: 7,154
South: 10,681
West: 2,666
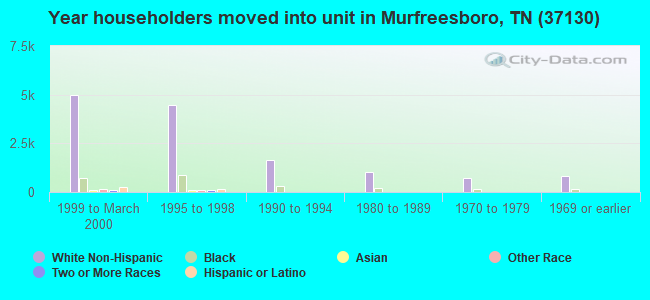
32% of the 37130 zip code residents lived in the same house 5 years ago. Out of people who lived in different houses, 44% lived in this county. Out of people who lived in different counties, 50% lived in Tennessee.
85% of the 37130 zip code residents lived in the same house 1 year ago. Out of people who lived in different houses, 54% moved from this county. Out of people who lived in different houses, 24% moved from different county within same state. Out of people who lived in different houses, 18% moved from different state.
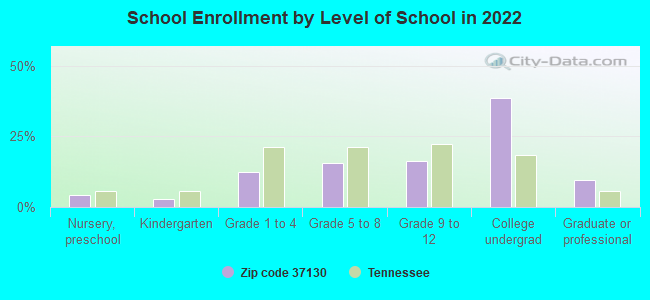
Private vs. public school enrollment:
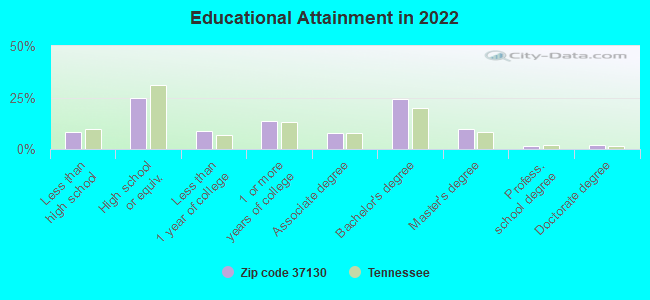
Students in private schools in grades 1 to 8 (elementary and middle school): 383
Here:
9.2%
Tennessee:
15.0%
Students in private schools in grades 9 to 12 (high school): 300
Here:
12.3%
Tennessee:
16.2%
Students in private undergraduate colleges: 535
Here:
9.2%
Tennessee:
23.5%
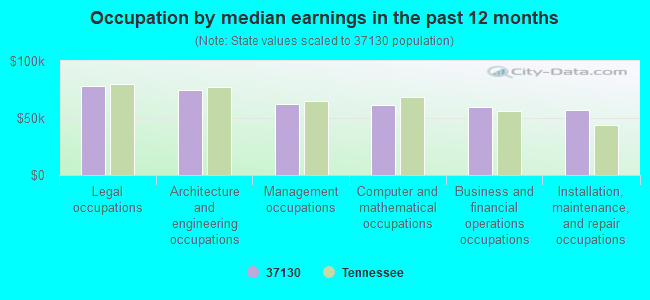
Occupation by median earnings in the past 12 months ($)
77,814Legal occupations
74,423Architecture and engineering occupations
62,084Management occupations
60,978Computer and mathematical occupations
59,341Business and financial operations occupations
56,929Installation, maintenance, and repair occupations
Companies with federal contracts located in this zip code:
MIDDLE TENNESSEE ELECTRIC MEMB (326 ST ANDREWS DR in MURFREESBORO, TN) : $5,087,631 in 20 contractsfrom 1999 to 2003
Contracts for Electric Services, Telephone and/or Communications Services (includes Telegraph, Telex, and Cablevision Services) by Department of Veterans Affairs Signed by year:2000: $798,000; 2001: $1,249,000; 2002: $592,000; 2003: $2,221,631; 2004: $0; 2005: $0; 2006: $0.
Biggest contracts:
$472,146 with Department of Veterans Affairs for Electric Services. Signed on 2003-01-15. Completion date: 2003-03-15.
$430,000, same as above.Signed on 2001-10-15. Completion date: 2002-03-15.
$350,729, same as above.Signed on 2003-10-01. Effective on 2004-07-01. Completion date: 2004-09-30.
$327,663, same as above.Signed on 2003-09-15. Completion date: 2003-09-15.
SOUTHERN HOSTS, LLC (1630 S CHURCH ST in MURFREESBORO, TN; small business) : $404,469 in 7 contractsfrom 1999 to 2000
Contracts for Lodging - Hotel/Motel by Army Signed by year:2000: $215,427; 2001: $0; 2002: $0; 2003: $0; 2004: $0; 2005: $0; 2006: $0.
Biggest contracts:
$102,306 with Army for Lodging - Hotel/Motel. Taking place in AZ. Signed on 2000-10-25. Completion date: 2000-12-31.
$102,306, same as above.Signed on 2000-06-21. Completion date: 2000-09-30.
$94,521, same as above.Signed on 1999-12-31. Completion date: 2000-03-31.
$94,521, same as above.Signed on 1999-10-26. Completion date: 1999-12-31.
ENVIRONMENTAL SOLUTIONS, INC (1317 SHERRON in MURFREESBORO, TN; small business)
$8,800 with U.S. Army Corps of Engineers - civil program financing only for Hazardous Substance Removal, Cleanup, and Disposal Services and Operational Support. Signed on 2002-06-17. Completion date: 2002-07-05.
Top industries in this zip code by the number of employees in 2005:
Health Care and Social Assistance: General Medical and Surgical Hospitals (over 1000 employees: 1 establishment)
Health Care and Social Assistance: Offices of Physical, Occupational and Speech Therapists, and Audiologists (100-249: 3, 50-99: 2, 10-19: 2, 5-9: 1, 1-4: 2)
Other Services (except Public Administration): Religious Organizations (50-99: 3, 20-49: 4, 10-19: 2, 5-9: 6, 1-4: 18)
People in group quarters in 2010:
325 people in nursing facilities/skilled-nursing facilities
135 people in college/university student housing
72 people in group homes intended for adults
32 people in residential treatment centers for juveniles (non-correctional)
13 people in residential treatment centers for adults
11 people in other noninstitutional facilities
People in group quarters in 2000:
3,099 people in college dormitories (includes college quarters off campus)
478 people in nursing homes
92 people in other types of correctional institutions
69 people in homes for the mentally retarded
51 people in local jails and other confinement facilities (including police lockups)
28 people in homes or halfway houses for drug/alcohol abuse
28 people in other noninstitutional group quarters
9 people in other group homes
Fatal accident statistics in 2014:
Fatal accident count: 5
Vehicles involved in fatal accidents: 7
Fatal accidents caused by drunken drivers: 4
Fatalities: 5
Persons involved in fatal accidents: 15
Pedestrians involved in fatal accidents: 0
Fatal accident statistics in 2013:
Fatal accident count: 4
Vehicles involved in fatal accidents: 4
Fatal accidents caused by drunken drivers: 0
Fatalities: 4
Persons involved in fatal accidents: 5
Pedestrians involved in fatal accidents: 1
Home Mortgage Disclosure Act Aggregated Statistics For Year 2009 (Based on 8 full and 6 partial tracts)
A) FHA, FSA/RHS & VA Home Purchase Loans
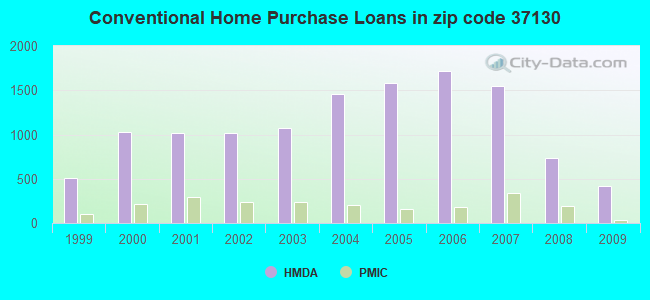
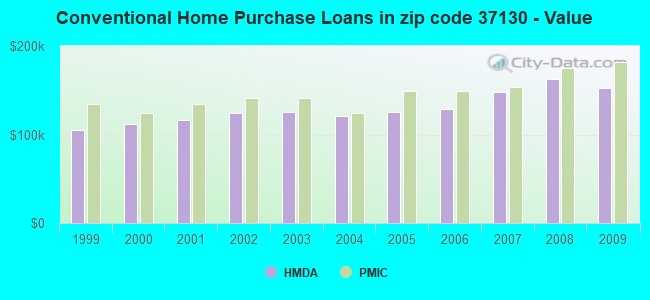
B) Conventional Home Purchase Loans
C) Refinancings
D) Home Improvement Loans
E) Loans on Dwellings For 5+ Families
F) Non-occupant Loans on < 5 Family Dwellings (A B C & D)
G) Loans On Manufactured Home Dwelling (A B C & D)
Number
Average Value
Number
Average Value
Number
Average Value
Number
Average Value
Number
Average Value
Number
Average Value
Number
Average Value
LOANS ORIGINATED
426
$145,751
418
$152,735
1,468
$173,062
93
$70,400
9
$889,577
241
$95,625
3
$111,033
APPLICATIONS APPROVED, NOT ACCEPTED
4
$106,880
18
$175,964
109
$184,396
11
$11,594
0
$0
5
$74,794
0
$0
APPLICATIONS DENIED
51
$147,536
56
$117,786
386
$173,767
64
$24,586
0
$0
50
$104,845
6
$29,477
APPLICATIONS WITHDRAWN
51
$174,297
93
$174,923
340
$167,923
12
$69,558
2
$2,723,730
33
$103,432
2
$127,845
FILES CLOSED FOR INCOMPLETENESS
9
$189,493
8
$115,445
98
$174,556
4
$80,295
0
$0
2
$133,840
0
$0
Aggregated Statistics For Year 2008 (Based on 8 full and 6 partial tracts)
A) FHA, FSA/RHS & VA Home Purchase Loans
B) Conventional Home Purchase Loans
C) Refinancings
D) Home Improvement Loans
E) Loans on Dwellings For 5+ Families
F) Non-occupant Loans on < 5 Family Dwellings (A B C & D)
G) Loans On Manufactured Home Dwelling (A B C & D)
Number
Average Value
Number
Average Value
Number
Average Value
Number
Average Value
Number
Average Value
Number
Average Value
Number
Average Value
LOANS ORIGINATED
304
$155,081
734
$163,071
875
$165,294
85
$47,257
12
$3,064,426
409
$124,233
16
$53,332
APPLICATIONS APPROVED, NOT ACCEPTED
7
$157,807
52
$200,122
101
$161,140
20
$31,223
0
$0
18
$90,812
12
$63,055
APPLICATIONS DENIED
56
$120,357
94
$137,954
466
$148,187
128
$58,290
1
$223,110
62
$106,563
32
$47,060
APPLICATIONS WITHDRAWN
34
$146,619
106
$153,902
210
$168,332
16
$92,401
0
$0
31
$105,595
0
$0
FILES CLOSED FOR INCOMPLETENESS
14
$143,502
13
$125,975
27
$170,671
3
$41,837
0
$0
6
$87,387
0
$0
Aggregated Statistics For Year 2007 (Based on 8 full and 6 partial tracts)
A) FHA, FSA/RHS & VA Home Purchase Loans
B) Conventional Home Purchase Loans
C) Refinancings
D) Home Improvement Loans
E) Loans on Dwellings For 5+ Families
F) Non-occupant Loans on < 5 Family Dwellings (A B C & D)
G) Loans On Manufactured Home Dwelling (A B C & D)
Number
Average Value
Number
Average Value
Number
Average Value
Number
Average Value
Number
Average Value
Number
Average Value
Number
Average Value
LOANS ORIGINATED
171
$141,962
1,549
$148,575
896
$136,545
120
$48,775
11
$22,640,374
533
$112,606
10
$79,725
APPLICATIONS APPROVED, NOT ACCEPTED
6
$142,858
174
$156,729
135
$117,448
32
$47,452
0
$0
50
$122,840
4
$97,910
APPLICATIONS DENIED
31
$149,796
250
$125,133
616
$149,556
150
$58,773
2
$228,725
136
$115,448
17
$60,546
APPLICATIONS WITHDRAWN
16
$163,209
192
$133,240
261
$143,089
24
$67,024
0
$0
45
$78,917
0
$0
FILES CLOSED FOR INCOMPLETENESS
10
$117,169
46
$149,335
73
$188,662
0
$0
2
$6,142,620
20
$197,628
0
$0
Aggregated Statistics For Year 2006 (Based on 8 full and 6 partial tracts)
A) FHA, FSA/RHS & VA Home Purchase Loans
B) Conventional Home Purchase Loans
C) Refinancings
D) Home Improvement Loans
E) Loans on Dwellings For 5+ Families
F) Non-occupant Loans on < 5 Family Dwellings (A B C & D)
G) Loans On Manufactured Home Dwelling (A B C & D)
Number
Average Value
Number
Average Value
Number
Average Value
Number
Average Value
Number
Average Value
Number
Average Value
Number
Average Value
LOANS ORIGINATED
224
$845,979
1,717
$129,084
805
$121,408
140
$45,007
13
$1,466,336
605
$97,665
6
$44,983
APPLICATIONS APPROVED, NOT ACCEPTED
3
$113,197
193
$111,471
180
$131,395
26
$34,860
0
$0
52
$96,520
21
$41,407
APPLICATIONS DENIED
12
$111,273
304
$100,200
544
$122,662
169
$35,668
0
$0
152
$71,669
41
$42,047
APPLICATIONS WITHDRAWN
24
$130,134
233
$115,837
371
$142,504
29
$122,744
0
$0
82
$91,461
0
$0
FILES CLOSED FOR INCOMPLETENESS
0
$0
33
$165,393
74
$109,453
2
$145,585
0
$0
8
$82,575
0
$0
Aggregated Statistics For Year 2005 (Based on 8 full and 6 partial tracts)
A) FHA, FSA/RHS & VA Home Purchase Loans
B) Conventional Home Purchase Loans
C) Refinancings
D) Home Improvement Loans
E) Loans on Dwellings For 5+ Families
F) Non-occupant Loans on < 5 Family Dwellings (A B C & D)
G) Loans On Manufactured Home Dwelling (A B C & D)
Number
Average Value
Number
Average Value
Number
Average Value
Number
Average Value
Number
Average Value
Number
Average Value
Number
Average Value
LOANS ORIGINATED
195
$120,551
1,578
$125,562
1,046
$119,464
104
$66,805
6
$4,283,958
519
$93,342
16
$57,656
APPLICATIONS APPROVED, NOT ACCEPTED
6
$89,213
175
$100,776
197
$84,879
26
$66,815
0
$0
38
$82,517
17
$52,084
APPLICATIONS DENIED
26
$100,388
237
$85,044
672
$108,902
138
$37,068
1
$50,000
58
$87,275
43
$61,501
APPLICATIONS WITHDRAWN
28
$138,362
199
$110,265
584
$129,720
39
$138,645
0
$0
57
$106,729
7
$70,866
FILES CLOSED FOR INCOMPLETENESS
0
$0
71
$138,132
96
$122,866
8
$45,546
0
$0
2
$47,085
0
$0
Aggregated Statistics For Year 2004 (Based on 8 full and 6 partial tracts)
A) FHA, FSA/RHS & VA Home Purchase Loans
B) Conventional Home Purchase Loans
C) Refinancings
D) Home Improvement Loans
E) Loans on Dwellings For 5+ Families
F) Non-occupant Loans on < 5 Family Dwellings (A B C & D)
G) Loans On Manufactured Home Dwelling (A B C & D)
Number
Average Value
Number
Average Value
Number
Average Value
Number
Average Value
Number
Average Value
Number
Average Value
Number
Average Value
LOANS ORIGINATED
312
$127,138
1,452
$121,050
1,310
$114,399
60
$37,501
14
$2,397,373
536
$79,964
20
$71,048
APPLICATIONS APPROVED, NOT ACCEPTED
11
$98,364
126
$100,650
215
$120,456
28
$33,754
1
$616,970
45
$82,508
40
$39,857
APPLICATIONS DENIED
36
$112,848
232
$94,596
752
$113,248
124
$30,240
0
$0
67
$70,629
50
$37,035
APPLICATIONS WITHDRAWN
32
$115,930
201
$110,053
554
$115,142
14
$28,525
1
$129,080
44
$99,098
2
$97,820
FILES CLOSED FOR INCOMPLETENESS
5
$91,186
86
$97,721
88
$146,551
3
$111,910
0
$0
9
$69,179
0
$0
Aggregated Statistics For Year 2003 (Based on 8 full and 6 partial tracts)
A) FHA, FSA/RHS & VA Home Purchase Loans
B) Conventional Home Purchase Loans
C) Refinancings
D) Home Improvement Loans
E) Loans on Dwellings For 5+ Families
F) Non-occupant Loans on < 5 Family Dwellings (A B C & D)
Number
Average Value
Number
Average Value
Number
Average Value
Number
Average Value
Number
Average Value
Number
Average Value
LOANS ORIGINATED
427
$116,189
1,076
$124,886
2,739
$123,609
85
$19,147
4
$933,620
501
$80,309
APPLICATIONS APPROVED, NOT ACCEPTED
4
$96,960
84
$120,741
306
$104,603
24
$14,275
0
$0
38
$65,558
APPLICATIONS DENIED
28
$93,314
168
$101,872
756
$107,004
75
$20,140
0
$0
56
$81,654
APPLICATIONS WITHDRAWN
44
$118,896
137
$124,229
491
$116,044
3
$69,357
2
$1,956,400
36
$103,191
FILES CLOSED FOR INCOMPLETENESS
11
$115,530
64
$119,815
96
$134,078
4
$49,805
0
$0
11
$65,775
Aggregated Statistics For Year 2002 (Based on 8 full and 6 partial tracts)
A) FHA, FSA/RHS & VA Home Purchase Loans
B) Conventional Home Purchase Loans
C) Refinancings
D) Home Improvement Loans
E) Loans on Dwellings For 5+ Families
F) Non-occupant Loans on < 5 Family Dwellings (A B C & D)
Number
Average Value
Number
Average Value
Number
Average Value
Number
Average Value
Number
Average Value
Number
Average Value
LOANS ORIGINATED
477
$110,929
1,019
$124,156
1,709
$116,315
82
$32,364
11
$2,999,391
407
$81,783
APPLICATIONS APPROVED, NOT ACCEPTED
12
$125,507
85
$103,346
237
$99,659
15
$29,487
0
$0
23
$92,593
APPLICATIONS DENIED
77
$100,858
205
$58,650
513
$90,040
48
$18,905
0
$0
52
$67,546
APPLICATIONS WITHDRAWN
39
$110,656
106
$114,368
308
$113,177
6
$41,885
0
$0
51
$96,911
FILES CLOSED FOR INCOMPLETENESS
7
$145,491
65
$110,331
82
$104,937
2
$12,450
0
$0
6
$56,553
Aggregated Statistics For Year 2001 (Based on 8 full and 6 partial tracts)
A) FHA, FSA/RHS & VA Home Purchase Loans
B) Conventional Home Purchase Loans
C) Refinancings
D) Home Improvement Loans
E) Loans on Dwellings For 5+ Families
F) Non-occupant Loans on < 5 Family Dwellings (A B C & D)
Number
Average Value
Number
Average Value
Number
Average Value
Number
Average Value
Number
Average Value
Number
Average Value
LOANS ORIGINATED
608
$107,075
1,012
$115,845
1,525
$114,623
113
$21,521
25
$1,060,528
335
$84,588
APPLICATIONS APPROVED, NOT ACCEPTED
5
$121,594
110
$61,382
155
$81,634
29
$28,339
2
$248,465
16
$77,076
APPLICATIONS DENIED
54
$97,853
337
$60,664
528
$78,571
104
$14,387
0
$0
39
$89,913
APPLICATIONS WITHDRAWN
61
$107,160
106
$134,385
315
$97,927
13
$28,589
0
$0
27
$83,190
FILES CLOSED FOR INCOMPLETENESS
6
$95,825
31
$81,200
69
$102,582
0
$0
0
$0
6
$58,515
Aggregated Statistics For Year 2000 (Based on 8 full and 6 partial tracts)
A) FHA, FSA/RHS & VA Home Purchase Loans
B) Conventional Home Purchase Loans
C) Refinancings
D) Home Improvement Loans
E) Loans on Dwellings For 5+ Families
F) Non-occupant Loans on < 5 Family Dwellings (A B C & D)
Number
Average Value
Number
Average Value
Number
Average Value
Number
Average Value
Number
Average Value
Number
Average Value
LOANS ORIGINATED
671
$101,035
1,028
$111,607
554
$95,610
109
$18,169
12
$333,345
263
$96,324
APPLICATIONS APPROVED, NOT ACCEPTED
21
$56,056
104
$78,535
143
$81,238
37
$16,118
0
$0
12
$69,276
APPLICATIONS DENIED
65
$79,234
427
$65,936
497
$71,196
116
$21,337
0
$0
44
$68,234
APPLICATIONS WITHDRAWN
61
$95,832
155
$103,582
230
$75,266
24
$26,483
1
$121,700
26
$69,013
FILES CLOSED FOR INCOMPLETENESS
4
$78,075
24
$78,477
66
$74,189
2
$20,115
0
$0
3
$98,517
Aggregated Statistics For Year 1999 (Based on 5 full and 3 partial tracts)
A) FHA, FSA/RHS & VA Home Purchase Loans
B) Conventional Home Purchase Loans
C) Refinancings
D) Home Improvement Loans
E) Loans on Dwellings For 5+ Families
F) Non-occupant Loans on < 5 Family Dwellings (A B C & D)
2002 - 2018 National Fire Incident Reporting System (NFIRS) incidents
According to the data from the years 2002 - 2018 the average number of fire incidents per year is 233. The highest number of reported fires - 299 took place in 2006, and the least - 172 in 2018. The data has a decreasing trend.
When looking into fire subcategories, the most reports belonged to: Structure Fires (43.2%), and Outside Fires (36.0%).
Fire incident types reported to NFIRS in Zip Code 37130


 Nearest zip codes: 37132, 37085, 37127, 37129, 37118, 37149.


 According to the data from the years 2002 - 2018 the average number of fire incidents per year is 233. The highest number of reported fires - 299 took place in 2006, and the least - 172 in 2018. The data has a decreasing trend.
 When looking into fire subcategories, the most reports belonged to: Structure Fires (43.2%), and Outside Fires (36.0%).