Estimated zip code population in 2022: 6,579 Zip code population in 2010: 5,588 Zip code population in 2000: 5,215
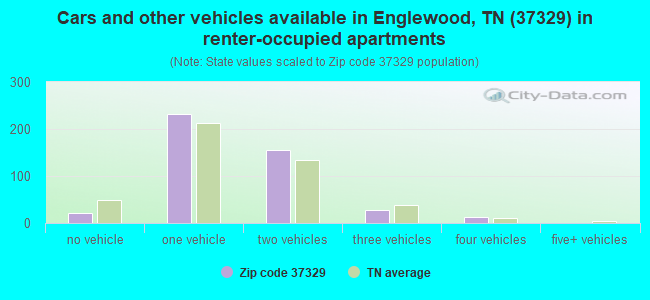
Houses and condos: 2,780 Renter-occupied apartments: 447
% of renters here:
17%
State:
33%
March 2022 cost of living index in zip code 37329: 78.8 (low, U.S. average is 100)
Land area: 57.9 sq. mi. Water area: 0.0 sq. mi.
Population density: 114 people per square mile
(very low).
OSM Map
General Map
Google Map
MSN Map
OSM Map
General Map
Google Map
MSN Map
OSM Map
General Map
Google Map
MSN Map
OSM Map
General Map
Google Map
MSN Map
Please wait while loading the map...
Real estate property taxes paid for housing units in 2022:
This zip code:
0.3% ($573)
Tennessee:
0.5% ($1,376)
Median real estate property taxes paid for housing units with mortgages in 2022: $576 (0.3%) Median real estate property taxes paid for housing units with no mortgage in 2022: $571 (0.4%)
Business Search- 14 Million verified businesses
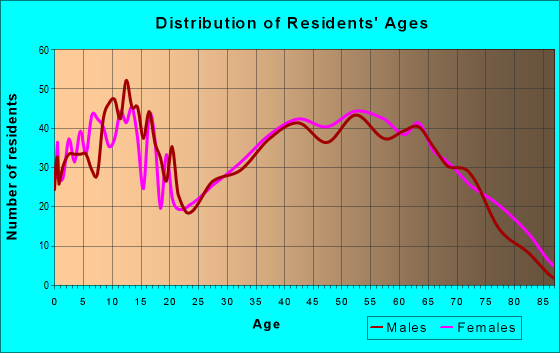
Males: 3,187
(48.5%)
Females: 3,391
(51.5%)
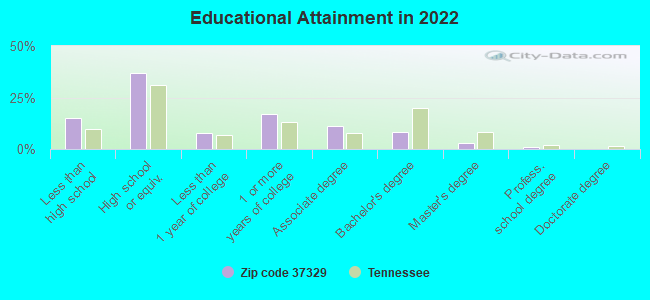
For population 25 years and over in 37329:
High school or higher: 83.9%
Bachelor's degree or higher: 12.2%
Graduate or professional degree: 4.2%
Unemployed: 4.4%
Mean travel time to work (commute): 27.3 minutes
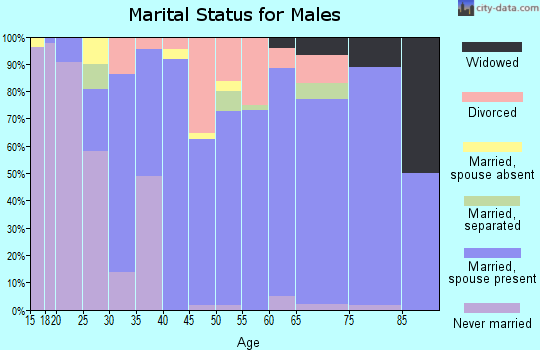
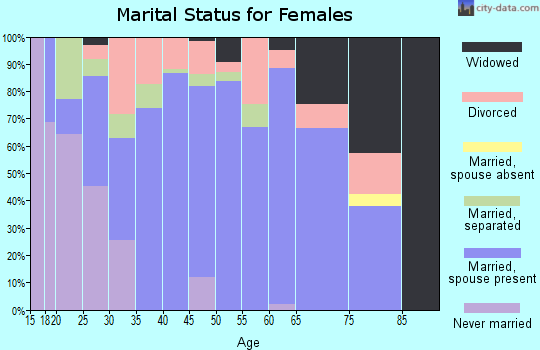
For population 15 years and over in 37329:
Never married: 18.3%
Now married: 53.6%
Separated: 4.0%
Widowed: 11.2%
Divorced: 12.9%
Zip code 37329 compared to state average:
Median house value below state average.
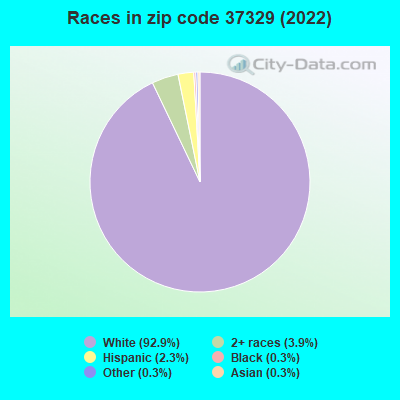
Black race population percentage significantly below state average.
Hispanic race population percentage below state average.
Foreign-born population percentage significantly below state average.
Renting percentage below state average.
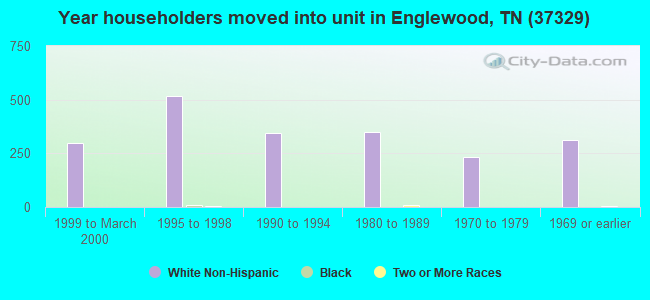
Length of stay since moving in significantly above state average.
Number of college students below state average.
Percentage of population with a bachelor's degree or higher significantly below state average.
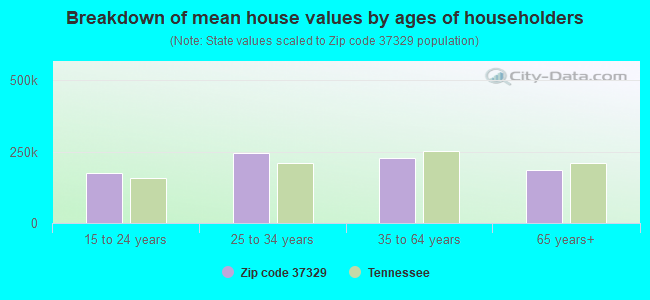
Estimated median house/condo value in 2022: $188,721
37329:
$188,721
Tennessee:
$284,800
According to our research of Tennessee and other state lists, there were 18 registered sex offenders living in 37329 zip code as of April 27, 2024. The ratio of all residents to sex offenders in zip code 37329 is 336 to 1. The ratio of registered sex offenders to all residents in this zip code is near the state average.
Median resident age:
This zip code:
40.2 years
Tennessee median age:
39.2 years
Average household size:
This zip code:
2.5 people
Tennessee:
2.4 people
Averages for the 2020 tax year for zip code 37329, filed in 2021:
Average Adjusted Gross Income (AGI) in 2020: $53,112 (Individual Income Tax Returns)
Here:
$53,112
State:
$69,014
Salary/wage: $45,325 (reported on 80.7% of returns)
Here:
$45,325
State:
$55,872
(% of AGI for various income ranges: 1012.9% for AGIs below $25k, 3366.7% for AGIs $25k-50k, 5884.8% for AGIs $50k-75k, 8360.0% for AGIs $75k-100k, 12667.4% for AGIs $100k-200k)
Taxable interest for individuals: $903 (reported on 25.8% of returns)
This zip code:
$903
Tennessee:
$1,945
(% of AGI for various income ranges: 17.1% for AGIs below $25k, 16.7% for AGIs $25k-50k, 25.5% for AGIs $50k-75k, 61.1% for AGIs $75k-100k, 71.6% for AGIs $100k-200k)
Ordinary dividends: $2,393 (reported on 11.1% of returns)
Here:
$2,393
State:
$8,105
(% of AGI for various income ranges: 12.2% for AGIs below $25k, 15.1% for AGIs $25k-50k, 51.0% for AGIs $50k-75k, 68.4% for AGIs $75k-100k, 109.5% for AGIs $100k-200k)
Net capital gain/loss in AGI: +$7,707 (reported on 11.1% of returns)
Here:
+$7,707
State:
+$33,664
(% of AGI for various income ranges: 5.6% for AGIs below $25k, 16.7% for AGIs $25k-50k, 69.3% for AGIs $50k-75k, 128.9% for AGIs $75k-100k, 795.8% for AGIs $100k-200k)
Profit/loss from business: +$14,674 (reported on 14.3% of returns)
Here:
+$14,674
State:
+$18,991
(% of AGI for various income ranges: 128.8% for AGIs below $25k, 135.3% for AGIs $25k-50k, 167.2% for AGIs $50k-75k, 275.3% for AGIs $75k-100k, 1348.4% for AGIs $100k-200k)
Taxable individual retirement arrangement distribution: $18,054 (reported on 9.8% of returns)
37329:
$18,054
Tennessee:
$20,036
(% of AGI for various income ranges: 62.5% for AGIs below $25k, 111.0% for AGIs $25k-50k, 215.5% for AGIs $50k-75k, 346.3% for AGIs $75k-100k, 1083.7% for AGIs $100k-200k)
Total itemized deductions: $30,783 (reported on 2.5% of returns)
Here:
$30,783
State:
$40,136
(% of AGI for various income ranges: 68.2% for AGIs below $25k, 727.9% for AGIs $100k-200k)
Charity contributions: $15,400 (reported on 1.6% of returns)
Here:
$15,400
State:
$19,852
(% of AGI for various income ranges: 324.2% for AGIs $100k-200k)
Taxes paid: $4,640 (reported on 2.0% of returns)
37329:
$4,640
State:
$6,038
(% of AGI for various income ranges: 122.1% for AGIs $100k-200k)
Earned income credit: $2,135 (reported on 20.1% of returns)
Here:
$2,135
State:
$2,391
(% of AGI for various income ranges: 96.5% for AGIs below $25k, 76.5% for AGIs $25k-50k)
Percentage of individuals using paid preparers for their 2020 taxes: 90.6%
Here:
91%
State:
93%
(% for various income ranges: 89.8% for AGIs below $25k, 88.9% for AGIs $25k-50k, 91.9% for AGIs $50k-75k, 92.0% for AGIs $75k-100k, 96.2% for AGIs $100k-200k, 80.0% for AGIs over 200k)
Averages for the 2012 tax year for zip code 37329, filed in 2013:
Average Adjusted Gross Income (AGI) in 2012: $44,062 (Individual Income Tax Returns)
Here:
$44,062
State:
$53,767
Salary/wage: $39,948 (reported on 82.6% of returns)
Here:
$39,948
State:
$45,421
(% of AGI for various income ranges: 71.8% for AGIs below $25k, 78.7% for AGIs $25k-50k, 81.3% for AGIs $50k-75k, 80.4% for AGIs $75k-100k, 79.5% for AGIs $100k-200k, 41.9% for AGIs over 200k)
Taxable interest for individuals: $1,297 (reported on 27.1% of returns)
This zip code:
$1,297
Tennessee:
$1,732
(% of AGI for various income ranges: 1.8% for AGIs below $25k, 1.2% for AGIs $25k-50k, 0.5% for AGIs $50k-75k, 0.4% for AGIs $75k-100k, 0.5% for AGIs $100k-200k, 0.5% for AGIs over 200k)
Ordinary dividends: $1,777 (reported on 10.1% of returns)
Here:
$1,777
State:
$6,739
(% of AGI for various income ranges: 0.6% for AGIs below $25k, 0.5% for AGIs $25k-50k, 0.3% for AGIs $50k-75k, 0.2% for AGIs $75k-100k, 0.6% for AGIs $100k-200k)
Net capital gain/loss in AGI: +$5,006 (reported on 8.3% of returns)
Here:
+$5,006
State:
+$19,082
(% of AGI for various income ranges: 0.2% for AGIs $25k-50k, 0.2% for AGIs $75k-100k, 5.0% for AGIs $100k-200k)
Profit/loss from business: +$10,291 (reported on 15.6% of returns)
Here:
+$10,291
State:
+$15,240
(% of AGI for various income ranges: 9.9% for AGIs below $25k, 2.4% for AGIs $25k-50k, 1.2% for AGIs $50k-75k, 1.7% for AGIs $75k-100k, 7.9% for AGIs $100k-200k)
Taxable individual retirement arrangement distribution: $12,570 (reported on 9.2% of returns)
37329:
$12,570
Tennessee:
$15,505
(% of AGI for various income ranges: 3.2% for AGIs below $25k, 2.8% for AGIs $25k-50k, 2.3% for AGIs $50k-75k, 2.8% for AGIs $75k-100k, 3.8% for AGIs $100k-200k)
Total itemized deductions: $20,077 (23% of AGI, reported on 13.8% of returns)
Here:
$20,077
State:
$21,976
Here:
22.9% of AGI
State:
17.8% of AGI
(% of AGI for various income ranges: 4.4% for AGIs below $25k, 5.2% for AGIs $25k-50k, 5.0% for AGIs $50k-75k, 7.9% for AGIs $75k-100k, 12.6% for AGIs $100k-200k)
Charity contributions: $6,083 (reported on 10.6% of returns)
Here:
$6,083
State:
$6,709
(% of AGI for various income ranges: 1.1% for AGIs $25k-50k, 1.0% for AGIs $50k-75k, 1.8% for AGIs $75k-100k, 3.9% for AGIs $100k-200k)
Taxes paid: $2,932 (reported on 14.2% of returns)
37329:
$2,932
State:
$4,829
(% of AGI for various income ranges: 0.4% for AGIs below $25k, 0.6% for AGIs $25k-50k, 0.8% for AGIs $50k-75k, 1.4% for AGIs $75k-100k, 2.1% for AGIs $100k-200k)
Earned income credit: $2,265 (reported on 23.9% of returns)
Here:
$2,265
State:
$2,404
(% of AGI for various income ranges: 8.0% for AGIs below $25k, 1.3% for AGIs $25k-50k)
Percentage of individuals using paid preparers for their 2012 taxes: 63.8%
Here:
64%
State:
52%
(% for various income ranges: 60.9% for AGIs below $25k, 65.0% for AGIs $25k-50k, 65.6% for AGIs $50k-75k, 66.7% for AGIs $75k-100k, 78.6% for AGIs $100k-200k)
Averages for the 2004 tax year for zip code 37329, filed in 2005:
Average Adjusted Gross Income (AGI) in 2004: $36,494 (Individual Income Tax Returns)
Here:
$36,494
State:
$44,088
Salary/wage: $35,493 (reported on 84.2% of returns)
Here:
$35,493
State:
$38,825
(% of AGI for various income ranges: 103.7% for AGIs below $10k, 73.5% for AGIs $10k-25k, 84.0% for AGIs $25k-50k, 85.3% for AGIs $50k-75k, 86.3% for AGIs $75k-100k, 71.3% for AGIs over 100k)
Taxable interest for individuals: $1,452 (reported on 36.1% of returns)
This zip code:
$1,452
Tennessee:
$1,802
(% of AGI for various income ranges: 4.1% for AGIs below $10k, 2.5% for AGIs $10k-25k, 1.4% for AGIs $25k-50k, 1.4% for AGIs $50k-75k, 0.6% for AGIs $75k-100k, 1.1% for AGIs over 100k)
Taxable dividends: $953 (reported on 10.9% of returns)
Here:
$953
State:
$3,727
(% of AGI for various income ranges: 1.8% for AGIs below $10k, 0.4% for AGIs $10k-25k, 0.1% for AGIs $25k-50k, 0.2% for AGIs $50k-75k, 0.2% for AGIs $75k-100k, 0.7% for AGIs over 100k)
Net capital gain/loss: +$5,188 (reported on 9.7% of returns)
Here:
+$5,188
State:
+$15,776
(% of AGI for various income ranges: 2.1% for AGIs below $10k, 0.3% for AGIs $10k-25k, 0.6% for AGIs $25k-50k, 1.2% for AGIs $50k-75k, 1.2% for AGIs $75k-100k, 3.9% for AGIs over 100k)
Profit/loss from business: +$7,838 (reported on 17.8% of returns)
Here:
+$7,838
State:
+$12,882
(% of AGI for various income ranges: 5.4% for AGIs below $10k, 7.7% for AGIs $10k-25k, 4.0% for AGIs $25k-50k, 2.7% for AGIs $50k-75k, 1.8% for AGIs $75k-100k, 4.4% for AGIs over 100k)
IRA payment deduction: $2,594 (reported on 1.5% of returns)
37329:
$2,594
Tennessee:
$2,934
Total itemized deductions: $15,648 (23% of AGI, reported on 14.7% of returns)
Here:
$15,648
State:
$18,035
Here:
22.7% of AGI
State:
19.9% of AGI
(% of AGI for various income ranges: 4.8% for AGIs $10k-25k, 5.2% for AGIs $25k-50k, 7.6% for AGIs $50k-75k, 6.1% for AGIs $75k-100k, 8.1% for AGIs over 100k)
Charity contributions deductions: $4,787 (7% of AGI, reported on 12.5% of returns)
Here:
$4,787
State:
$5,167
Here:
6.5% of AGI
State:
5.3% of AGI
(% of AGI for various income ranges: 0.7% for AGIs $10k-25k, 1.0% for AGIs $25k-50k, 1.6% for AGIs $50k-75k, 1.8% for AGIs $75k-100k, 3.6% for AGIs over 100k)
Total tax: $4,553 (reported on 74.3% of returns)
37329:
$4,553
State:
$7,482
(% of AGI for various income ranges: 5.9% for AGIs below $10k, 4.2% for AGIs $10k-25k, 6.4% for AGIs $25k-50k, 8.3% for AGIs $50k-75k, 11.0% for AGIs $75k-100k, 18.6% for AGIs over 100k)
Earned income credit: $1,798 (reported on 20.3% of returns)
Here:
$1,798
State:
$1,826
Percentage of individuals using paid preparers for their 2004 taxes: 67.8%
Here:
68%
State:
60%
(% for various income ranges: 60.5% for AGIs below $10k, 71.6% for AGIs $10k-25k, 69.3% for AGIs $25k-50k, 70.6% for AGIs $50k-75k, 62.8% for AGIs $75k-100k, 67.1% for AGIs over 100k)
Household received Food Stamps/SNAP in the past 12 months: 399 Household did not receive Food Stamps/SNAP in the past 12 months: 2,236
Women who had a birth in the past 12 months: 100 (102 now married, 0 unmarried) Women who did not have a birth in the past 12 months: 1,417 (806 now married, 611 unmarried)
Housing units in zip code 37329 with a mortgage: 1,139 (80 second mortgage, 5 home equity loan, 69 both second mortgage and home equity loan) Houses without a mortgage: 12
Median monthly owner costs for units with a mortgage: $1,013 Median monthly owner costs for units without a mortgage: $330
Residents with income below the poverty level in 2022:
This zip code:
21.4%
Whole state:
13.3%
Residents with income below 50% of the poverty level in 2022:
This zip code:
12.0%
Whole state:
7.1%
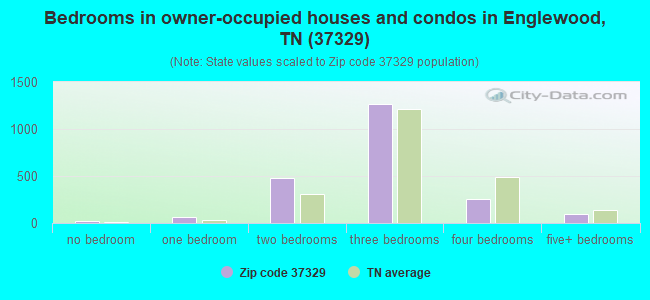
Median number of rooms in houses and condos:
Here:
5.9
State:
6.5
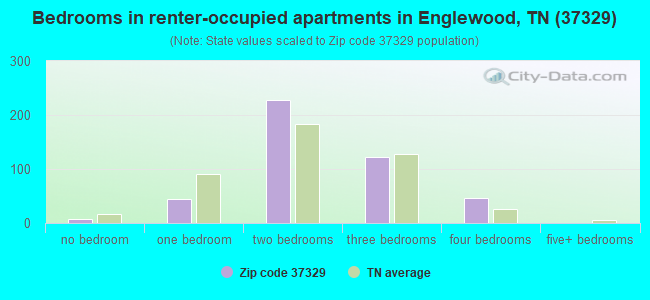
Median number of rooms in apartments:
Here:
4.2
State:
4.4
Notable locations in this zip code not listed on our city pages
Notable locations in zip code 37329: McMinn County District 3 Englewood Rural Fire Department (A), Englewood Library (B). Display/hide their locations on the map
Churches in zip code 37329 include: Zion Hill Baptist Church (A), Liberty Hill church of Christ (B), Wesley Chapel (C), Wildwood Church (D), First Baptist Church (E), Englewood Methodist Church (F), Englewood Christian Church (G), Mars Hill Church (H), Ebenezer Church (I). Display/hide their locations on the map
Cemeteries: Mount Arnon Cemetery (1), Prospect Cemetery (2), Mars Hill Cemetery (3), Zion Hill Baptist Church Cemetery (4), Land Cemetery (5), Sunrise Cemetery (6), Reynolds Cemetery (7). Display/hide their locations on the map
Streams, rivers, and creeks: Little Chestuee Creek (A), Gay Branch (B), Prospect Branch (C), Shoal Creek (D), Thompson Branch (E), Yoeder Branch (F), Jess Moore Branch (G), Big Branch (H), Elliot Branch (I). Display/hide their locations on the map
Size of family households: 654 2-persons, 579 3-persons, 584 4-persons, 53 5-persons, 7 6-persons, 77 7-or-more-persons
Size of nonfamily households: 665 1-person, 14 2-persons
990 married couples with children.
395 single-parent households (173 men, 222 women).
96.7% of residents of 37329 zip code speak English at home.
2.0% of residents speak Spanish at home (84% very well, 16% well).
0.9% of residents speak other Indo-European language at home (46% very well, 54% well).
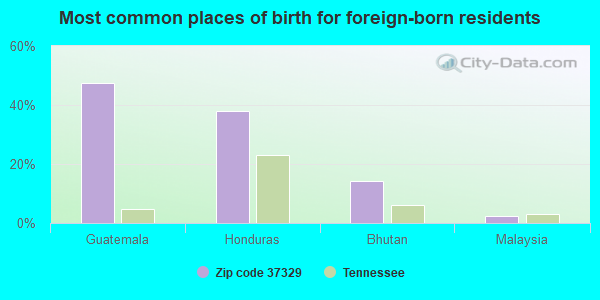
Foreign born population: 42 (0.6%) (65.5% of them are naturalized citizens)
This zip code:
0.6%
Whole state:
5.6%
48%Guatemala
38%Honduras
14%Bhutan
2%Malaysia
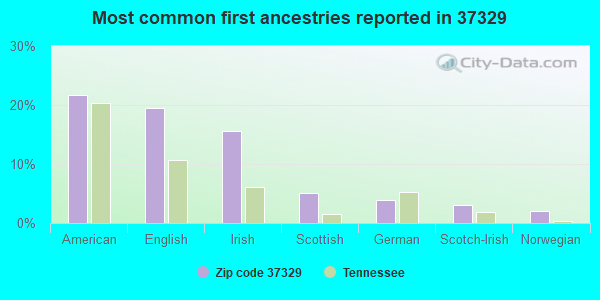
22%American
19%English
16%Irish
5%Scottish
4%German
3%Scotch-Irish
2%Norwegian
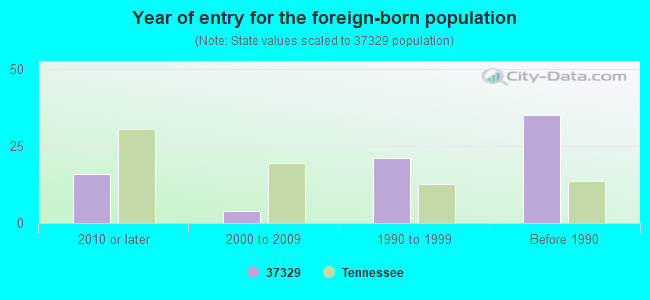
Year of entry for the foreign-born population
162010 or later
42000 to 2009
211990 to 1999
35Before 1990
Facilities with environmental interests located in this zip code:
CENTRAL HIGH SCHOOL (145 CO 461 RD in ENGLEWOOD, TN)
(National Center for Education Statistics) - STATE ID-0015 Organizations: MCMINN COUNTY SCHOOL DISTRICT (SCHOOL DISTRICT)
ALLIED HOSIERY MILLS INC (E MAIN STREET in ENGLEWOOD, TN)
(Resource Conservation and Recovery Act (tracking hazardous waste)) Business NAICS classification: OTHER HOSIERY AND SOCK MILLS.
Housing units lacking complete plumbing facilities: 1.1% Housing units lacking complete kitchen facilities: 1.2%
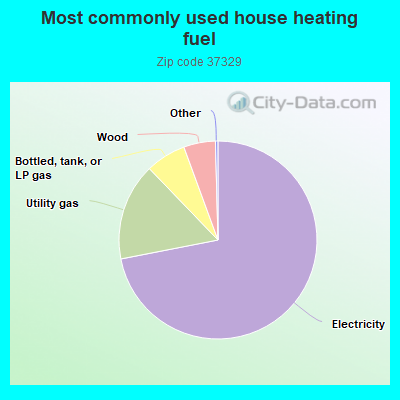
72.0%Electricity
15.9%Utility gas
6.6%Bottled, tank, or LP gas
5.2%Wood
Population in 1990: 3,419. Population change in the 1990s: +1,796 (+52.5%).
Place of birth for U.S.-born residents:
This state: 4,530
Northeast: 235
Midwest: 725
South: 909
West: 38
67% of the 37329 zip code residents lived in the same house 5 years ago. Out of people who lived in different houses, 53% lived in this county. Out of people who lived in different counties, 50% lived in Tennessee.
92% of the 37329 zip code residents lived in the same house 1 year ago. Out of people who lived in different houses, 38% moved from this county. Out of people who lived in different houses, 32% moved from different county within same state. Out of people who lived in different houses, 31% moved from different state. Out of people who lived in different houses, 2% moved from abroad.
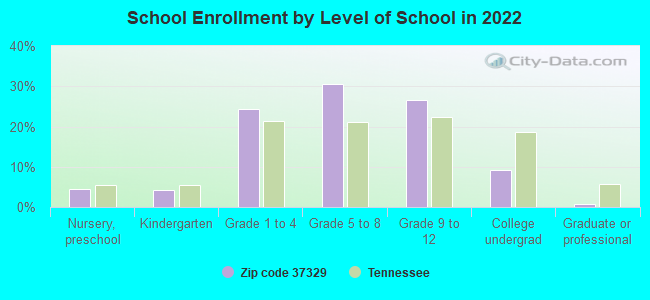
Private vs. public school enrollment:
Students in private schools in grades 1 to 8 (elementary and middle school): 229
Here:
26.1%
Tennessee:
15.0%
Students in private schools in grades 9 to 12 (high school): 98
Here:
23.6%
Tennessee:
16.2%
Students in private undergraduate colleges: 20
Here:
14.5%
Tennessee:
23.5%
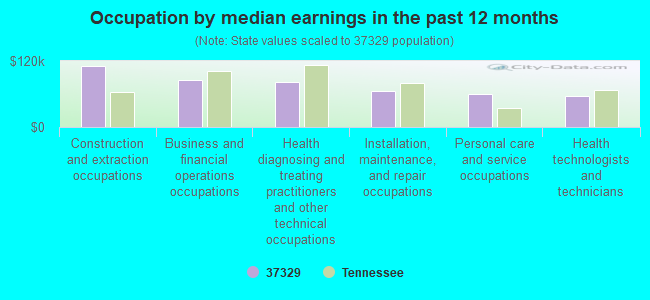
Occupation by median earnings in the past 12 months ($)
111,322Construction and extraction occupations
85,006Business and financial operations occupations
82,059Health diagnosing and treating practitioners and other technical occupations
65,045Installation, maintenance, and repair occupations
59,553Personal care and service occupations
57,053Health technologists and technicians
Top industries in this zip code by the number of employees in 2005:
Accommodation and Food Services: Full-Service Restaurants (20-49 employees: 1 establishment)
Construction: Industrial Building Construction (20-49: 1)
Other Services (except Public Administration): Religious Organizations (5-9: 2, 1-4: 3)
Educational Services: Elementary and Secondary Schools (5-9: 1)
Fatal accident statistics in 2014:
Fatal accident count: 1
Vehicles involved in fatal accidents: 1
Fatal accidents caused by drunken drivers: 1
Fatalities: 1
Persons involved in fatal accidents: 1
Pedestrians involved in fatal accidents: 0
Fatal accident statistics in 2011:
Fatal accident count: 2
Vehicles involved in fatal accidents: 2
Fatal accidents caused by drunken drivers: 0
Fatalities: 2
Persons involved in fatal accidents: 2
Pedestrians involved in fatal accidents: 0
2002 - 2018 National Fire Incident Reporting System (NFIRS) incidents
According to the data from the years 2002 - 2018 the average number of fire incidents per year is 45. The highest number of reported fires - 77 took place in 2007, and the least - 14 in 2002. The data has a growing trend.
When looking into fire subcategories, the most reports belonged to: Structure Fires (47.0%), and Outside Fires (37.1%).
Fire incident types reported to NFIRS in Zip Code 37329


 Nearest zip codes: 37331, 37354, 37303, 37325, 37874, 37369.


 According to the data from the years 2002 - 2018 the average number of fire incidents per year is 45. The highest number of reported fires - 77 took place in 2007, and the least - 14 in 2002. The data has a growing trend.
 When looking into fire subcategories, the most reports belonged to: Structure Fires (47.0%), and Outside Fires (37.1%).