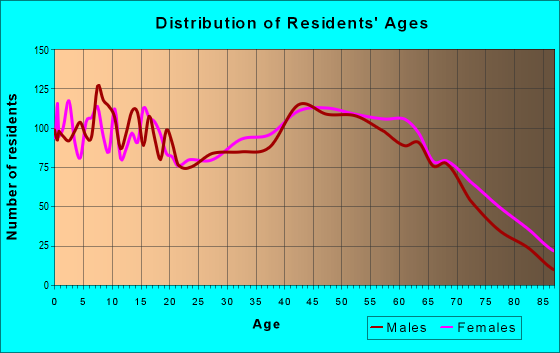
Estimated zip code population in 2022: 16,255 Zip code population in 2010: 14,979 Zip code population in 2000: 13,141
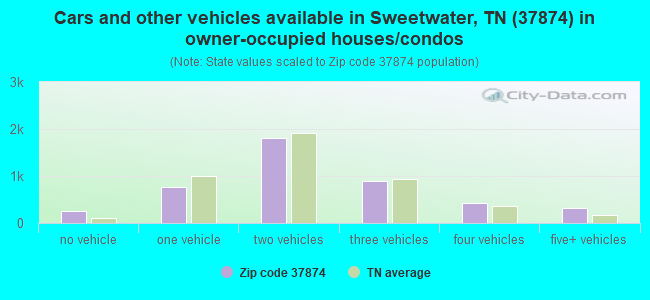
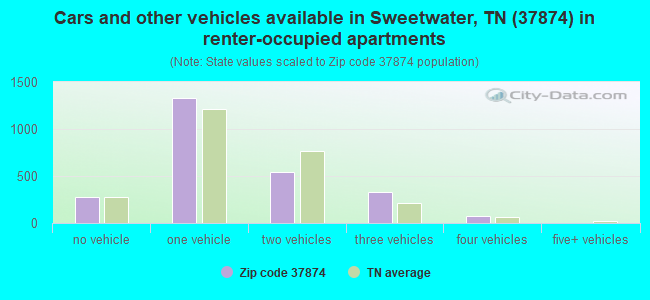
Houses and condos: 7,507 Renter-occupied apartments: 2,548
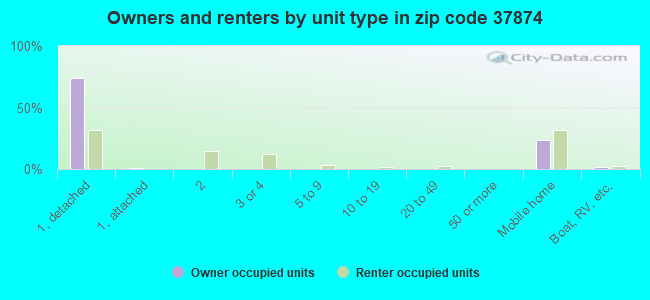
% of renters here:
36%
State:
33%
March 2022 cost of living index in zip code 37874: 79.0 (low, U.S. average is 100)
Land area: 101.7 sq. mi. Water area: 0.1 sq. mi.
Population density: 160 people per square mile
(very low).
OSM Map
General Map
Google Map
MSN Map
OSM Map
General Map
Google Map
MSN Map
OSM Map
General Map
Google Map
MSN Map
OSM Map
General Map
Google Map
MSN Map
Please wait while loading the map...
Real estate property taxes paid for housing units in 2022:
This zip code:
0.4% ($762)
Tennessee:
0.5% ($1,376)
Median real estate property taxes paid for housing units with mortgages in 2022: $723 (0.3%) Median real estate property taxes paid for housing units with no mortgage in 2022: $813 (0.5%)
Averages for the 2020 tax year for zip code 37874, filed in 2021:
Average Adjusted Gross Income (AGI) in 2020: $49,683 (Individual Income Tax Returns)
Here:
$49,683
State:
$69,014
Salary/wage: $42,744 (reported on 83.3% of returns)
Here:
$42,744
State:
$55,872
(% of AGI for various income ranges: 1077.7% for AGIs below $25k, 3437.2% for AGIs $25k-50k, 6278.1% for AGIs $50k-75k, 8320.2% for AGIs $75k-100k, 15771.8% for AGIs $100k-200k, 42062.5% for AGIs over 200k)
Taxable interest for individuals: $1,294 (reported on 21.5% of returns)
This zip code:
$1,294
Tennessee:
$1,945
(% of AGI for various income ranges: 11.3% for AGIs below $25k, 15.8% for AGIs $25k-50k, 20.8% for AGIs $50k-75k, 65.5% for AGIs $75k-100k, 125.9% for AGIs $100k-200k, 1145.0% for AGIs over 200k)
Ordinary dividends: $5,290 (reported on 8.7% of returns)
Here:
$5,290
State:
$8,105
(% of AGI for various income ranges: 10.6% for AGIs below $25k, 15.8% for AGIs $25k-50k, 30.8% for AGIs $50k-75k, 66.4% for AGIs $75k-100k, 299.5% for AGIs $100k-200k, 2405.0% for AGIs over 200k)
Net capital gain/loss in AGI: +$12,054 (reported on 9.3% of returns)
Here:
+$12,054
State:
+$33,664
(% of AGI for various income ranges: 9.4% for AGIs below $25k, 34.2% for AGIs $25k-50k, 58.5% for AGIs $50k-75k, 196.4% for AGIs $75k-100k, 675.4% for AGIs $100k-200k, 7322.5% for AGIs over 200k)
Profit/loss from business: +$17,362 (reported on 13.2% of returns)
Here:
+$17,362
State:
+$18,991
(% of AGI for various income ranges: 137.7% for AGIs below $25k, 154.4% for AGIs $25k-50k, 159.7% for AGIs $50k-75k, 152.9% for AGIs $75k-100k, 573.3% for AGIs $100k-200k, 14960.0% for AGIs over 200k)
Taxable individual retirement arrangement distribution: $17,393 (reported on 6.2% of returns)
37874:
$17,393
Tennessee:
$20,036
(% of AGI for various income ranges: 49.1% for AGIs below $25k, 50.2% for AGIs $25k-50k, 130.7% for AGIs $50k-75k, 275.5% for AGIs $75k-100k, 853.3% for AGIs $100k-200k)
Total itemized deductions: $38,550 (reported on 2.1% of returns)
Here:
$38,550
State:
$40,136
(% of AGI for various income ranges: 23.2% for AGIs below $25k, 185.3% for AGIs $50k-75k, 405.4% for AGIs $100k-200k, 4895.0% for AGIs over 200k)
Charity contributions: $15,717 (reported on 1.8% of returns)
Here:
$15,717
State:
$19,852
(% of AGI for various income ranges: 43.7% for AGIs $50k-75k, 184.6% for AGIs $100k-200k, 2095.0% for AGIs over 200k)
Taxes paid: $5,514 (reported on 2.1% of returns)
37874:
$5,514
State:
$6,038
(% of AGI for various income ranges: 2.4% for AGIs below $25k, 27.7% for AGIs $50k-75k, 67.2% for AGIs $100k-200k, 635.0% for AGIs over 200k)
Earned income credit: $2,404 (reported on 23.3% of returns)
Here:
$2,404
State:
$2,391
(% of AGI for various income ranges: 110.5% for AGIs below $25k, 90.5% for AGIs $25k-50k, 1.7% for AGIs $50k-75k)
Percentage of individuals using paid preparers for their 2020 taxes: 95.7%
Here:
96%
State:
93%
(% for various income ranges: 94.8% for AGIs below $25k, 96.5% for AGIs $25k-50k, 95.9% for AGIs $50k-75k, 96.3% for AGIs $75k-100k, 95.3% for AGIs $100k-200k, 100.0% for AGIs over 200k)
Averages for the 2012 tax year for zip code 37874, filed in 2013:
Average Adjusted Gross Income (AGI) in 2012: $39,617 (Individual Income Tax Returns)
Here:
$39,617
State:
$53,767
Salary/wage: $34,996 (reported on 85.5% of returns)
Here:
$34,996
State:
$45,421
(% of AGI for various income ranges: 76.3% for AGIs below $25k, 82.2% for AGIs $25k-50k, 81.5% for AGIs $50k-75k, 78.4% for AGIs $75k-100k, 73.3% for AGIs $100k-200k, 41.7% for AGIs over 200k)
Taxable interest for individuals: $1,527 (reported on 20.9% of returns)
This zip code:
$1,527
Tennessee:
$1,732
(% of AGI for various income ranges: 1.1% for AGIs below $25k, 0.7% for AGIs $25k-50k, 0.7% for AGIs $50k-75k, 0.8% for AGIs $75k-100k, 0.7% for AGIs $100k-200k, 1.0% for AGIs over 200k)
Ordinary dividends: $2,873 (reported on 8.6% of returns)
Here:
$2,873
State:
$6,739
(% of AGI for various income ranges: 0.6% for AGIs below $25k, 0.4% for AGIs $25k-50k, 0.7% for AGIs $50k-75k, 0.3% for AGIs $75k-100k, 0.8% for AGIs $100k-200k, 1.3% for AGIs over 200k)
Net capital gain/loss in AGI: +$6,122 (reported on 7.6% of returns)
Here:
+$6,122
State:
+$19,082
(% of AGI for various income ranges: 0.1% for AGIs $50k-75k, 0.5% for AGIs $75k-100k, 1.5% for AGIs $100k-200k, 9.4% for AGIs over 200k)
Profit/loss from business: +$14,939 (reported on 13.6% of returns)
Here:
+$14,939
State:
+$15,240
(% of AGI for various income ranges: 8.4% for AGIs below $25k, 3.1% for AGIs $25k-50k, 1.7% for AGIs $50k-75k, 3.1% for AGIs $75k-100k, 13.7% for AGIs $100k-200k)
Taxable individual retirement arrangement distribution: $12,743 (reported on 7.3% of returns)
37874:
$12,743
Tennessee:
$15,505
(% of AGI for various income ranges: 1.9% for AGIs below $25k, 2.0% for AGIs $25k-50k, 1.8% for AGIs $50k-75k, 2.7% for AGIs $75k-100k, 4.9% for AGIs $100k-200k)
Total itemized deductions: $18,391 (23% of AGI, reported on 14.8% of returns)
Here:
$18,391
State:
$21,976
Here:
22.6% of AGI
State:
17.8% of AGI
(% of AGI for various income ranges: 4.3% for AGIs below $25k, 6.3% for AGIs $25k-50k, 6.6% for AGIs $50k-75k, 9.0% for AGIs $75k-100k, 8.5% for AGIs $100k-200k, 6.8% for AGIs over 200k)
Charity contributions: $5,373 (reported on 10.6% of returns)
Here:
$5,373
State:
$6,709
(% of AGI for various income ranges: 0.6% for AGIs below $25k, 0.9% for AGIs $25k-50k, 1.1% for AGIs $50k-75k, 1.7% for AGIs $75k-100k, 2.5% for AGIs $100k-200k, 2.8% for AGIs over 200k)
Taxes paid: $3,515 (reported on 14.3% of returns)
37874:
$3,515
State:
$4,829
(% of AGI for various income ranges: 0.6% for AGIs below $25k, 1.0% for AGIs $25k-50k, 1.2% for AGIs $50k-75k, 1.5% for AGIs $75k-100k, 1.8% for AGIs $100k-200k, 2.0% for AGIs over 200k)
Earned income credit: $2,378 (reported on 27.4% of returns)
Here:
$2,378
State:
$2,404
(% of AGI for various income ranges: 8.5% for AGIs below $25k, 1.5% for AGIs $25k-50k)
Percentage of individuals using paid preparers for their 2012 taxes: 58.3%
Here:
58%
State:
52%
(% for various income ranges: 54.9% for AGIs below $25k, 58.6% for AGIs $25k-50k, 60.5% for AGIs $50k-75k, 64.1% for AGIs $75k-100k, 71.0% for AGIs $100k-200k, 80.0% for AGIs over 200k)
Averages for the 2004 tax year for zip code 37874, filed in 2005:
Average Adjusted Gross Income (AGI) in 2004: $32,596 (Individual Income Tax Returns)
Here:
$32,596
State:
$44,088
Salary/wage: $30,327 (reported on 86.7% of returns)
Here:
$30,327
State:
$38,825
(% of AGI for various income ranges: 156.0% for AGIs below $10k, 80.0% for AGIs $10k-25k, 87.4% for AGIs $25k-50k, 87.7% for AGIs $50k-75k, 79.8% for AGIs $75k-100k, 53.3% for AGIs over 100k)
Taxable interest for individuals: $1,602 (reported on 29.3% of returns)
This zip code:
$1,602
Tennessee:
$1,802
(% of AGI for various income ranges: 5.6% for AGIs below $10k, 1.8% for AGIs $10k-25k, 1.0% for AGIs $25k-50k, 0.8% for AGIs $50k-75k, 1.4% for AGIs $75k-100k, 2.2% for AGIs over 100k)
Taxable dividends: $3,680 (reported on 10.3% of returns)
Here:
$3,680
State:
$3,727
(% of AGI for various income ranges: 2.0% for AGIs below $10k, 0.5% for AGIs $10k-25k, 0.4% for AGIs $25k-50k, 0.5% for AGIs $50k-75k, 0.9% for AGIs $75k-100k, 4.1% for AGIs over 100k)
Net capital gain/loss: +$8,355 (reported on 8.7% of returns)
Here:
+$8,355
State:
+$15,776
(% of AGI for various income ranges: 1.6% for AGIs below $10k, 0.1% for AGIs $10k-25k, 0.8% for AGIs $25k-50k, 1.0% for AGIs $50k-75k, 2.8% for AGIs $75k-100k, 7.9% for AGIs over 100k)
Profit/loss from business: +$10,378 (reported on 16.0% of returns)
Here:
+$10,378
State:
+$12,882
(% of AGI for various income ranges: 20.2% for AGIs below $10k, 6.3% for AGIs $10k-25k, 2.5% for AGIs $25k-50k, 3.1% for AGIs $50k-75k, 3.6% for AGIs $75k-100k, 10.6% for AGIs over 100k)
IRA payment deduction: $2,769 (reported on 1.9% of returns)
37874:
$2,769
Tennessee:
$2,934
(% of AGI for various income ranges: 0.1% for AGIs $10k-25k, 0.2% for AGIs $25k-50k, 0.1% for AGIs $50k-75k, 0.4% for AGIs $75k-100k)
Self-employed pension: $23,684 (reported on 0.3% of returns)
Here:
$23,684
Tennessee:
$16,857
Total itemized deductions: $17,484 (25% of AGI, reported on 14.5% of returns)
Here:
$17,484
State:
$18,035
Here:
25.2% of AGI
State:
19.9% of AGI
(% of AGI for various income ranges: 8.6% for AGIs below $10k, 4.8% for AGIs $10k-25k, 7.3% for AGIs $25k-50k, 7.7% for AGIs $50k-75k, 9.5% for AGIs $75k-100k, 10.2% for AGIs over 100k)
Charity contributions deductions: $5,386 (7% of AGI, reported on 11.1% of returns)
Here:
$5,386
State:
$5,167
Here:
6.9% of AGI
State:
5.3% of AGI
(% of AGI for various income ranges: 0.5% for AGIs below $10k, 0.6% for AGIs $10k-25k, 0.8% for AGIs $25k-50k, 1.7% for AGIs $50k-75k, 2.6% for AGIs $75k-100k, 4.6% for AGIs over 100k)
Total tax: $4,322 (reported on 70.2% of returns)
37874:
$4,322
State:
$7,482
(% of AGI for various income ranges: 6.3% for AGIs below $10k, 3.8% for AGIs $10k-25k, 6.2% for AGIs $25k-50k, 8.6% for AGIs $50k-75k, 10.9% for AGIs $75k-100k, 19.6% for AGIs over 100k)
Earned income credit: $1,830 (reported on 24.7% of returns)
Here:
$1,830
State:
$1,826
Percentage of individuals using paid preparers for their 2004 taxes: 65.1%
Here:
65%
State:
60%
(% for various income ranges: 59.6% for AGIs below $10k, 64.0% for AGIs $10k-25k, 66.8% for AGIs $25k-50k, 68.3% for AGIs $50k-75k, 68.1% for AGIs $75k-100k, 81.2% for AGIs over 100k)
Likely homosexual households (counted as self-reported same-sex unmarried-partner households)
Lesbian couples: 0.3% of all households
Gay men: 0.0% of all households
Household received Food Stamps/SNAP in the past 12 months: 1,567 Household did not receive Food Stamps/SNAP in the past 12 months: 5,436
Women who had a birth in the past 12 months: 289 (246 now married, 45 unmarried) Women who did not have a birth in the past 12 months: 3,542 (1,753 now married, 1,789 unmarried)
Housing units in zip code 37874 with a mortgage: 2,098 (92 second mortgage, 83 both second mortgage and home equity loan) Median monthly owner costs for units with a mortgage: $1,130 Median monthly owner costs for units without a mortgage: $347
Residents with income below the poverty level in 2022:
This zip code:
16.5%
Whole state:
13.3%
Residents with income below 50% of the poverty level in 2022:
This zip code:
9.6%
Whole state:
7.1%
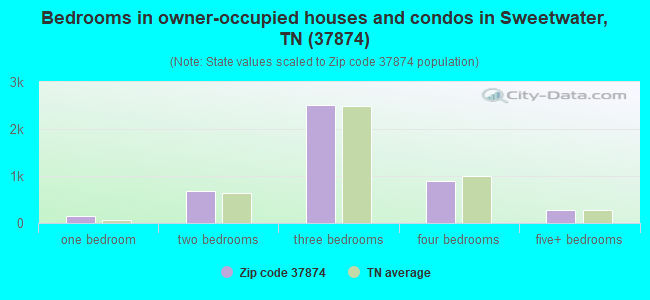
Median number of rooms in houses and condos:
Here:
6.2
State:
6.5
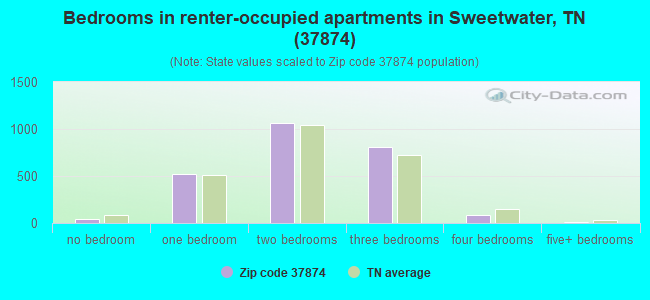
Median number of rooms in apartments:
Here:
4.1
State:
4.4
Notable locations in this zip code not listed on our city pages
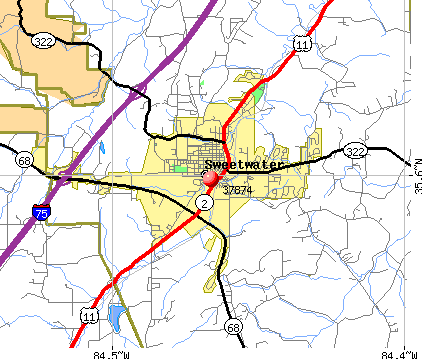
Notable locations in zip code 37874: Gilman Switch (A), Sweetwater Industrial Park (B), Christianburg Fire Department (C), Sweetwater Fire Department Station 1 (D), Sweetwater Public Library (E), Sweetwater City Hall (F), Sweetwater Fire Department Station 2 (G), North Monroe Volunteer Fire Department (H). Display/hide their locations on the map
Churches in zip code 37874 include: Fenders Church (A), Sweetwater United Methodist Church (B), Sweetwater Church of the Nazarene (C), Sweetwater Church of God (D), Sweetwater Church of Christ (E), Place for the Gospel Baptist Church (F), Outpost Mission Church (G), North Sweetwater Baptist Church (H), Mount Bethel Baptist Church (I). Display/hide their locations on the map
Cemeteries: Sweetwater Valley Memorial Park (1), Taylor Cemetery (2), Jones Cemetery (3), West View Cemetery (4), Greenbriar Cemetery (5), Burton Cemetery (6), Richardson Cemetery (7). Display/hide their locations on the map
Reservoirs: C A Waymier Lake (A), Sweetwater Creek Project Lake (B), Ballard Mill Lead Mine Pond (C), Craighead Lake (D), Sweetwater Creek Watershed Number Sixteen Reservoir (E), Sweetwater Creek Watershed Number One Reservoir (F). Display/hide their locations on the map
Streams, rivers, and creeks: Florida Branch (A), Greasy Branch (B), Cherry Branch (C), Burton Branch (D), Pond Creek (E), Mud Creek (F), Turkeypen Branch (G), Red Branch (H). Display/hide their locations on the map
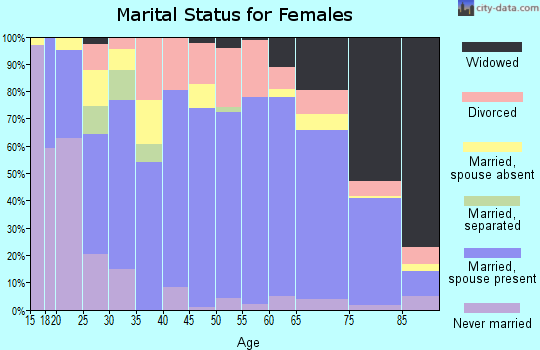
1,898 married couples with children.
1,004 single-parent households (204 men, 800 women).
94.5% of residents of 37874 zip code speak English at home.
3.8% of residents speak Spanish at home (57% very well, 22% well, 21% not well).
0.8% of residents speak other Indo-European language at home (96% very well, 4% well).
0.4% of residents speak Asian or Pacific Island language at home (100% very well).
0.3% of residents speak other language at home (100% very well).
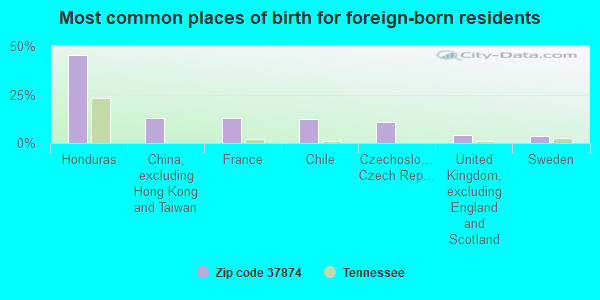
Foreign born population: 457 (2.8%) (45.3% of them are naturalized citizens)
This zip code:
2.8%
Whole state:
5.6%
46%Honduras
13%China, excluding Hong Kong and Taiwan
13%France
12%Chile
11%Czechoslovakia (includes Czech Republic and Slovakia)
4%United Kingdom, excluding England and Scotland
4%Sweden
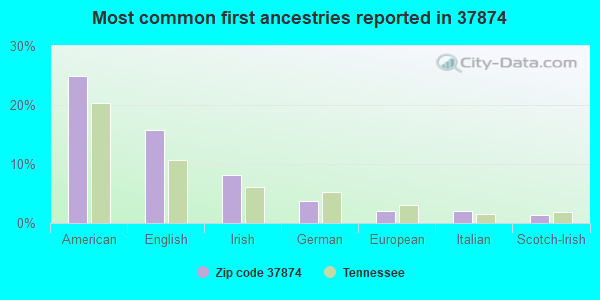
25%American
16%English
8%Irish
4%German
2%European
2%Italian
1%Scotch-Irish
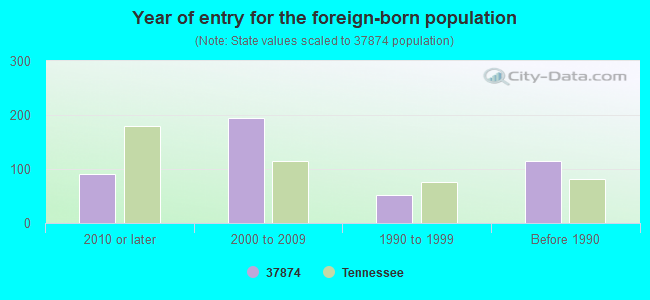
Year of entry for the foreign-born population
902010 or later
1952000 to 2009
511990 to 1999
115Before 1990
Major facilities with environmental interests located in this zip code:
BROWN ELEMENTARY SCHOOL (STARRETT STREET in SWEETWATER, TN)
(Geographic Names Information System) (National Center for Education Statistics) - STATE ID-0005 Organizations: SWEETWATER CITY SCHOOL DIST (SCHOOL DISTRICT)
BARNETT CLEANERS (201 MAYES AVE in SWEETWATER, TN)
(Resource Conservation and Recovery Act (tracking hazardous waste)) Organizations: MIKE LITTLETON (CONTACT/OPERATOR)
3 M CONSTRUCTION (HWY 68 WEST in SWEETWATER, TN)
AIR MINOR (AIRS/AFS) Business SIC classification: ASPHALT PAVING MIXTURES AND BLOCKS
AEROFLEX U.S.A., INC. (282 INDUSTRIAL PARK DRIVE in SWEETWATER, TN)
AIR MINOR (AIRS/AFS) Business SIC classification: MOTOR VEHICLE SUPPLIES AND NEW PARTS
AGRICO CHEMICAL CO AGRICO FARM CENTER (HWY 11 NORTH in SWEETWATER, TN)
(Resource Conservation and Recovery Act (tracking hazardous waste))
ATLANTIC SOFT DRINK CO. INC. (ROUTE 2 BUILDERBACH RD in SWEETWATER, TN)
(Resource Conservation and Recovery Act (tracking hazardous waste))
CAMPBELL MACHINE & TOOL (RURAL RT 4 in SWEETWATER, TN)
(Resource Conservation and Recovery Act (tracking hazardous waste)) Business NAICS classification: OTHER COMMERCIAL AND SERVICE INDUSTRY MACHINERY MANUFACTURING.
CELOTEX CORPORATION THE (TRI-LAKES MARINE 6155551212 in SWEETWATER, TN)
(Resource Conservation and Recovery Act (tracking hazardous waste)) Business NAICS classification: IRON FOUNDRIES.; FABRICATED STRUCTURAL METAL MANUFACTURING.
CHEROKEE MANUFACTURING INC (0. N 4969. Y H09 Y Y in SWEETWATER, TN)
(Resource Conservation and Recovery Act (tracking hazardous waste)) Business NAICS classification: ALL OTHER TRANSPORTATION EQUIPMENT MANUFACTURING.
CLEVELAND MANUFACTURING CO (RURAL RT 2 in SWEETWATER, TN)
(Resource Conservation and Recovery Act (tracking hazardous waste)) Business NAICS classification: PLATE WORK MANUFACTURING.
DILBECK TRUCKING (238 COUNTY ROAD 322 in SWEETWATER, TN)
(Resource Conservation and Recovery Act (tracking hazardous waste))
BRYANT BOATS, INC. (306 NORTH ST in SWEETWATER, TN)
AIR SYNTHETIC MINOR (AIRS/AFS)
CHARISMA CHAIRS (335 HWY. 11 S. in SWEETWATER, TN)
TRI REPORTER (Tracking of toxic chemicals releasing facilities) Business SIC classification: WOOD HOUSEHOLD FURNITURE, UPHOLSTERED
Housing units lacking complete plumbing facilities: 1.2% Housing units lacking complete kitchen facilities: 1.3%
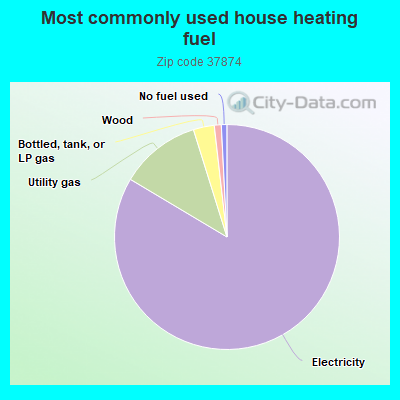
83.4%Electricity
11.6%Utility gas
3.0%Bottled, tank, or LP gas
1.0%Wood
0.8%No fuel used
Population in 1990: 11,415. Population change in the 1990s: +1,726 (+15.1%).
Place of birth for U.S.-born residents:
This state: 9,737
Northeast: 823
Midwest: 2,034
South: 2,402
West: 757
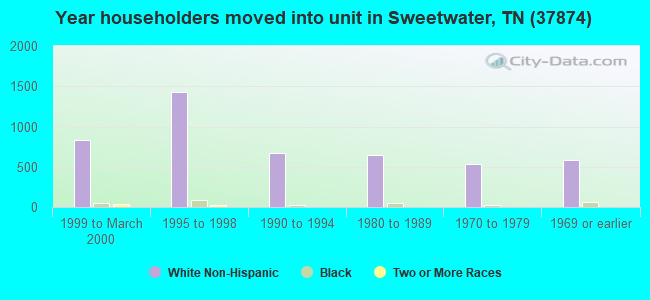
55% of the 37874 zip code residents lived in the same house 5 years ago. Out of people who lived in different houses, 46% lived in this county. Out of people who lived in different counties, 50% lived in Tennessee.
87% of the 37874 zip code residents lived in the same house 1 year ago. Out of people who lived in different houses, 24% moved from this county. Out of people who lived in different houses, 39% moved from different county within same state. Out of people who lived in different houses, 39% moved from different state.
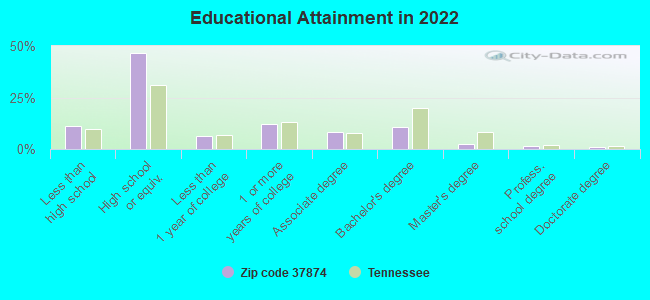
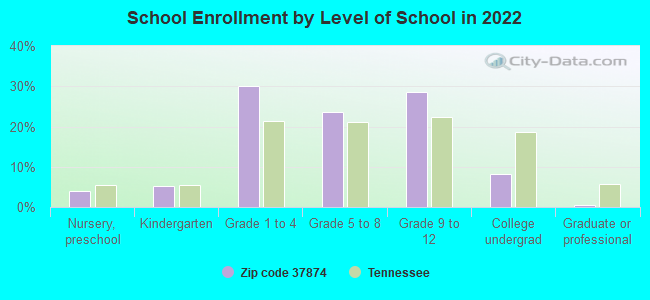
Private vs. public school enrollment:
Students in private schools in grades 1 to 8 (elementary and middle school): 101
Here:
6.4%
Tennessee:
15.0%
Students in private schools in grades 9 to 12 (high school): 83
Here:
10.1%
Tennessee:
16.2%
Students in private undergraduate colleges: 112
Here:
46.6%
Tennessee:
23.5%
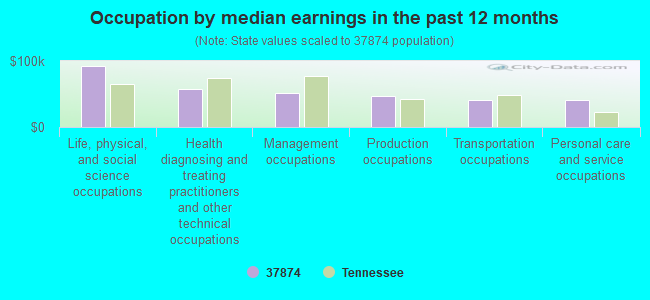
Occupation by median earnings in the past 12 months ($)
92,287Life, physical, and social science occupations
57,800Health diagnosing and treating practitioners and other technical occupations
52,172Management occupations
46,597Production occupations
40,792Transportation occupations
40,374Personal care and service occupations
Companies with federal contracts located in this zip code:
SCOTT DEVINE DDS (501 N OAK in SWEETWATER, TN; small business) : $5,808 in 2 contractsin 2004
$2,988 with Army for Dentistry Services. Signed on 2004-05-04. Completion date: 2004-04-02.
$2,820, same as above.Signed on 2004-04-02. Completion date: 2004-04-02.
POWELL ARMY NAVY SURPLUS, INC (2256 HWY 11 N in SWEETWATER, TN; small business)
$3,850 with Army for Individual Equipment. Signed on 2004-10-21. Completion date: 2004-12-02.
MISTRY, NEIL (731 S MAIN ST in SWEETWATER, TN; small business) : $0 in 2 contractsfrom 2004 to 2005
$3,999 with Army for Lodging - Hotel/Motel. Signed on 2004-06-30. Completion date: 2004-06-17.
-$3,999, same as above.Signed on 2005-03-31. Completion date: 2004-06-17.
Top industries in this zip code by the number of employees in 2005:
Health Care and Social Assistance: General Medical and Surgical Hospitals (250-499 employees: 1 establishment)
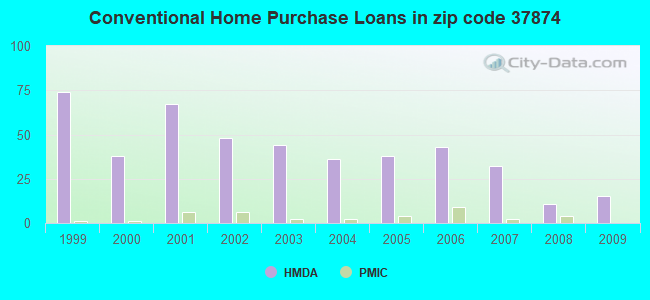
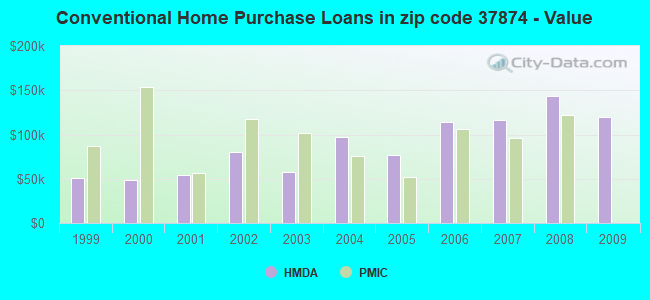
Detailed PMIC statistics for the following Tracts:0607.00
2002 - 2018 National Fire Incident Reporting System (NFIRS) incidents
According to the data from the years 2002 - 2018 the average number of fire incidents per year is 105. The highest number of reported fires - 155 took place in 2016, and the least - 46 in 2002. The data has a growing trend.
When looking into fire subcategories, the most incidents belonged to: Structure Fires (39.3%), and Outside Fires (38.6%).
Fire incident types reported to NFIRS in Zip Code 37874
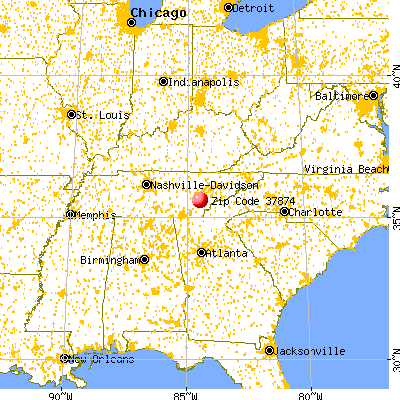


 Nearest zip codes: 37846, 37826, 37354, 37774, 37329, 37763.
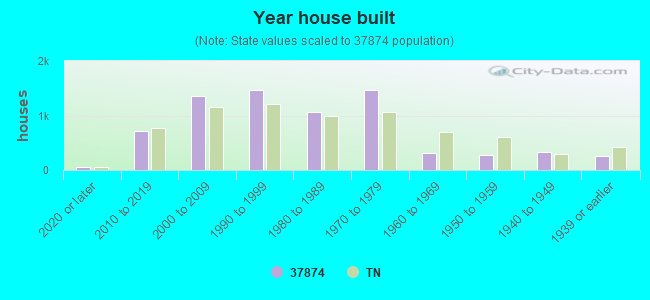


 According to the data from the years 2002 - 2018 the average number of fire incidents per year is 105. The highest number of reported fires - 155 took place in 2016, and the least - 46 in 2002. The data has a growing trend.
 When looking into fire subcategories, the most incidents belonged to: Structure Fires (39.3%), and Outside Fires (38.6%).