Estimated zip code population in 2022: 4,032 Zip code population in 2010: 4,361 Zip code population in 2000: 3,607
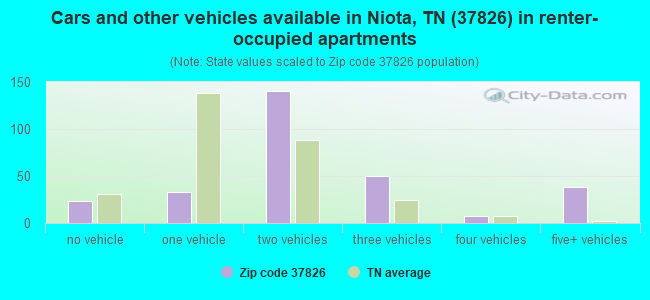
Houses and condos: 1,938 Renter-occupied apartments: 286
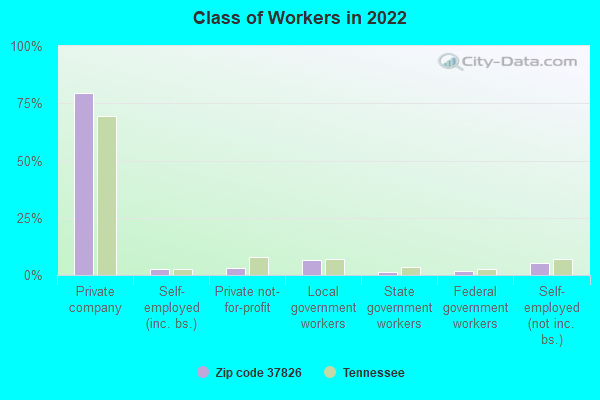
% of renters here:
16%
State:
33%
March 2022 cost of living index in zip code 37826: 79.9 (low, U.S. average is 100)
Land area: 55.0 sq. mi. Water area: 0.0 sq. mi.
Population density: 73 people per square mile
(very low).
OSM Map
General Map
Google Map
MSN Map
OSM Map
General Map
Google Map
MSN Map
OSM Map
General Map
Google Map
MSN Map
OSM Map
General Map
Google Map
MSN Map
Please wait while loading the map...
Real estate property taxes paid for housing units in 2022:
This zip code:
0.3% ($601)
Tennessee:
0.5% ($1,376)
Median real estate property taxes paid for housing units with mortgages in 2022: $685 (0.3%) Median real estate property taxes paid for housing units with no mortgage in 2022: $570 (0.3%)
Business Search- 14 Million verified businesses
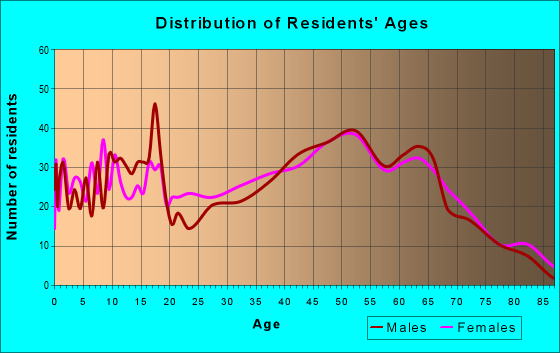
Males: 2,080
(51.6%)
Females: 1,952
(48.4%)
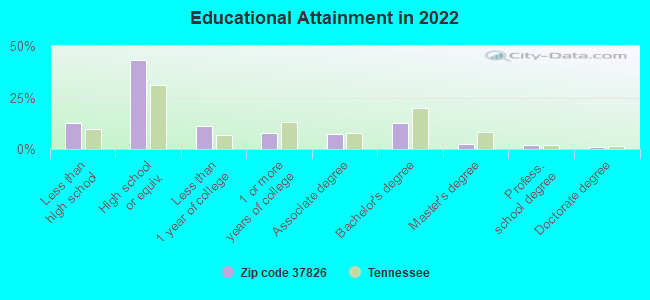
For population 25 years and over in 37826:
High school or higher: 85.6%
Bachelor's degree or higher: 17.3%
Graduate or professional degree: 4.9%
Unemployed: 1.3%
Mean travel time to work (commute): 25.7 minutes
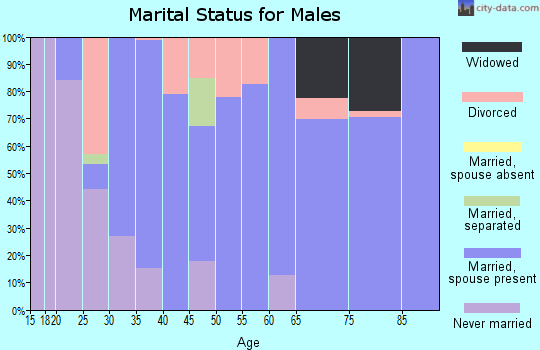
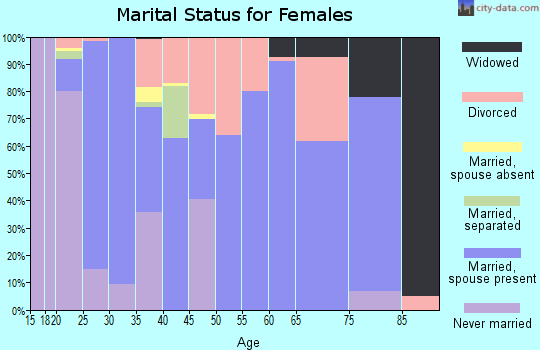
For population 15 years and over in 37826:
Never married: 19.1%
Now married: 63.0%
Separated: 1.2%
Widowed: 8.9%
Divorced: 7.8%
Zip code 37826 compared to state average:
Unemployed percentage below state average.
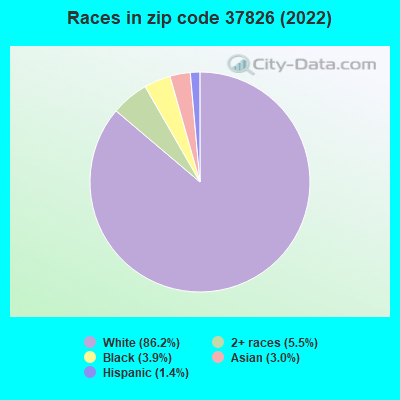
Black race population percentage significantly below state average.
Hispanic race population percentage significantly below state average.
Median age significantly above state average.
Foreign-born population percentage below state average.
Renting percentage below state average.
Length of stay since moving in above state average.
Number of college students below state average.
Percentage of population with a bachelor's degree or higher below state average.
Averages for the 2020 tax year for zip code 37826, filed in 2021:
Average Adjusted Gross Income (AGI) in 2020: $48,355 (Individual Income Tax Returns)
Here:
$48,355
State:
$69,014
Salary/wage: $43,860 (reported on 81.0% of returns)
Here:
$43,860
State:
$55,872
(% of AGI for various income ranges: 1049.3% for AGIs below $25k, 3557.8% for AGIs $25k-50k, 6010.0% for AGIs $50k-75k, 8534.6% for AGIs $75k-100k, 14029.3% for AGIs $100k-200k)
Taxable interest for individuals: $1,025 (reported on 24.6% of returns)
This zip code:
$1,025
Tennessee:
$1,945
(% of AGI for various income ranges: 14.0% for AGIs below $25k, 26.7% for AGIs $25k-50k, 40.8% for AGIs $50k-75k, 52.3% for AGIs $75k-100k, 79.3% for AGIs $100k-200k)
Ordinary dividends: $1,938 (reported on 7.6% of returns)
Here:
$1,938
State:
$8,105
(% of AGI for various income ranges: 3.3% for AGIs below $25k, 16.5% for AGIs $25k-50k, 14.6% for AGIs $50k-75k, 46.9% for AGIs $75k-100k, 78.6% for AGIs $100k-200k)
Net capital gain/loss in AGI: +$4,360 (reported on 9.5% of returns)
Here:
+$4,360
State:
+$33,664
(% of AGI for various income ranges: 32.9% for AGIs $25k-50k, 91.5% for AGIs $50k-75k, 43.8% for AGIs $75k-100k, 302.9% for AGIs $100k-200k)
Profit/loss from business: +$11,070 (reported on 14.2% of returns)
Here:
+$11,070
State:
+$18,991
(% of AGI for various income ranges: 155.0% for AGIs below $25k, 165.5% for AGIs $25k-50k, 135.0% for AGIs $50k-75k, 267.7% for AGIs $75k-100k, 629.3% for AGIs $100k-200k)
Taxable individual retirement arrangement distribution: $14,106 (reported on 8.5% of returns)
37826:
$14,106
Tennessee:
$20,036
(% of AGI for various income ranges: 49.7% for AGIs below $25k, 111.8% for AGIs $25k-50k, 162.3% for AGIs $50k-75k, 243.8% for AGIs $75k-100k, 681.4% for AGIs $100k-200k)
Total itemized deductions: $29,925 (reported on 1.9% of returns)
Here:
$29,925
State:
$40,136
(% of AGI for various income ranges: 460.4% for AGIs $50k-75k)
Charity contributions: $10,667 (reported on 1.4% of returns)
Here:
$10,667
State:
$19,852
(% of AGI for various income ranges: 123.1% for AGIs $50k-75k)
Taxes paid: $3,050 (reported on 1.9% of returns)
37826:
$3,050
State:
$6,038
(% of AGI for various income ranges: 46.9% for AGIs $50k-75k)
Earned income credit: $2,249 (reported on 19.4% of returns)
Here:
$2,249
State:
$2,391
(% of AGI for various income ranges: 96.3% for AGIs below $25k, 70.2% for AGIs $25k-50k)
Percentage of individuals using paid preparers for their 2020 taxes: 94.3%
Here:
94%
State:
93%
(% for various income ranges: 93.4% for AGIs below $25k, 93.5% for AGIs $25k-50k, 93.9% for AGIs $50k-75k, 94.1% for AGIs $75k-100k, 100.0% for AGIs $100k-200k, 100.0% for AGIs over 200k)
Averages for the 2012 tax year for zip code 37826, filed in 2013:
Average Adjusted Gross Income (AGI) in 2012: $39,639 (Individual Income Tax Returns)
Here:
$39,639
State:
$53,767
Salary/wage: $35,825 (reported on 85.5% of returns)
Here:
$35,825
State:
$45,421
(% of AGI for various income ranges: 73.7% for AGIs below $25k, 81.8% for AGIs $25k-50k, 84.8% for AGIs $50k-75k, 83.5% for AGIs $75k-100k, 61.7% for AGIs $100k-200k)
Taxable interest for individuals: $1,113 (reported on 24.7% of returns)
This zip code:
$1,113
Tennessee:
$1,732
(% of AGI for various income ranges: 1.3% for AGIs below $25k, 0.9% for AGIs $25k-50k, 0.5% for AGIs $50k-75k, 0.1% for AGIs $75k-100k, 0.7% for AGIs $100k-200k)
Ordinary dividends: $1,219 (reported on 8.6% of returns)
Here:
$1,219
State:
$6,739
(% of AGI for various income ranges: 0.4% for AGIs below $25k, 0.3% for AGIs $25k-50k, 0.1% for AGIs $75k-100k, 0.4% for AGIs $100k-200k)
Net capital gain/loss in AGI: +$2,793 (reported on 8.1% of returns)
Here:
+$2,793
State:
+$19,082
(% of AGI for various income ranges: 0.5% for AGIs $25k-50k, 0.2% for AGIs $50k-75k, 1.9% for AGIs $100k-200k)
Profit/loss from business: +$6,973 (reported on 16.1% of returns)
Here:
+$6,973
State:
+$15,240
(% of AGI for various income ranges: 9.1% for AGIs below $25k, 2.0% for AGIs $25k-50k, 2.4% for AGIs $50k-75k, 2.3% for AGIs $100k-200k)
Taxable individual retirement arrangement distribution: $14,646 (reported on 7.0% of returns)
37826:
$14,646
Tennessee:
$15,505
(% of AGI for various income ranges: 1.8% for AGIs below $25k, 1.5% for AGIs $25k-50k, 3.0% for AGIs $50k-75k, 5.8% for AGIs $100k-200k)
Total itemized deductions: $18,754 (26% of AGI, reported on 14.0% of returns)
Here:
$18,754
State:
$21,976
Here:
25.7% of AGI
State:
17.8% of AGI
(% of AGI for various income ranges: 3.3% for AGIs below $25k, 4.4% for AGIs $25k-50k, 8.8% for AGIs $50k-75k, 8.5% for AGIs $75k-100k, 7.2% for AGIs $100k-200k)
Charity contributions: $4,162 (reported on 11.3% of returns)
Here:
$4,162
State:
$6,709
(% of AGI for various income ranges: 1.0% for AGIs $25k-50k, 1.3% for AGIs $50k-75k, 1.5% for AGIs $75k-100k, 1.8% for AGIs $100k-200k)
Taxes paid: $3,158 (reported on 14.0% of returns)
37826:
$3,158
State:
$4,829
(% of AGI for various income ranges: 0.4% for AGIs below $25k, 0.7% for AGIs $25k-50k, 1.4% for AGIs $50k-75k, 1.6% for AGIs $75k-100k, 1.3% for AGIs $100k-200k)
Earned income credit: $2,190 (reported on 26.9% of returns)
Here:
$2,190
State:
$2,404
(% of AGI for various income ranges: 7.8% for AGIs below $25k, 1.6% for AGIs $25k-50k)
Percentage of individuals using paid preparers for their 2012 taxes: 60.8%
Here:
61%
State:
52%
(% for various income ranges: 58.1% for AGIs below $25k, 58.7% for AGIs $25k-50k, 65.5% for AGIs $50k-75k, 60.0% for AGIs $75k-100k, 80.0% for AGIs $100k-200k)
Averages for the 2004 tax year for zip code 37826, filed in 2005:
Average Adjusted Gross Income (AGI) in 2004: $36,267 (Individual Income Tax Returns)
Here:
$36,267
State:
$44,088
Salary/wage: $32,528 (reported on 86.7% of returns)
Here:
$32,528
State:
$38,825
(% of AGI for various income ranges: 109.6% for AGIs below $10k, 82.2% for AGIs $10k-25k, 86.5% for AGIs $25k-50k, 89.0% for AGIs $50k-75k, 78.3% for AGIs $75k-100k, 40.8% for AGIs over 100k)
Taxable interest for individuals: $1,495 (reported on 33.6% of returns)
This zip code:
$1,495
Tennessee:
$1,802
(% of AGI for various income ranges: 5.1% for AGIs below $10k, 2.1% for AGIs $10k-25k, 1.2% for AGIs $25k-50k, 0.9% for AGIs $50k-75k, 0.8% for AGIs $75k-100k, 2.0% for AGIs over 100k)
Taxable dividends: $1,049 (reported on 8.3% of returns)
Here:
$1,049
State:
$3,727
(% of AGI for various income ranges: 0.3% for AGIs below $10k, 0.1% for AGIs $10k-25k, 0.2% for AGIs $25k-50k, 0.1% for AGIs $50k-75k, 0.2% for AGIs $75k-100k, 0.7% for AGIs over 100k)
Net capital gain/loss: +$10,743 (reported on 7.9% of returns)
Here:
+$10,743
State:
+$15,776
(% of AGI for various income ranges: 0.4% for AGIs $10k-25k, 0.1% for AGIs $25k-50k, 0.2% for AGIs $50k-75k, 2.4% for AGIs $75k-100k, 10.5% for AGIs over 100k)
Profit/loss from business: +$9,127 (reported on 16.9% of returns)
Here:
+$9,127
State:
+$12,882
(% of AGI for various income ranges: 7.9% for AGIs below $10k, 6.1% for AGIs $10k-25k, 3.3% for AGIs $25k-50k, 2.0% for AGIs $50k-75k, 3.5% for AGIs $75k-100k, 7.8% for AGIs over 100k)
IRA payment deduction: $2,176 (reported on 2.0% of returns)
37826:
$2,176
Tennessee:
$2,934
Total itemized deductions: $14,963 (21% of AGI, reported on 15.8% of returns)
Here:
$14,963
State:
$18,035
Here:
20.6% of AGI
State:
19.9% of AGI
(% of AGI for various income ranges: 5.1% for AGIs $10k-25k, 6.5% for AGIs $25k-50k, 6.0% for AGIs $50k-75k, 10.8% for AGIs $75k-100k, 6.3% for AGIs over 100k)
Charity contributions deductions: $3,735 (5% of AGI, reported on 12.5% of returns)
Here:
$3,735
State:
$5,167
Here:
4.8% of AGI
State:
5.3% of AGI
(% of AGI for various income ranges: 0.6% for AGIs $10k-25k, 0.9% for AGIs $25k-50k, 1.1% for AGIs $50k-75k, 2.2% for AGIs $75k-100k, 2.1% for AGIs over 100k)
Total tax: $4,420 (reported on 72.1% of returns)
37826:
$4,420
State:
$7,482
(% of AGI for various income ranges: 4.5% for AGIs below $10k, 3.9% for AGIs $10k-25k, 6.4% for AGIs $25k-50k, 8.8% for AGIs $50k-75k, 11.3% for AGIs $75k-100k, 14.9% for AGIs over 100k)
Earned income credit: $1,730 (reported on 21.2% of returns)
Here:
$1,730
State:
$1,826
Percentage of individuals using paid preparers for their 2004 taxes: 65.4%
Here:
65%
State:
60%
(% for various income ranges: 56.2% for AGIs below $10k, 69.8% for AGIs $10k-25k, 65.0% for AGIs $25k-50k, 66.2% for AGIs $50k-75k, 76.8% for AGIs $75k-100k, 68.9% for AGIs over 100k)
Likely homosexual households (counted as self-reported same-sex unmarried-partner households)
Lesbian couples: 0.2% of all households
Gay men: 0.0% of all households
Household received Food Stamps/SNAP in the past 12 months: 67 Household did not receive Food Stamps/SNAP in the past 12 months: 1,745
Women who had a birth in the past 12 months: 25 (26 now married, 0 unmarried) Women who did not have a birth in the past 12 months: 673 (398 now married, 275 unmarried)
Housing units in zip code 37826 with a mortgage: 622 (77 second mortgage, 57 both second mortgage and home equity loan) Median monthly owner costs for units with a mortgage: $1,245 Median monthly owner costs for units without a mortgage: $370
Residents with income below the poverty level in 2022:
This zip code:
3.9%
Whole state:
13.3%
Residents with income below 50% of the poverty level in 2022:
This zip code:
0.7%
Whole state:
7.1%
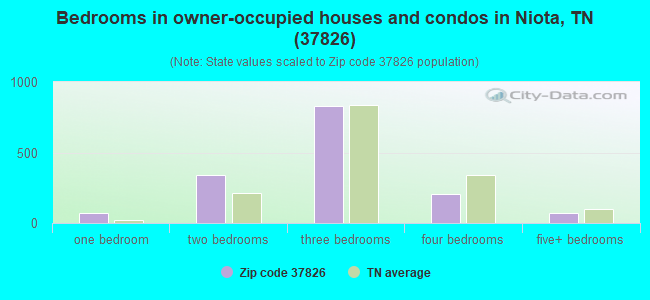
Median number of rooms in houses and condos:
Here:
6.2
State:
6.5
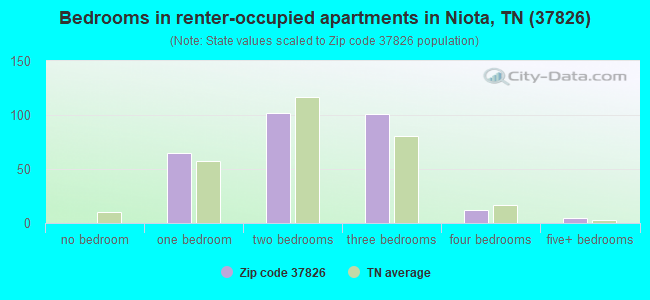
Median number of rooms in apartments:
Here:
5.2
State:
4.4
Notable locations in this zip code not listed on our city pages
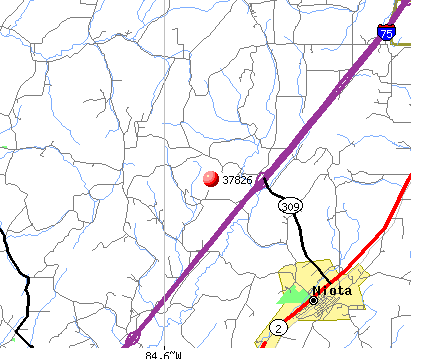
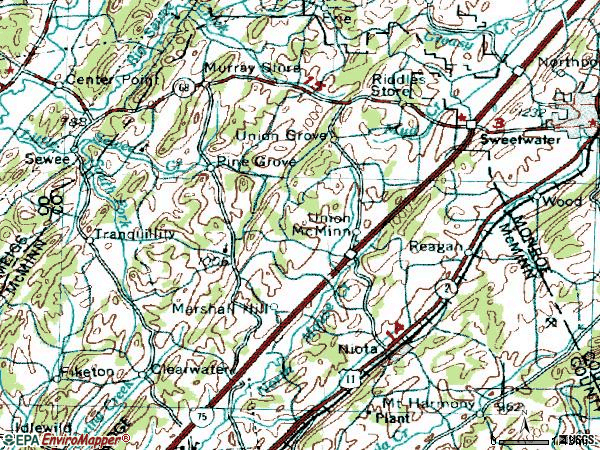
Notable locations in zip code 37826: Springbrook Golf and Country Club (A), Niota Volunteer Fire Department (B), Niota Public Library (C), Niota City Hall (D), McMinn County District 9 Union Grove Rural Fire Department (E). Display/hide their locations on the map
Churches in zip code 37826 include: East Niota Baptist Church (A), Niota United Methodist Church (B), Pond Hill Church (C), Rockview Church (D), Union Grove Baptist Church (E), Mount Harmony Baptist Church (F), Lanetown Church (G), Community Church (H), Union McMinn Church (I). Display/hide their locations on the map
Cemeteries: Isbell Cemetery (1), Union McMinn Baptist Church Cemetery (2), Pond Hill Cemetery (3), Niota Cemetery (4), Mount Pisgah Baptist Church Cemetery (5), Mount Harmony Baptist Church Cemetery (6), Beulah Chapel Cemetery (7). Display/hide their locations on the map
Streams, rivers, and creeks: Lathan Spring Branch (A), Kyker Branch (B), Frog Branch (C), Foster Branch (D), East Fork North Mouse Creek (E), Collins Branch (F), Bivins Branch (G). Display/hide their locations on the map
Size of family households: 848 2-persons, 231 3-persons, 208 4-persons, 95 5-persons, 11 6-persons, 4 7-or-more-persons
Size of nonfamily households: 332 1-person, 72 2-persons
350 married couples with children.
177 single-parent households (171 men, 6 women).
97.4% of residents of 37826 zip code speak English at home.
1.0% of residents speak Spanish at home (5% very well, 15% well, 79% not well).
1.1% of residents speak other Indo-European language at home (68% very well, 18% well, 9% not well, 5% not at all).
0.5% of residents speak Asian or Pacific Island language at home (100% very well).
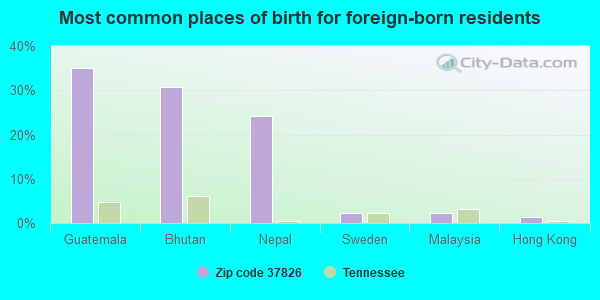
Foreign born population: 137 (3.4%) (54.9% of them are naturalized citizens)
This zip code:
3.4%
Whole state:
5.6%
35%Guatemala
31%Bhutan
24%Nepal
2%Sweden
2%Malaysia
1%Hong Kong
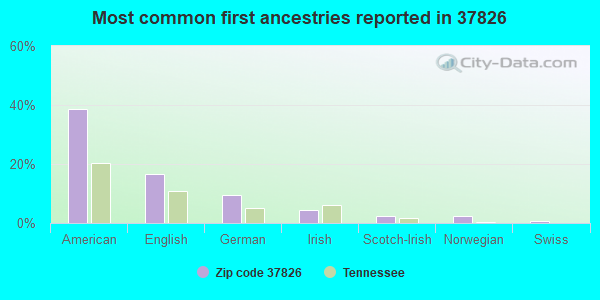
39%American
17%English
9%German
4%Irish
2%Scotch-Irish
2%Norwegian
1%Swiss
Year of entry for the foreign-born population
972010 or later
292000 to 2009
61990 to 1999
15Before 1990
Facilities with environmental interests located in this zip code:
CRESCENT HOSIERY MILLS (U S HWY 11 W in NIOTA, TN)
(Resource Conservation and Recovery Act (tracking hazardous waste)) Business NAICS classification: OTHER HOSIERY AND SOCK MILLS.
Housing units lacking complete plumbing facilities: 2.0% Housing units lacking complete kitchen facilities: 1.9%
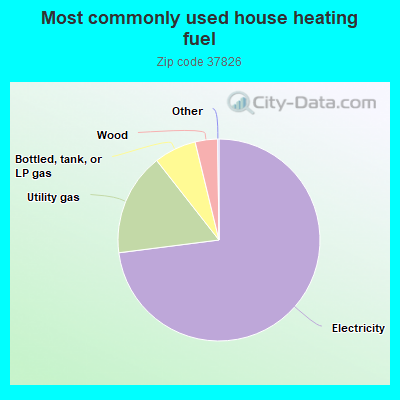
73.2%Electricity
16.5%Utility gas
6.8%Bottled, tank, or LP gas
3.6%Wood
Population in 1990: 2,182. Population change in the 1990s: +1,425 (+65.3%).
Place of birth for U.S.-born residents:
This state: 2,651
Northeast: 264
Midwest: 313
South: 520
West: 130
59% of the 37826 zip code residents lived in the same house 5 years ago. Out of people who lived in different houses, 56% lived in this county. Out of people who lived in different counties, 50% lived in Tennessee.
88% of the 37826 zip code residents lived in the same house 1 year ago. Out of people who lived in different houses, 31% moved from this county. Out of people who lived in different houses, 38% moved from different county within same state. Out of people who lived in different houses, 26% moved from different state. Out of people who lived in different houses, 8% moved from abroad.
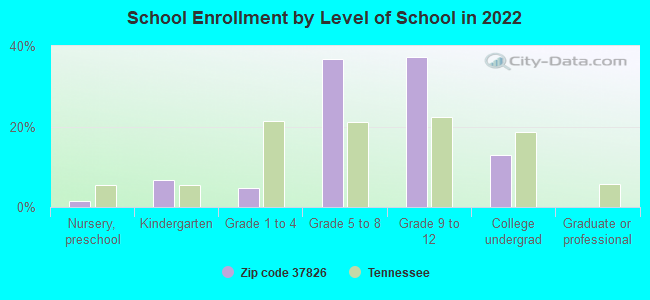
Private vs. public school enrollment:
Students in private schools in grades 1 to 8 (elementary and middle school): 8
Here:
3.2%
Tennessee:
15.0%
Students in private schools in grades 9 to 12 (high school): 24
Here:
9.6%
Tennessee:
16.2%
Students in private undergraduate colleges: 1
Here:
2.1%
Tennessee:
23.5%
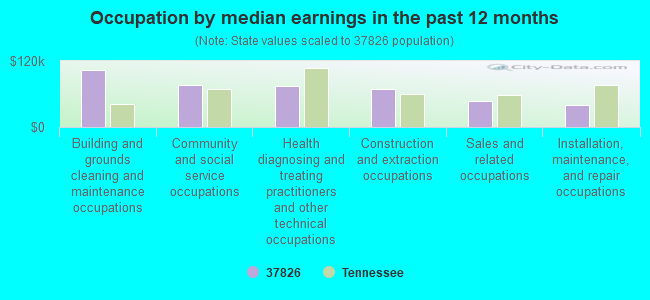
Occupation by median earnings in the past 12 months ($)
103,892Building and grounds cleaning and maintenance occupations
76,130Community and social service occupations
74,978Health diagnosing and treating practitioners and other technical occupations
69,583Construction and extraction occupations
47,767Sales and related occupations
40,563Installation, maintenance, and repair occupations
Companies with federal contracts located in this zip code:
CRESCENT HOSIERY MILLS, INC (1902 HIGHWAY 11 N in NIOTA, TN; small business) : $130,206 in 2 contractsin 2002
$130,208 with Army for Footwear, Men's. Signed on 2002-02-07. Completion date: 2002-04-09.
-$2, same as above.Signed on 2002-03-11. Completion date: 2002-04-09.
Top industries in this zip code by the number of employees in 2005:
Construction: Commercial and Institutional Building Construction (20-49 employees: 1 establishment, 5-9 employees: 1 establishment)
Arts, Entertainment, and Recreation: Golf Courses and Country Clubs (20-49: 1)
Wholesale Trade: Other Chemical and Allied Products Merchant Wholesalers (10-19: 1)
Other Services (except Public Administration): Religious Organizations (1-4: 6)
Construction: New Single-Family Housing Construction (except Operative Builders) (5-9: 1, 1-4: 1)
Fatal accident statistics in 2014:
Fatal accident count: 3
Vehicles involved in fatal accidents: 4
Fatal accidents caused by drunken drivers: 2
Fatalities: 3
Persons involved in fatal accidents: 4
Pedestrians involved in fatal accidents: 0
Fatal accident statistics in 2012:
Fatal accident count: 2
Vehicles involved in fatal accidents: 2
Fatal accidents caused by drunken drivers: 2
Fatalities: 2
Persons involved in fatal accidents: 2
Pedestrians involved in fatal accidents: 0
2002 - 2018 National Fire Incident Reporting System (NFIRS) incidents
Based on the data from the years 2002 - 2018 the average number of fire incidents per year is 48. The highest number of fire incidents - 103 took place in 2010, and the least - 22 in 2002. The data has a growing trend.
When looking into fire subcategories, the most incidents belonged to: Structure Fires (39.3%), and Outside Fires (38.0%).
Fire incident types reported to NFIRS in Zip Code 37826
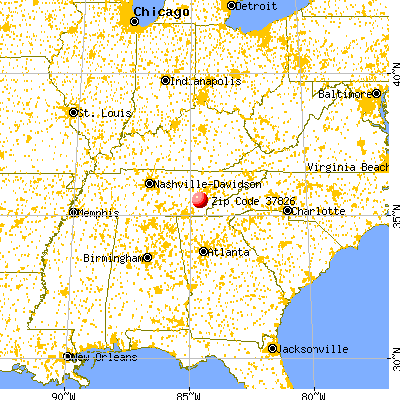


 Nearest zip codes: 37303, 37874, 37880, 37846, 37329, 37370.
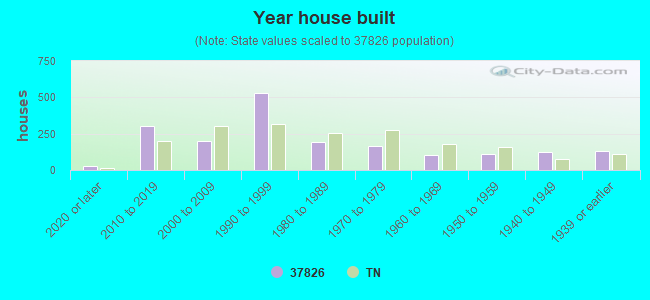


 Based on the data from the years 2002 - 2018 the average number of fire incidents per year is 48. The highest number of fire incidents - 103 took place in 2010, and the least - 22 in 2002. The data has a growing trend.
 When looking into fire subcategories, the most incidents belonged to: Structure Fires (39.3%), and Outside Fires (38.0%).