Estimated zip code population in 2022: 20,076 Zip code population in 2010: 18,321 Zip code population in 2000: 14,549
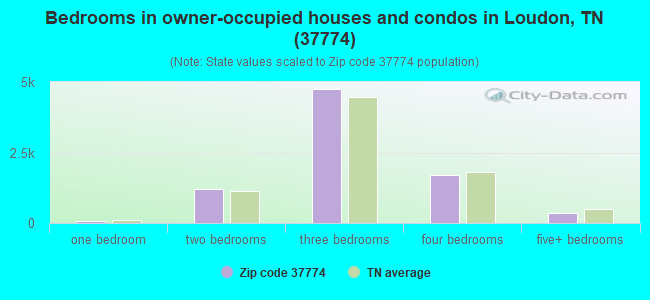
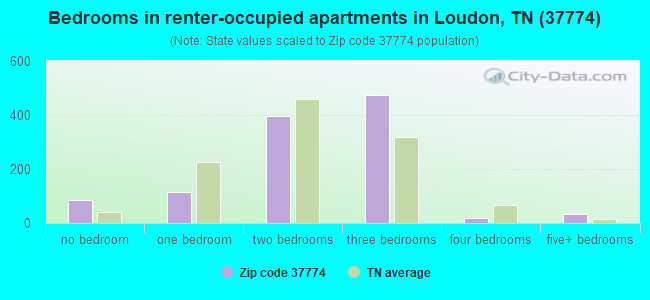
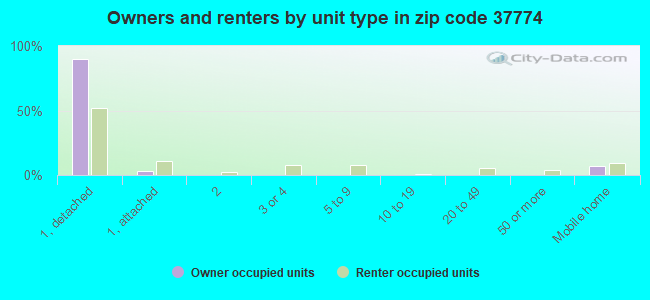
Houses and condos: 9,942 Renter-occupied apartments: 1,129
% of renters here:
12%
State:
33%
March 2022 cost of living index in zip code 37774: 86.0 (less than average, U.S. average is 100)
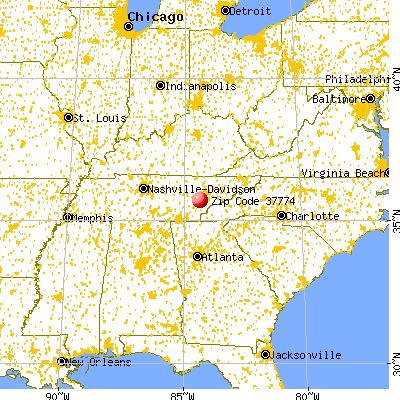
Land area: 87.4 sq. mi. Water area: 7.2 sq. mi.
Population density: 230 people per square mile
(very low).
OSM Map
General Map
Google Map
MSN Map
OSM Map
General Map
Google Map
MSN Map
OSM Map
General Map
Google Map
MSN Map
OSM Map
General Map
Google Map
MSN Map
Please wait while loading the map...
Real estate property taxes paid for housing units in 2022:
This zip code:
0.4% ($1,274)
Tennessee:
0.5% ($1,376)
Median real estate property taxes paid for housing units with mortgages in 2022: $1,206 (0.4%) Median real estate property taxes paid for housing units with no mortgage in 2022: $1,369 (0.3%)
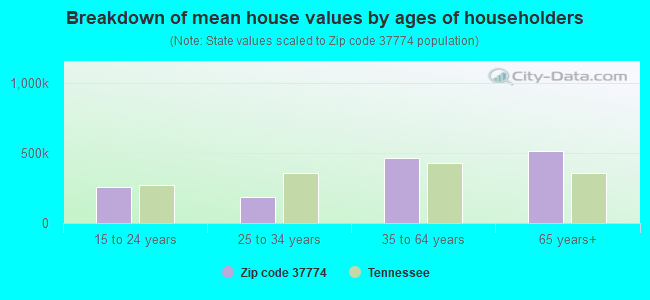
Estimated median house/condo value in 2022: $348,239
37774:
$348,239
Tennessee:
$284,800
According to our research of Tennessee and other state lists, there were 34 registered sex offenders living in 37774 zip code as of April 26, 2024. The ratio of all residents to sex offenders in zip code 37774 is 556 to 1. The ratio of registered sex offenders to all residents in this zip code is lower than the state average.
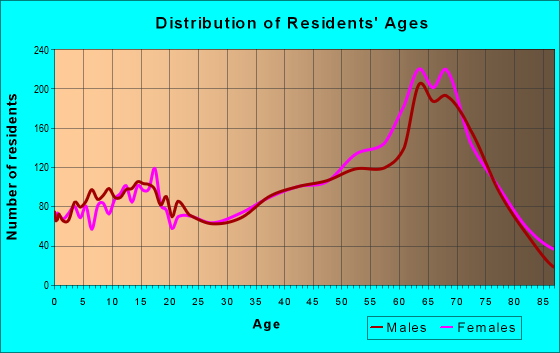
Median resident age:
This zip code:
59.0 years
Tennessee median age:
39.2 years
Average household size:
This zip code:
2.2 people
Tennessee:
2.4 people
Averages for the 2020 tax year for zip code 37774, filed in 2021:
Average Adjusted Gross Income (AGI) in 2020: $85,563 (Individual Income Tax Returns)
Here:
$85,563
State:
$69,014
Salary/wage: $59,630 (reported on 64.9% of returns)
Here:
$59,630
State:
$55,872
(% of AGI for various income ranges: 1029.0% for AGIs below $25k, 3002.2% for AGIs $25k-50k, 4841.9% for AGIs $50k-75k, 6457.5% for AGIs $75k-100k, 9968.2% for AGIs $100k-200k, 55642.2% for AGIs over 200k)
Taxable interest for individuals: $2,316 (reported on 45.3% of returns)
This zip code:
$2,316
Tennessee:
$1,945
(% of AGI for various income ranges: 27.7% for AGIs below $25k, 44.3% for AGIs $25k-50k, 94.5% for AGIs $50k-75k, 149.0% for AGIs $75k-100k, 343.0% for AGIs $100k-200k, 1709.6% for AGIs over 200k)
Ordinary dividends: $10,832 (reported on 31.2% of returns)
Here:
$10,832
State:
$8,105
(% of AGI for various income ranges: 51.9% for AGIs below $25k, 95.0% for AGIs $25k-50k, 201.9% for AGIs $50k-75k, 412.3% for AGIs $75k-100k, 1022.2% for AGIs $100k-200k, 7328.3% for AGIs over 200k)
Net capital gain/loss in AGI: +$19,798 (reported on 29.9% of returns)
Here:
+$19,798
State:
+$33,664
(% of AGI for various income ranges: 9.0% for AGIs below $25k, 55.0% for AGIs $25k-50k, 163.8% for AGIs $50k-75k, 295.6% for AGIs $75k-100k, 1116.7% for AGIs $100k-200k, 20186.1% for AGIs over 200k)
Profit/loss from business: +$19,580 (reported on 13.2% of returns)
Here:
+$19,580
State:
+$18,991
(% of AGI for various income ranges: 126.0% for AGIs below $25k, 149.6% for AGIs $25k-50k, 218.2% for AGIs $50k-75k, 239.6% for AGIs $75k-100k, 642.6% for AGIs $100k-200k, 4890.9% for AGIs over 200k)
Taxable individual retirement arrangement distribution: $35,738 (reported on 23.7% of returns)
37774:
$35,738
Tennessee:
$20,036
(% of AGI for various income ranges: 112.8% for AGIs below $25k, 267.8% for AGIs $25k-50k, 608.4% for AGIs $50k-75k, 1195.1% for AGIs $75k-100k, 3248.2% for AGIs $100k-200k, 13779.1% for AGIs over 200k)
Self-employed (Keogh) retirement plans: $23,350 (reported on 0.6% of returns)
37774:
$23,350
Tennessee:
$28,955
(% of AGI for various income ranges: 29.6% for AGIs $100k-200k, 461.3% for AGIs over 200k)
Total itemized deductions: $39,122 (reported on 7.9% of returns)
Here:
$39,122
State:
$40,136
(% of AGI for various income ranges: 61.3% for AGIs below $25k, 116.0% for AGIs $25k-50k, 249.6% for AGIs $50k-75k, 368.1% for AGIs $75k-100k, 906.3% for AGIs $100k-200k, 6202.2% for AGIs over 200k)
Charity contributions: $16,096 (reported on 6.9% of returns)
Here:
$16,096
State:
$19,852
(% of AGI for various income ranges: 4.5% for AGIs below $25k, 16.1% for AGIs $25k-50k, 49.3% for AGIs $50k-75k, 74.1% for AGIs $75k-100k, 272.4% for AGIs $100k-200k, 3235.7% for AGIs over 200k)
Taxes paid: $6,312 (reported on 7.6% of returns)
37774:
$6,312
State:
$6,038
(% of AGI for various income ranges: 5.6% for AGIs below $25k, 14.5% for AGIs $25k-50k, 34.3% for AGIs $50k-75k, 62.5% for AGIs $75k-100k, 164.8% for AGIs $100k-200k, 914.3% for AGIs over 200k)
Earned income credit: $2,336 (reported on 11.0% of returns)
Here:
$2,336
State:
$2,391
(% of AGI for various income ranges: 80.6% for AGIs below $25k, 62.2% for AGIs $25k-50k)
Percentage of individuals using paid preparers for their 2020 taxes: 92.4%
Here:
92%
State:
93%
(% for various income ranges: 91.8% for AGIs below $25k, 95.3% for AGIs $25k-50k, 92.9% for AGIs $50k-75k, 92.0% for AGIs $75k-100k, 90.0% for AGIs $100k-200k, 92.4% for AGIs over 200k)
Averages for the 2012 tax year for zip code 37774, filed in 2013:
Average Adjusted Gross Income (AGI) in 2012: $65,057 (Individual Income Tax Returns)
Here:
$65,057
State:
$53,767
Salary/wage: $45,807 (reported on 69.9% of returns)
Here:
$45,807
State:
$45,421
(% of AGI for various income ranges: 68.4% for AGIs below $25k, 67.0% for AGIs $25k-50k, 56.7% for AGIs $50k-75k, 42.3% for AGIs $75k-100k, 39.3% for AGIs $100k-200k, 46.7% for AGIs over 200k)
Taxable interest for individuals: $2,177 (reported on 41.0% of returns)
This zip code:
$2,177
Tennessee:
$1,732
(% of AGI for various income ranges: 1.7% for AGIs below $25k, 0.9% for AGIs $25k-50k, 1.4% for AGIs $50k-75k, 1.2% for AGIs $75k-100k, 1.5% for AGIs $100k-200k, 1.6% for AGIs over 200k)
Ordinary dividends: $8,789 (reported on 28.9% of returns)
Here:
$8,789
State:
$6,739
(% of AGI for various income ranges: 2.2% for AGIs below $25k, 1.7% for AGIs $25k-50k, 2.7% for AGIs $50k-75k, 3.2% for AGIs $75k-100k, 4.1% for AGIs $100k-200k, 6.6% for AGIs over 200k)
Net capital gain/loss in AGI: +$8,601 (reported on 25.5% of returns)
Here:
+$8,601
State:
+$19,082
(% of AGI for various income ranges: 0.2% for AGIs $25k-50k, 0.4% for AGIs $50k-75k, 0.8% for AGIs $75k-100k, 2.1% for AGIs $100k-200k, 11.3% for AGIs over 200k)
Profit/loss from business: +$15,203 (reported on 13.1% of returns)
Here:
+$15,203
State:
+$15,240
(% of AGI for various income ranges: 8.5% for AGIs below $25k, 2.2% for AGIs $25k-50k, 2.2% for AGIs $50k-75k, 1.8% for AGIs $75k-100k, 2.5% for AGIs $100k-200k, 4.0% for AGIs over 200k)
Taxable individual retirement arrangement distribution: $26,168 (reported on 24.7% of returns)
37774:
$26,168
Tennessee:
$15,505
(% of AGI for various income ranges: 5.7% for AGIs below $25k, 6.6% for AGIs $25k-50k, 7.7% for AGIs $50k-75k, 10.8% for AGIs $75k-100k, 13.5% for AGIs $100k-200k, 9.2% for AGIs over 200k)
Self-employment retirement plans: $15,480 (reported on 0.6% of returns)
37774:
$15,480
Tennessee:
$22,567
Total itemized deductions: $23,680 (20% of AGI, reported on 29.5% of returns)
Here:
$23,680
State:
$21,976
Here:
20.2% of AGI
State:
17.8% of AGI
(% of AGI for various income ranges: 10.3% for AGIs below $25k, 10.2% for AGIs $25k-50k, 10.7% for AGIs $50k-75k, 11.8% for AGIs $75k-100k, 12.3% for AGIs $100k-200k, 8.6% for AGIs over 200k)
Charity contributions: $5,484 (reported on 25.9% of returns)
Here:
$5,484
State:
$6,709
(% of AGI for various income ranges: 0.9% for AGIs below $25k, 1.2% for AGIs $25k-50k, 1.8% for AGIs $50k-75k, 2.3% for AGIs $75k-100k, 2.9% for AGIs $100k-200k, 2.4% for AGIs over 200k)
Taxes paid: $5,640 (reported on 29.4% of returns)
37774:
$5,640
State:
$4,829
(% of AGI for various income ranges: 1.3% for AGIs below $25k, 1.6% for AGIs $25k-50k, 2.0% for AGIs $50k-75k, 2.5% for AGIs $75k-100k, 3.2% for AGIs $100k-200k, 2.9% for AGIs over 200k)
Earned income credit: $2,248 (reported on 16.3% of returns)
Here:
$2,248
State:
$2,404
(% of AGI for various income ranges: 6.4% for AGIs below $25k, 1.1% for AGIs $25k-50k)
Percentage of individuals using paid preparers for their 2012 taxes: 51.1%
Here:
51%
State:
52%
(% for various income ranges: 45.5% for AGIs below $25k, 52.3% for AGIs $25k-50k, 55.4% for AGIs $50k-75k, 52.5% for AGIs $75k-100k, 53.2% for AGIs $100k-200k, 66.7% for AGIs over 200k)
Averages for the 2004 tax year for zip code 37774, filed in 2005:
Average Adjusted Gross Income (AGI) in 2004: $55,077 (Individual Income Tax Returns)
Here:
$55,077
State:
$44,088
Salary/wage: $40,602 (reported on 75.2% of returns)
Here:
$40,602
State:
$38,825
(% of AGI for various income ranges: 93.8% for AGIs below $10k, 67.2% for AGIs $10k-25k, 67.4% for AGIs $25k-50k, 58.4% for AGIs $50k-75k, 51.3% for AGIs $75k-100k, 48.0% for AGIs over 100k)
Taxable interest for individuals: $2,236 (reported on 52.3% of returns)
This zip code:
$2,236
Tennessee:
$1,802
(% of AGI for various income ranges: 6.0% for AGIs below $10k, 4.0% for AGIs $10k-25k, 2.3% for AGIs $25k-50k, 1.7% for AGIs $50k-75k, 2.2% for AGIs $75k-100k, 1.8% for AGIs over 100k)
Taxable dividends: $5,301 (reported on 31.8% of returns)
Here:
$5,301
State:
$3,727
(% of AGI for various income ranges: 4.2% for AGIs below $10k, 2.3% for AGIs $10k-25k, 2.0% for AGIs $25k-50k, 2.0% for AGIs $50k-75k, 2.9% for AGIs $75k-100k, 4.1% for AGIs over 100k)
Net capital gain/loss: +$9,295 (reported on 27.8% of returns)
Here:
+$9,295
State:
+$15,776
(% of AGI for various income ranges: -1.2% for AGIs below $10k, 0.3% for AGIs $10k-25k, 0.5% for AGIs $25k-50k, 1.8% for AGIs $50k-75k, 1.8% for AGIs $75k-100k, 9.6% for AGIs over 100k)
Profit/loss from business: +$13,641 (reported on 16.3% of returns)
Here:
+$13,641
State:
+$12,882
(% of AGI for various income ranges: 5.2% for AGIs below $10k, 5.7% for AGIs $10k-25k, 3.4% for AGIs $25k-50k, 2.5% for AGIs $50k-75k, 2.4% for AGIs $75k-100k, 5.3% for AGIs over 100k)
IRA payment deduction: $3,320 (reported on 2.7% of returns)
37774:
$3,320
Tennessee:
$2,934
(% of AGI for various income ranges: 0.1% for AGIs $10k-25k, 0.2% for AGIs $25k-50k, 0.3% for AGIs $50k-75k, 0.1% for AGIs $75k-100k, 0.1% for AGIs over 100k)
Self-employed pension: $18,029 (reported on 0.9% of returns)
Here:
$18,029
Tennessee:
$16,857
(% of AGI for various income ranges: 0.2% for AGIs $50k-75k, 0.2% for AGIs $75k-100k, 0.6% for AGIs over 100k)
Total itemized deductions: $20,347 (21% of AGI, reported on 30.8% of returns)
Here:
$20,347
State:
$18,035
Here:
20.9% of AGI
State:
19.9% of AGI
(% of AGI for various income ranges: 20.5% for AGIs below $10k, 11.3% for AGIs $10k-25k, 11.0% for AGIs $25k-50k, 11.3% for AGIs $50k-75k, 12.5% for AGIs $75k-100k, 11.0% for AGIs over 100k)
Charity contributions deductions: $4,778 (5% of AGI, reported on 27.3% of returns)
Here:
$4,778
State:
$5,167
Here:
4.7% of AGI
State:
5.3% of AGI
(% of AGI for various income ranges: 0.9% for AGIs below $10k, 1.3% for AGIs $10k-25k, 1.5% for AGIs $25k-50k, 1.9% for AGIs $50k-75k, 2.5% for AGIs $75k-100k, 3.1% for AGIs over 100k)
Total tax: $8,577 (reported on 79.8% of returns)
37774:
$8,577
State:
$7,482
(% of AGI for various income ranges: 3.9% for AGIs below $10k, 3.9% for AGIs $10k-25k, 6.3% for AGIs $25k-50k, 8.7% for AGIs $50k-75k, 10.9% for AGIs $75k-100k, 18.7% for AGIs over 100k)
Earned income credit: $1,760 (reported on 13.4% of returns)
Here:
$1,760
State:
$1,826
Percentage of individuals using paid preparers for their 2004 taxes: 58.4%
Here:
58%
State:
60%
(% for various income ranges: 56.9% for AGIs below $10k, 61.2% for AGIs $10k-25k, 59.5% for AGIs $25k-50k, 56.8% for AGIs $50k-75k, 55.0% for AGIs $75k-100k, 58.3% for AGIs over 100k)
Likely homosexual households (counted as self-reported same-sex unmarried-partner households)
Lesbian couples: 0.1% of all households
Gay men: 0.0% of all households
Household received Food Stamps/SNAP in the past 12 months: 336 Household did not receive Food Stamps/SNAP in the past 12 months: 8,911
Women who had a birth in the past 12 months: 135 (108 now married, 28 unmarried) Women who did not have a birth in the past 12 months: 2,438 (1,404 now married, 1,034 unmarried)
Housing units in zip code 37774 with a mortgage: 3,921 (397 second mortgage, 396 both second mortgage and home equity loan) Houses without a mortgage: 135
Median monthly owner costs for units with a mortgage: $1,412 Median monthly owner costs for units without a mortgage: $438
Residents with income below the poverty level in 2022:
This zip code:
8.9%
Whole state:
13.3%
Residents with income below 50% of the poverty level in 2022:
This zip code:
5.7%
Whole state:
7.1%
Median number of rooms in houses and condos:
Here:
6.3
State:
6.5
Median number of rooms in apartments:
Here:
4.5
State:
4.4
Notable locations in this zip code not listed on our city pages
Notable locations in zip code 37774: Blair Bend Industrial Park (A), Matlock Bend Industrial Park (B), Russell Store (C), Loudon City Fire and Police Station 1 (D), Loudon County Fire Rescue Station 4 (E), Loudon City Hall (F), Loudon County Courthouse (G), Carmichael Inn Museum (H), Loudon City Fire and Police Station 2 (I), Cave Creek Community Center (J), East Roane County Volunteer Fire Department Station 2 Cave Creek (K), Tellico Village Volunteer Fire Department (L), Rural / Metro Ambulance Loudon County (M). Display/hide their locations on the map
Churches in zip code 37774 include: Prospect Baptist Church (A), Poplar Springs Baptist Church (B), New Providence Baptist Church (C), Mount Olive Baptist Church (D), Loudon Church of the Nazarene (E), Loudon Cumberland Presbyterian Church (F), Loudon United Methodist Church (G), First Baptist Church (H), Stockton Valley Church (I). Display/hide their locations on the map
Cemeteries: Huff Cemetery (1), Jackson Cemetery (2), Watson Cemetery (3), Watts Cemetery (4), Wilson Cemetery (5), Marney Cemetery (6), Matlock Cemetery (7). Display/hide their locations on the map
Streams, rivers, and creeks: Hubbard Branch (A), Hotchkiss Creek (B), Hines Creek (C), Sweetwater Creek (D), Steekee Creek (E), Fork Creek (F), Dry Valley Branch (G), Clear Prong (H), Sinking Creek (I). Display/hide their locations on the map
Parks in zip code 37774 include: Clear Creek Recreation Area (1), Loudon Marine Park (2), Poplar Springs Recreation Area (3). Display/hide their locations on the map
In group quarters: 208 (-1 institutionalized population)
Size of family households: 4,728 2-persons, 806 3-persons, 395 4-persons, 447 5-persons, 84 6-persons, 52 7-or-more-persons
Size of nonfamily households: 2,358 1-person, 311 2-persons, 9 3-persons
2,026 married couples with children.
465 single-parent households (296 men, 169 women).
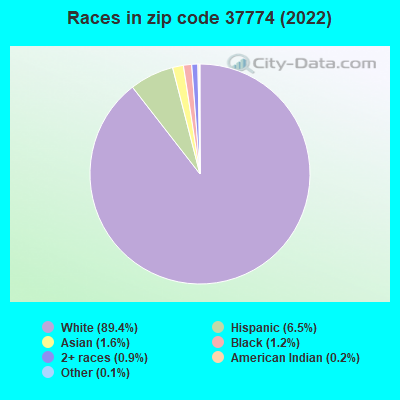
94.2% of residents of 37774 zip code speak English at home.
5.9% of residents speak Spanish at home (40% very well, 22% well, 23% not well, 16% not at all).
0.7% of residents speak other Indo-European language at home (71% very well, 28% well, 1% not well).
0.2% of residents speak Asian or Pacific Island language at home (100% very well).
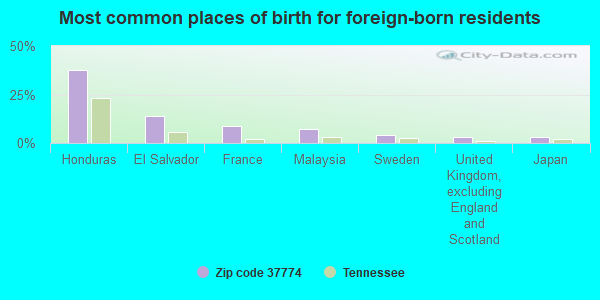
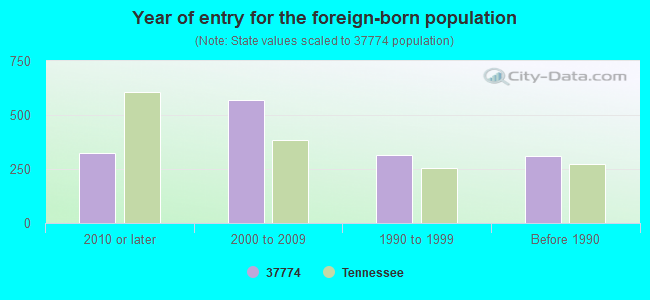
Foreign born population: 1,365 (6.8%) (44.0% of them are naturalized citizens)
This zip code:
6.8%
Whole state:
5.6%
38%Honduras
14%El Salvador
9%France
7%Malaysia
4%Sweden
3%United Kingdom, excluding England and Scotland
3%Japan
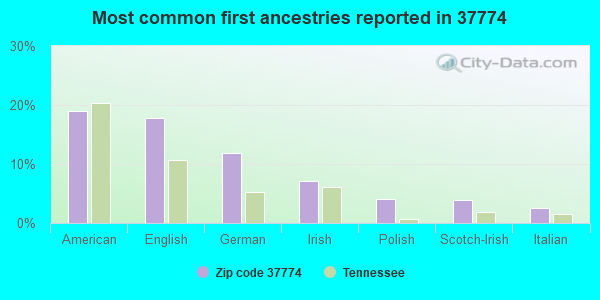
19%American
18%English
12%German
7%Irish
4%Polish
4%Scotch-Irish
3%Italian
Year of entry for the foreign-born population
3242010 or later
5712000 to 2009
3141990 to 1999
308Before 1990
Facilities with environmental interests located in this zip code:
A E STALEY MANUFACTURING COMPANY (198 BLAIR BEND DRIVE in LOUDON, TN)
AIR MAJOR (AIRS/AFS) AIR PROGRAM (Clean Air Markets Division Business System) CRITERIA AND HAZARDOUS AIR POLLUTANT INVENTORY (Inventory of air pollution sources) National Pollutant Discharge Elimination System NON-MAJOR (Tracking pollutant discharge elimination systems) - permit National Pollutant Discharge Elimination System NON-MAJOR (Tracking pollutant discharge elimination systems) - permit AIR MAJOR ("Best Available" air pollution technologies tracking) (Resource Conservation and Recovery Act (tracking hazardous waste)) TRI REPORTER (Tracking of toxic chemicals releasing facilities) Business SIC classification: WET CORN MILLING; INDUSTRIAL ORGANIC CHEMICALS; PIPELINES Business NAICS classification: WET CORN MILLING.; WET CORN MILLING. Organizations: TATE & LYLE, LOUDON (CONTACT/OPERATOR)
, DUPONT TATE & LYLE BIO PRODUCT (CONTACT/OPERATOR)
, TATE & LYLE INGREDIENTS AMERICAS, INC. (CONTACT/OWNER)
, JOHN HALBERSTADT (CONTACT/OWNER)
Alternative names: A. E. STALEY MANUFACTURING CO LOUDON FAC, A E STALEY MANUFACTURING CO (TN), A.E. STALEY MANUFACTURING, A.E. STALEY MANUFACTURING CO., DUPONT TATE & LYLE BIO PRODUCT, JOHN HALBERSTADT, TATE & LYLE LOUDON
ALERIS INTERNATIONAL INC (388 WILLIAMSON DR. in LOUDON, TN)
AIR SYNTHETIC MINOR (AIRS/AFS) - ICIS-, ENFORCEMENT/COMPLIANCE ACTIVITY TSD (Resource Conservation and Recovery Act (tracking hazardous waste)) TRI REPORTER (Tracking of toxic chemicals releasing facilities) Business SIC classification: SECONDARY SMELTING AND REFINING OF NONFERROUS METALS Alternative names: IMCO RECYCLING OF LOUDON, IT CORP.
DON P SMITH CHAIR CO INC (425-30 MAIN STREET in LOUDON, TN)
AIR SYNTHETIC MINOR (AIRS/AFS) CRITERIA AND HAZARDOUS AIR POLLUTANT INVENTORY (Inventory of air pollution sources) (Resource Conservation and Recovery Act (tracking hazardous waste)) Small Quantity Generators, between 100 kg and 1000 kg of hazardous waste/month (Resource Conservation and Recovery Act (tracking hazardous waste)) - notification TRI REPORTER (Tracking of toxic chemicals releasing facilities) Business SIC classification: WOOD HOUSEHOLD FURNITURE, EXCEPT UPHOLSTERED; HOUSEHOLD FURNITURE Business NAICS classification: NONUPHOLSTERED WOOD HOUSEHOLD FURNITURE MANUFACTURING.; NONUPHOLSTERED WOOD HOUSEHOLD FURNITURE MANUFACTURING. Alternative names: SMITH DON P CHAIR CO*
CARE INN OF LOUDON (PO BOX 190 in LOUDON, TN)
(Resource Conservation and Recovery Act (tracking hazardous waste))
CASTEEL PRINTERS (RURAL RT 4 in LOUDON, TN)
(Resource Conservation and Recovery Act (tracking hazardous waste)) Business NAICS classification: COMMERCIAL LITHOGRAPHIC PRINTING.
CRYST-A-BLEACH COMPANY (ROUTE 4 WATSON RD in LOUDON, TN)
COMPLIANCE ACTIVITY (Tracking inspections of insecticide, fungicide, and rodenticide, and toxic substances)
CHEESTANA WAY PESTICIDE RELEASE (348 CHEESTANA WAY in LOUDON, TN)
SUPERFUND (Superfund database) Alternative names: 348 CHEESTANA WAY PESTICIDE SPILL
DON P SMITH CHAIR COMPANY, INC. (NATATLIE BLVD. in LOUDON, TN)
AIR SYNTHETIC MINOR (AIRS/AFS)
Housing units lacking complete plumbing facilities: 0.9% Housing units lacking complete kitchen facilities: 1.8%
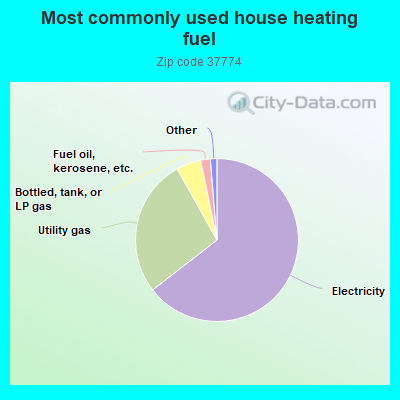
64.5%Electricity
27.4%Utility gas
4.9%Bottled, tank, or LP gas
1.9%Fuel oil, kerosene, etc.
0.8%Wood
0.6%Other fuel
Population in 1990: 11,116. Population change in the 1990s: +3,433 (+30.9%).
Place of birth for U.S.-born residents:
This state: 9,134
Northeast: 1,687
Midwest: 4,622
South: 2,394
West: 719
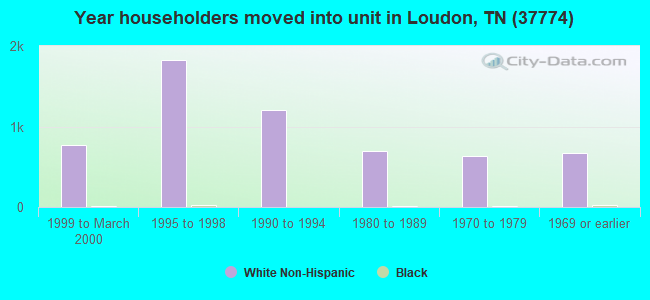
59% of the 37774 zip code residents lived in the same house 5 years ago. Out of people who lived in different houses, 36% lived in this county. Out of people who lived in different counties, 50% lived in Tennessee.
95% of the 37774 zip code residents lived in the same house 1 year ago. Out of people who lived in different houses, 40% moved from this county. Out of people who lived in different houses, 45% moved from different county within same state. Out of people who lived in different houses, 19% moved from different state. Out of people who lived in different houses, 5% moved from abroad.
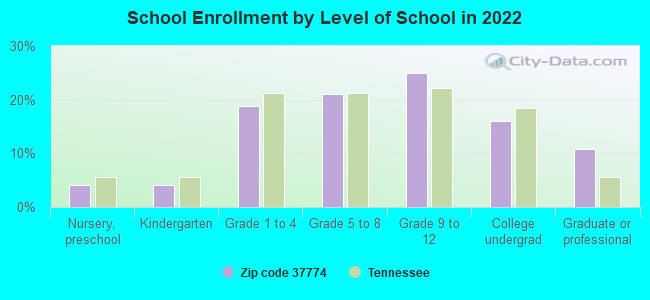
Private vs. public school enrollment:
Students in private schools in grades 1 to 8 (elementary and middle school): 41
Here:
3.7%
Tennessee:
15.0%
Students in private schools in grades 9 to 12 (high school): 132
Here:
18.5%
Tennessee:
16.2%
Students in private undergraduate colleges: 56
Here:
12.3%
Tennessee:
23.5%
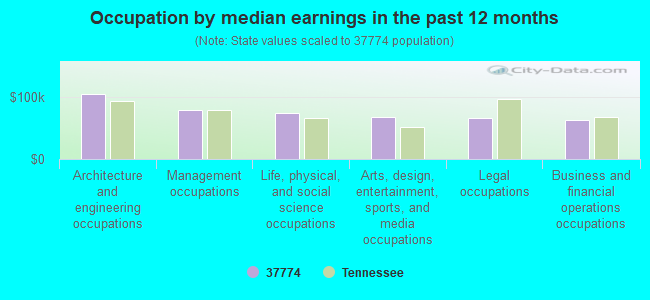
Occupation by median earnings in the past 12 months ($)
105,205Architecture and engineering occupations
79,557Management occupations
74,614Life, physical, and social science occupations
67,824Arts, design, entertainment, sports, and media occupations
65,915Legal occupations
62,549Business and financial operations occupations
Companies with federal contracts located in this zip code:
DEFIANCE ELECTRONICS INC (155B NATALIE BLVD in LOUDON, TN; small business) : $1,253,968 in 20 contractsfrom 2001 to 2006
Contracts for Dental Instruments, Equipment, and Supplies, Hospital Furniture, Equipment, Utensils, and Supplies, Dependent Medicare Services, Electronic Modules, and moreby Defense Logistics Agency, Department of Veterans Affairs, Army, Navy, and others Signed by year:2000: $0; 2001: $122,687; 2002: $81,222; 2003: $347,290; 2004: $502,216; 2005: $146,733; 2006: $53,820.
Biggest contracts:
$338,250 with Defense Logistics Agency for Dental Instruments, Equipment, and Supplies. Signed on 2004-12-28. Completion date: 2005-06-30.
$163,725 with Department of Veterans Affairs for Hospital Furniture, Equipment, Utensils, and Supplies. Signed on 2003-02-15. Completion date: 2003-03-15.
$119,600 with Army for Dental Instruments, Equipment, and Supplies. Signed on 2005-02-23. Completion date: 2005-02-18.
$81,346 with Navy for Dependent Medicare Services. Taking place in VA. Signed on 2003-10-01. Completion date: 2005-09-30.
BRAKEBILL, WILLIAM JR DDS (705 MULBERRY ST in LOUDON, TN; small business) : $23,030 in 5 contractsfrom 2004 to 2005
Contracts for Dentistry Services by Army Signed by year:2000: $0; 2001: $0; 2002: $0; 2003: $0; 2004: $24,889; 2005: -$1,859; 2006: $0.
Biggest contracts:
$9,210 with Army for Dentistry Services. Signed on 2004-08-18. Completion date: 2004-08-27.
$8,226, same as above.Signed on 2004-06-30. Completion date: 2004-06-30.
$7,453, same as above.Signed on 2004-04-01. Completion date: 2004-04-02.
-$526, same as above.Signed on 2005-04-18. Completion date: 2004-04-02.
Top industries in this zip code by the number of employees in 2005:
Health Care and Social Assistance: Nursing Care Facilities (100-249 employees: 1 establishment)
People in group quarters in 2010:
202 people in nursing facilities/skilled-nursing facilities
54 people in group homes intended for adults
7 people in other noninstitutional facilities
2 people in hospitals with patients who have no usual home elsewhere
People in group quarters in 2000:
205 people in nursing homes
25 people in other noninstitutional group quarters
Fatal accident statistics in 2014:
Fatal accident count: 3
Vehicles involved in fatal accidents: 4
Fatal accidents caused by drunken drivers: 1
Fatalities: 3
Persons involved in fatal accidents: 4
Pedestrians involved in fatal accidents: 1
Fatal accident statistics in 2013:
Fatal accident count: 5
Vehicles involved in fatal accidents: 7
Fatal accidents caused by drunken drivers: 3
Fatalities: 5
Persons involved in fatal accidents: 10
Pedestrians involved in fatal accidents: 0
Home Mortgage Disclosure Act Aggregated Statistics For Year 2009 (Based on 12 partial tracts)
A) FHA, FSA/RHS & VA Home Purchase Loans
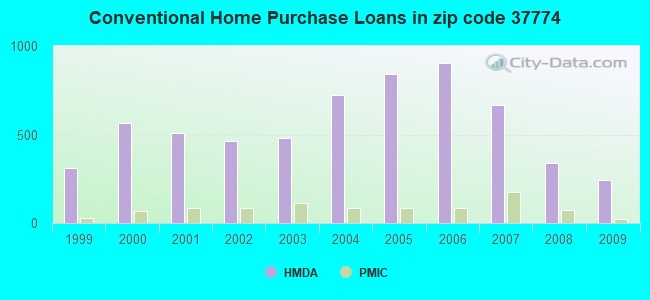
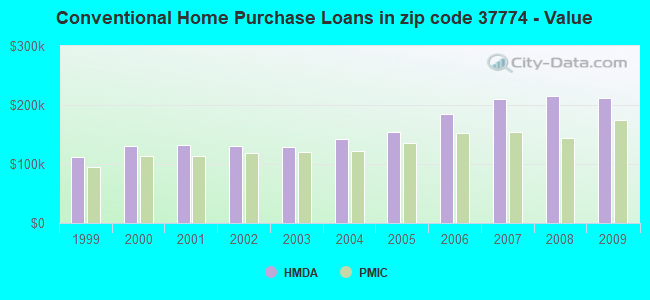
B) Conventional Home Purchase Loans
C) Refinancings
D) Home Improvement Loans
E) Loans on Dwellings For 5+ Families
F) Non-occupant Loans on < 5 Family Dwellings (A B C & D)
G) Loans On Manufactured Home Dwelling (A B C & D)
Number
Average Value
Number
Average Value
Number
Average Value
Number
Average Value
Number
Average Value
Number
Average Value
Number
Average Value
LOANS ORIGINATED
96
$129,614
241
$211,374
1,350
$193,683
73
$77,353
1
$308,160
157
$219,609
43
$56,582
APPLICATIONS APPROVED, NOT ACCEPTED
8
$76,275
14
$187,269
87
$183,482
3
$29,717
0
$0
7
$299,804
5
$103,104
APPLICATIONS DENIED
34
$101,074
34
$135,279
307
$204,553
48
$47,182
0
$0
26
$213,078
33
$59,237
APPLICATIONS WITHDRAWN
16
$131,872
38
$197,857
213
$187,965
9
$60,860
0
$0
17
$190,271
8
$83,986
FILES CLOSED FOR INCOMPLETENESS
4
$118,490
5
$431,946
51
$174,739
4
$13,735
0
$0
5
$254,922
2
$118,925
Aggregated Statistics For Year 2008 (Based on 12 partial tracts)
A) FHA, FSA/RHS & VA Home Purchase Loans
B) Conventional Home Purchase Loans
C) Refinancings
D) Home Improvement Loans
E) Loans on Dwellings For 5+ Families
F) Non-occupant Loans on < 5 Family Dwellings (A B C & D)
G) Loans On Manufactured Home Dwelling (A B C & D)
Number
Average Value
Number
Average Value
Number
Average Value
Number
Average Value
Number
Average Value
Number
Average Value
Number
Average Value
LOANS ORIGINATED
96
$116,293
337
$215,117
685
$177,339
94
$49,602
2
$130,620
178
$204,756
70
$71,760
APPLICATIONS APPROVED, NOT ACCEPTED
7
$117,691
43
$149,549
74
$163,594
17
$49,356
0
$0
13
$176,955
15
$58,269
APPLICATIONS DENIED
31
$104,684
79
$108,210
314
$151,353
85
$74,479
2
$3,004,260
35
$198,831
55
$77,720
APPLICATIONS WITHDRAWN
19
$119,234
50
$220,351
161
$162,626
20
$105,232
0
$0
23
$163,846
22
$76,206
FILES CLOSED FOR INCOMPLETENESS
3
$102,477
12
$211,886
36
$213,585
1
$78,350
0
$0
7
$278,010
1
$10,600
Aggregated Statistics For Year 2007 (Based on 12 partial tracts)
A) FHA, FSA/RHS & VA Home Purchase Loans
B) Conventional Home Purchase Loans
C) Refinancings
D) Home Improvement Loans
E) Loans on Dwellings For 5+ Families
F) Non-occupant Loans on < 5 Family Dwellings (A B C & D)
G) Loans On Manufactured Home Dwelling (A B C & D)
Number
Average Value
Number
Average Value
Number
Average Value
Number
Average Value
Number
Average Value
Number
Average Value
Number
Average Value
LOANS ORIGINATED
41
$126,444
667
$210,212
629
$162,290
118
$61,921
3
$268,513
225
$205,139
77
$62,678
APPLICATIONS APPROVED, NOT ACCEPTED
12
$84,527
99
$188,793
114
$174,236
17
$58,042
0
$0
18
$218,438
22
$63,101
APPLICATIONS DENIED
10
$107,102
137
$116,577
401
$128,075
124
$79,584
0
$0
35
$141,239
84
$68,922
APPLICATIONS WITHDRAWN
6
$74,112
62
$241,544
170
$147,406
21
$92,521
0
$0
16
$161,363
15
$70,326
FILES CLOSED FOR INCOMPLETENESS
0
$0
26
$169,620
81
$149,655
4
$255,690
0
$0
6
$167,175
0
$0
Aggregated Statistics For Year 2006 (Based on 12 partial tracts)
A) FHA, FSA/RHS & VA Home Purchase Loans
B) Conventional Home Purchase Loans
C) Refinancings
D) Home Improvement Loans
E) Loans on Dwellings For 5+ Families
F) Non-occupant Loans on < 5 Family Dwellings (A B C & D)
G) Loans On Manufactured Home Dwelling (A B C & D)
Number
Average Value
Number
Average Value
Number
Average Value
Number
Average Value
Number
Average Value
Number
Average Value
Number
Average Value
LOANS ORIGINATED
52
$98,751
904
$184,704
616
$148,909
116
$58,501
1
$781,720
351
$219,422
73
$61,597
APPLICATIONS APPROVED, NOT ACCEPTED
8
$98,170
107
$155,951
103
$114,277
26
$39,570
0
$0
38
$181,749
27
$74,830
APPLICATIONS DENIED
5
$129,460
165
$93,437
389
$115,367
113
$57,589
0
$0
83
$86,572
111
$61,061
APPLICATIONS WITHDRAWN
10
$133,114
75
$206,340
205
$120,674
23
$89,833
0
$0
29
$172,052
10
$71,303
FILES CLOSED FOR INCOMPLETENESS
0
$0
14
$90,872
59
$118,488
2
$43,430
0
$0
4
$60,672
0
$0
Aggregated Statistics For Year 2005 (Based on 12 partial tracts)
A) FHA, FSA/RHS & VA Home Purchase Loans
B) Conventional Home Purchase Loans
C) Refinancings
D) Home Improvement Loans
E) Loans on Dwellings For 5+ Families
F) Non-occupant Loans on < 5 Family Dwellings (A B C & D)
G) Loans On Manufactured Home Dwelling (A B C & D)
Number
Average Value
Number
Average Value
Number
Average Value
Number
Average Value
Number
Average Value
Number
Average Value
Number
Average Value
LOANS ORIGINATED
44
$103,618
842
$155,041
675
$146,802
109
$29,523
2
$1,219,600
224
$157,438
80
$62,777
APPLICATIONS APPROVED, NOT ACCEPTED
7
$103,547
93
$100,479
100
$124,871
34
$40,484
0
$0
13
$161,977
42
$54,121
APPLICATIONS DENIED
17
$83,955
192
$78,691
408
$106,894
120
$39,032
0
$0
30
$153,698
123
$61,171
APPLICATIONS WITHDRAWN
3
$95,743
114
$121,549
376
$138,971
50
$171,688
0
$0
26
$164,940
25
$64,430
FILES CLOSED FOR INCOMPLETENESS
2
$144,970
32
$111,254
39
$123,896
3
$56,940
0
$0
0
$0
3
$94,327
Aggregated Statistics For Year 2004 (Based on 12 partial tracts)
A) FHA, FSA/RHS & VA Home Purchase Loans
B) Conventional Home Purchase Loans
C) Refinancings
D) Home Improvement Loans
E) Loans on Dwellings For 5+ Families
F) Non-occupant Loans on < 5 Family Dwellings (A B C & D)
G) Loans On Manufactured Home Dwelling (A B C & D)
Number
Average Value
Number
Average Value
Number
Average Value
Number
Average Value
Number
Average Value
Number
Average Value
Number
Average Value
LOANS ORIGINATED
37
$95,169
721
$141,663
705
$134,194
119
$27,493
9
$360,983
210
$144,646
75
$66,324
APPLICATIONS APPROVED, NOT ACCEPTED
5
$126,282
95
$131,309
131
$109,136
23
$29,190
0
$0
19
$112,169
41
$62,570
APPLICATIONS DENIED
10
$88,777
176
$86,335
453
$107,779
77
$34,990
0
$0
29
$109,391
129
$57,575
APPLICATIONS WITHDRAWN
7
$94,614
55
$116,096
304
$121,863
18
$44,914
0
$0
13
$84,440
32
$66,862
FILES CLOSED FOR INCOMPLETENESS
4
$253,285
16
$137,089
20
$135,902
2
$18,635
0
$0
5
$125,800
1
$81,530
Aggregated Statistics For Year 2003 (Based on 12 partial tracts)
A) FHA, FSA/RHS & VA Home Purchase Loans
B) Conventional Home Purchase Loans
C) Refinancings
D) Home Improvement Loans
E) Loans on Dwellings For 5+ Families
F) Non-occupant Loans on < 5 Family Dwellings (A B C & D)
Number
Average Value
Number
Average Value
Number
Average Value
Number
Average Value
Number
Average Value
Number
Average Value
LOANS ORIGINATED
46
$90,665
481
$129,633
1,419
$127,670
80
$21,207
6
$263,877
201
$135,802
APPLICATIONS APPROVED, NOT ACCEPTED
4
$81,248
60
$113,508
181
$123,650
9
$11,194
0
$0
9
$79,112
APPLICATIONS DENIED
4
$105,915
126
$80,863
484
$93,357
45
$20,153
0
$0
30
$100,897
APPLICATIONS WITHDRAWN
7
$75,153
44
$122,995
227
$138,820
7
$26,223
0
$0
9
$131,782
FILES CLOSED FOR INCOMPLETENESS
3
$63,633
13
$108,203
24
$143,772
2
$68,670
0
$0
0
$0
Aggregated Statistics For Year 2002 (Based on 12 partial tracts)
A) FHA, FSA/RHS & VA Home Purchase Loans
B) Conventional Home Purchase Loans
C) Refinancings
D) Home Improvement Loans
E) Loans on Dwellings For 5+ Families
F) Non-occupant Loans on < 5 Family Dwellings (A B C & D)
Number
Average Value
Number
Average Value
Number
Average Value
Number
Average Value
Number
Average Value
Number
Average Value
LOANS ORIGINATED
55
$93,367
464
$130,765
1,152
$139,634
141
$15,716
1
$178,110
151
$156,066
APPLICATIONS APPROVED, NOT ACCEPTED
1
$42,690
58
$104,947
143
$110,292
10
$9,080
0
$0
6
$241,393
APPLICATIONS DENIED
6
$92,695
132
$68,030
333
$85,000
61
$9,659
0
$0
29
$86,379
APPLICATIONS WITHDRAWN
6
$52,905
33
$127,962
169
$103,553
5
$7,860
0
$0
13
$180,308
FILES CLOSED FOR INCOMPLETENESS
0
$0
12
$84,942
41
$136,446
0
$0
0
$0
3
$61,007
Aggregated Statistics For Year 2001 (Based on 12 partial tracts)
A) FHA, FSA/RHS & VA Home Purchase Loans
B) Conventional Home Purchase Loans
C) Refinancings
D) Home Improvement Loans
E) Loans on Dwellings For 5+ Families
F) Non-occupant Loans on < 5 Family Dwellings (A B C & D)
Number
Average Value
Number
Average Value
Number
Average Value
Number
Average Value
Number
Average Value
Number
Average Value
LOANS ORIGINATED
72
$85,786
508
$132,255
931
$117,438
108
$16,130
2
$57,000
155
$125,550
APPLICATIONS APPROVED, NOT ACCEPTED
2
$86,080
97
$67,994
101
$101,973
14
$26,551
0
$0
8
$82,041
APPLICATIONS DENIED
2
$81,475
210
$59,159
430
$80,745
40
$21,338
0
$0
21
$69,593
APPLICATIONS WITHDRAWN
7
$73,153
32
$126,288
155
$83,555
6
$62,420
0
$0
4
$98,815
FILES CLOSED FOR INCOMPLETENESS
3
$61,253
2
$45,145
43
$79,483
2
$85,820
0
$0
1
$37,460
Aggregated Statistics For Year 2000 (Based on 12 partial tracts)
A) FHA, FSA/RHS & VA Home Purchase Loans
B) Conventional Home Purchase Loans
C) Refinancings
D) Home Improvement Loans
E) Loans on Dwellings For 5+ Families
F) Non-occupant Loans on < 5 Family Dwellings (A B C & D)
Number
Average Value
Number
Average Value
Number
Average Value
Number
Average Value
Number
Average Value
Number
Average Value
LOANS ORIGINATED
64
$72,964
564
$131,212
344
$84,481
119
$19,511
2
$30,040
100
$139,543
APPLICATIONS APPROVED, NOT ACCEPTED
11
$57,588
90
$67,533
114
$75,273
18
$18,212
0
$0
9
$53,659
APPLICATIONS DENIED
22
$61,393
337
$44,928
265
$65,187
50
$23,105
0
$0
20
$43,480
APPLICATIONS WITHDRAWN
12
$61,944
68
$102,527
144
$76,859
9
$37,282
0
$0
5
$126,478
FILES CLOSED FOR INCOMPLETENESS
0
$0
11
$154,449
21
$90,999
0
$0
0
$0
3
$78,513
Aggregated Statistics For Year 1999 (Based on 6 partial tracts)
A) FHA, FSA/RHS & VA Home Purchase Loans
B) Conventional Home Purchase Loans
C) Refinancings
D) Home Improvement Loans
F) Non-occupant Loans on < 5 Family Dwellings (A B C & D)
2003 - 2018 National Fire Incident Reporting System (NFIRS) incidents
Based on the data from the years 2003 - 2018 the average number of fire incidents per year is 100. The highest number of reported fires - 196 took place in 2007, and the least - 39 in 2003. The data has a growing trend.
When looking into fire subcategories, the most reports belonged to: Outside Fires (41.0%), and Structure Fires (30.8%).
Fire incident types reported to NFIRS in Zip Code 37774


 Nearest zip codes: 37771, 37846, 37772, 37763, 37874, 37742.


 Based on the data from the years 2003 - 2018 the average number of fire incidents per year is 100. The highest number of reported fires - 196 took place in 2007, and the least - 39 in 2003. The data has a growing trend.
 When looking into fire subcategories, the most reports belonged to: Outside Fires (41.0%), and Structure Fires (30.8%).