Estimated zip code population in 2022: 13,225 Zip code population in 2010: 14,627 Zip code population in 2000: 14,717
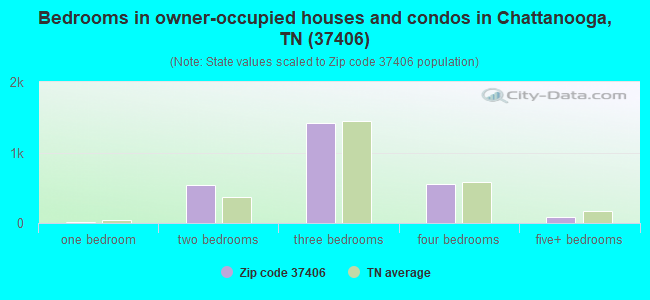
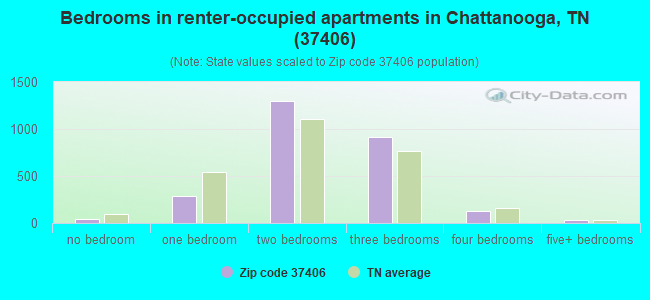
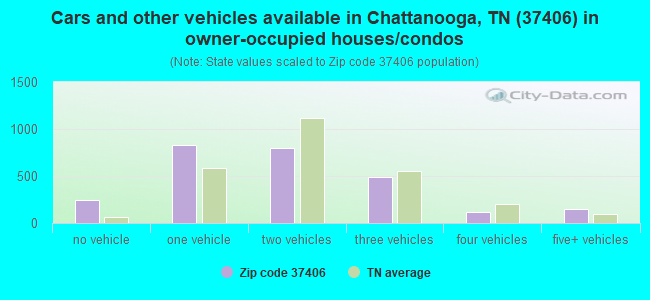
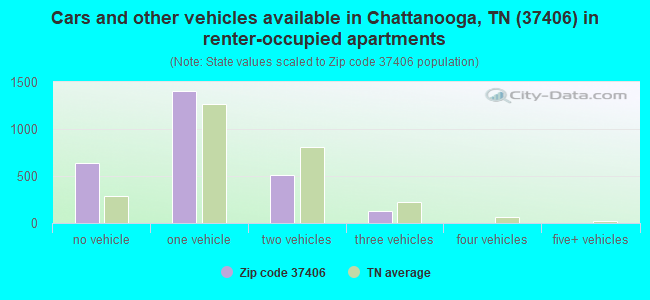
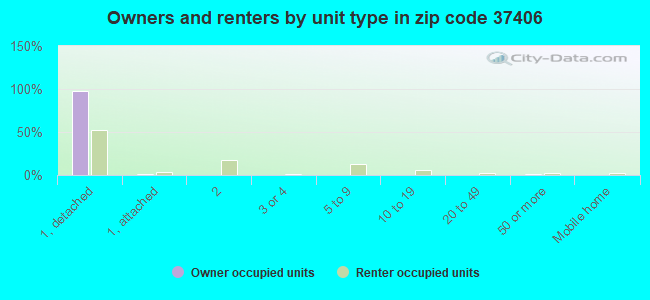
Houses and condos: 5,918 Renter-occupied apartments: 2,707
% of renters here:
51%
State:
33%
March 2022 cost of living index in zip code 37406: 88.7 (less than average, U.S. average is 100)
Land area: 12.3 sq. mi. Water area: 0.6 sq. mi.
Population density: 1,078 people per square mile
(low).
OSM Map
General Map
Google Map
MSN Map
OSM Map
General Map
Google Map
MSN Map
OSM Map
General Map
Google Map
MSN Map
OSM Map
General Map
Google Map
MSN Map
Please wait while loading the map...
Real estate property taxes paid for housing units in 2022:
This zip code:
0.8% ($1,299)
Tennessee:
0.5% ($1,376)
Median real estate property taxes paid for housing units with mortgages in 2022: $1,303 (0.7%) Median real estate property taxes paid for housing units with no mortgage in 2022: $1,301 (0.8%)
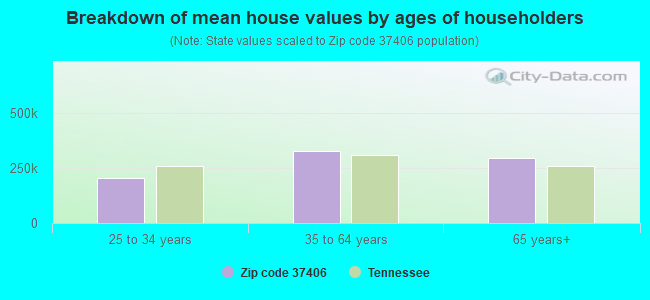
Estimated median house/condo value in 2022: $172,647
37406:
$172,647
Tennessee:
$284,800
According to our research of Tennessee and other state lists, there were 42 registered sex offenders living in 37406 zip code as of April 27, 2024. The ratio of all residents to sex offenders in zip code 37406 is 363 to 1. The ratio of registered sex offenders to all residents in this zip code is near the state average.
Median resident age:
This zip code:
35.5 years
Tennessee median age:
39.2 years
Average household size:
This zip code:
2.5 people
Tennessee:
2.4 people
Averages for the 2020 tax year for zip code 37406, filed in 2021:
Average Adjusted Gross Income (AGI) in 2020: $34,419 (Individual Income Tax Returns)
Here:
$34,419
State:
$69,014
Salary/wage: $30,780 (reported on 88.5% of returns)
Here:
$30,780
State:
$55,872
(% of AGI for various income ranges: 1153.8% for AGIs below $25k, 3704.2% for AGIs $25k-50k, 6537.7% for AGIs $50k-75k, 10398.6% for AGIs $75k-100k, 16264.2% for AGIs $100k-200k)
Taxable interest for individuals: $573 (reported on 10.2% of returns)
This zip code:
$573
Tennessee:
$1,945
(% of AGI for various income ranges: 2.7% for AGIs below $25k, 3.1% for AGIs $25k-50k, 4.1% for AGIs $50k-75k, 29.3% for AGIs $75k-100k, 24.2% for AGIs $100k-200k)
Ordinary dividends: $1,804 (reported on 4.4% of returns)
Here:
$1,804
State:
$8,105
(% of AGI for various income ranges: 2.9% for AGIs below $25k, 6.2% for AGIs $25k-50k, 6.8% for AGIs $50k-75k, 30.0% for AGIs $75k-100k, 66.7% for AGIs $100k-200k)
Net capital gain/loss in AGI: +$11,559 (reported on 4.4% of returns)
Here:
+$11,559
State:
+$33,664
(% of AGI for various income ranges: 2.6% for AGIs below $25k, 7.8% for AGIs $25k-50k, 39.3% for AGIs $50k-75k, 15.7% for AGIs $75k-100k, 352.5% for AGIs $100k-200k)
Profit/loss from business: +$7,996 (reported on 12.6% of returns)
Here:
+$7,996
State:
+$18,991
(% of AGI for various income ranges: 103.0% for AGIs below $25k, 58.0% for AGIs $25k-50k, 87.7% for AGIs $50k-75k, 335.0% for AGIs $75k-100k, 1418.3% for AGIs $100k-200k)
Taxable individual retirement arrangement distribution: $9,511 (reported on 3.0% of returns)
37406:
$9,511
Tennessee:
$20,036
(% of AGI for various income ranges: 7.3% for AGIs below $25k, 25.0% for AGIs $25k-50k, 68.9% for AGIs $50k-75k, 165.0% for AGIs $75k-100k, 495.0% for AGIs $100k-200k)
Total itemized deductions: $26,233 (reported on 2.0% of returns)
Here:
$26,233
State:
$40,136
(% of AGI for various income ranges: 60.9% for AGIs $25k-50k, 266.8% for AGIs $50k-75k, 848.3% for AGIs $100k-200k)
Charity contributions: $8,300 (reported on 1.8% of returns)
Here:
$8,300
State:
$19,852
(% of AGI for various income ranges: 11.7% for AGIs $25k-50k, 92.7% for AGIs $50k-75k, 267.5% for AGIs $100k-200k)
Taxes paid: $4,818 (reported on 1.8% of returns)
37406:
$4,818
State:
$6,038
(% of AGI for various income ranges: 7.8% for AGIs $25k-50k, 40.5% for AGIs $50k-75k, 190.8% for AGIs $100k-200k)
Earned income credit: $2,701 (reported on 36.9% of returns)
Here:
$2,701
State:
$2,391
(% of AGI for various income ranges: 171.5% for AGIs below $25k, 102.1% for AGIs $25k-50k)
Percentage of individuals using paid preparers for their 2020 taxes: 94.1%
Here:
94%
State:
93%
(% for various income ranges: 94.8% for AGIs below $25k, 93.8% for AGIs $25k-50k, 93.2% for AGIs $50k-75k, 91.3% for AGIs $75k-100k, 90.0% for AGIs $100k-200k, 100.0% for AGIs over 200k)
Averages for the 2012 tax year for zip code 37406, filed in 2013:
Average Adjusted Gross Income (AGI) in 2012: $26,623 (Individual Income Tax Returns)
Here:
$26,623
State:
$53,767
Salary/wage: $24,211 (reported on 90.2% of returns)
Here:
$24,211
State:
$45,421
(% of AGI for various income ranges: 83.8% for AGIs below $25k, 88.2% for AGIs $25k-50k, 81.7% for AGIs $50k-75k, 73.9% for AGIs $75k-100k, 69.4% for AGIs $100k-200k)
Taxable interest for individuals: $452 (reported on 8.2% of returns)
This zip code:
$452
Tennessee:
$1,732
(% of AGI for various income ranges: 0.1% for AGIs below $25k, 0.2% for AGIs $50k-75k, 0.2% for AGIs $75k-100k, 0.2% for AGIs $100k-200k)
Ordinary dividends: $2,114 (reported on 3.7% of returns)
Here:
$2,114
State:
$6,739
(% of AGI for various income ranges: 0.2% for AGIs below $25k, 0.2% for AGIs $25k-50k, 0.5% for AGIs $75k-100k, 0.8% for AGIs $100k-200k)
Net capital gain/loss in AGI: +$1,750 (reported on 1.8% of returns)
Here:
+$1,750
State:
+$19,082
(% of AGI for various income ranges: 0.9% for AGIs $100k-200k)
Profit/loss from business: +$6,492 (reported on 10.9% of returns)
Here:
+$6,492
State:
+$15,240
(% of AGI for various income ranges: 7.5% for AGIs below $25k, 0.6% for AGIs $25k-50k, 0.7% for AGIs $50k-75k, 0.5% for AGIs $75k-100k)
Taxable individual retirement arrangement distribution: $9,033 (reported on 3.2% of returns)
37406:
$9,033
Tennessee:
$15,505
(% of AGI for various income ranges: 0.6% for AGIs below $25k, 0.7% for AGIs $25k-50k, 1.4% for AGIs $50k-75k, 4.5% for AGIs $75k-100k)
Total itemized deductions: $16,283 (25% of AGI, reported on 11.6% of returns)
Here:
$16,283
State:
$21,976
Here:
25.4% of AGI
State:
17.8% of AGI
(% of AGI for various income ranges: 2.6% for AGIs below $25k, 7.7% for AGIs $25k-50k, 11.1% for AGIs $50k-75k, 11.1% for AGIs $75k-100k, 8.5% for AGIs $100k-200k)
Charity contributions: $4,424 (reported on 9.6% of returns)
Here:
$4,424
State:
$6,709
(% of AGI for various income ranges: 0.4% for AGIs below $25k, 1.4% for AGIs $25k-50k, 2.6% for AGIs $50k-75k, 3.7% for AGIs $75k-100k, 2.0% for AGIs $100k-200k)
Taxes paid: $3,317 (reported on 11.6% of returns)
37406:
$3,317
State:
$4,829
(% of AGI for various income ranges: 0.4% for AGIs below $25k, 1.4% for AGIs $25k-50k, 2.1% for AGIs $50k-75k, 2.1% for AGIs $75k-100k, 2.8% for AGIs $100k-200k)
Earned income credit: $2,597 (reported on 44.6% of returns)
Here:
$2,597
State:
$2,404
(% of AGI for various income ranges: 12.4% for AGIs below $25k, 1.6% for AGIs $25k-50k)
Percentage of individuals using paid preparers for their 2012 taxes: 49.2%
Here:
49%
State:
52%
(% for various income ranges: 48.9% for AGIs below $25k, 45.5% for AGIs $25k-50k, 52.8% for AGIs $50k-75k, 63.2% for AGIs $75k-100k, 70.0% for AGIs $100k-200k)
Averages for the 2004 tax year for zip code 37406, filed in 2005:
Average Adjusted Gross Income (AGI) in 2004: $23,193 (Individual Income Tax Returns)
Here:
$23,193
State:
$44,088
Salary/wage: $21,749 (reported on 92.6% of returns)
Here:
$21,749
State:
$38,825
(% of AGI for various income ranges: 91.8% for AGIs below $10k, 89.5% for AGIs $10k-25k, 91.8% for AGIs $25k-50k, 84.5% for AGIs $50k-75k, 80.3% for AGIs $75k-100k, 60.6% for AGIs over 100k)
Taxable interest for individuals: $582 (reported on 12.7% of returns)
This zip code:
$582
Tennessee:
$1,802
(% of AGI for various income ranges: 0.6% for AGIs below $10k, 0.3% for AGIs $10k-25k, 0.2% for AGIs $25k-50k, 0.4% for AGIs $50k-75k, 0.4% for AGIs $75k-100k, 0.6% for AGIs over 100k)
Taxable dividends: $728 (reported on 4.1% of returns)
Here:
$728
State:
$3,727
(% of AGI for various income ranges: 0.2% for AGIs below $10k, 0.1% for AGIs $10k-25k, 0.1% for AGIs $25k-50k, 0.1% for AGIs $50k-75k, 0.1% for AGIs $75k-100k, 0.3% for AGIs over 100k)
Net capital gain/loss: +$788 (reported on 2.4% of returns)
Here:
+$788
State:
+$15,776
(% of AGI for various income ranges: 0.2% for AGIs below $10k, -0.0% for AGIs $10k-25k, 0.0% for AGIs $25k-50k, 0.0% for AGIs $50k-75k, 0.6% for AGIs $75k-100k, 0.2% for AGIs over 100k)
Profit/loss from business: +$3,158 (reported on 10.1% of returns)
Here:
+$3,158
State:
+$12,882
(% of AGI for various income ranges: 3.7% for AGIs below $10k, 3.5% for AGIs $10k-25k, 0.6% for AGIs $25k-50k, -0.6% for AGIs $50k-75k, 0.3% for AGIs $75k-100k)
IRA payment deduction: $1,256 (reported on 0.7% of returns)
37406:
$1,256
Tennessee:
$2,934
Total itemized deductions: $13,177 (28% of AGI, reported on 13.8% of returns)
Here:
$13,177
State:
$18,035
Here:
28.0% of AGI
State:
19.9% of AGI
(% of AGI for various income ranges: 3.7% for AGIs below $10k, 4.0% for AGIs $10k-25k, 9.1% for AGIs $25k-50k, 12.6% for AGIs $50k-75k, 11.4% for AGIs $75k-100k, 6.1% for AGIs over 100k)
Charity contributions deductions: $4,263 (9% of AGI, reported on 12.3% of returns)
Here:
$4,263
State:
$5,167
Here:
8.9% of AGI
State:
5.3% of AGI
(% of AGI for various income ranges: 0.3% for AGIs below $10k, 0.9% for AGIs $10k-25k, 2.3% for AGIs $25k-50k, 4.3% for AGIs $50k-75k, 4.7% for AGIs $75k-100k, 2.3% for AGIs over 100k)
Total tax: $2,859 (reported on 54.2% of returns)
37406:
$2,859
State:
$7,482
(% of AGI for various income ranges: 1.9% for AGIs below $10k, 2.7% for AGIs $10k-25k, 5.9% for AGIs $25k-50k, 9.1% for AGIs $50k-75k, 11.5% for AGIs $75k-100k, 20.3% for AGIs over 100k)
Earned income credit: $2,119 (reported on 46.1% of returns)
Here:
$2,119
State:
$1,826
Percentage of individuals using paid preparers for their 2004 taxes: 67.1%
Here:
67%
State:
60%
(% for various income ranges: 62.9% for AGIs below $10k, 71.6% for AGIs $10k-25k, 63.3% for AGIs $25k-50k, 66.4% for AGIs $50k-75k, 70.2% for AGIs $75k-100k, 82.1% for AGIs over 100k)
Likely homosexual households (counted as self-reported same-sex unmarried-partner households)
Lesbian couples: 0.4% of all households
Gay men: 0.0% of all households
Household received Food Stamps/SNAP in the past 12 months: 1,482 Household did not receive Food Stamps/SNAP in the past 12 months: 3,809
Women who had a birth in the past 12 months: 209 (37 now married, 165 unmarried) Women who did not have a birth in the past 12 months: 3,012 (953 now married, 2,057 unmarried)
Housing units in zip code 37406 with a mortgage: 1,342 (93 second mortgage, 9 home equity loan, 17 both second mortgage and home equity loan) Houses without a mortgage: 12
Median monthly owner costs for units with a mortgage: $1,094 Median monthly owner costs for units without a mortgage: $462
Residents with income below the poverty level in 2022:
This zip code:
30.3%
Whole state:
13.3%
Residents with income below 50% of the poverty level in 2022:
This zip code:
16.7%
Whole state:
7.1%
Median number of rooms in houses and condos:
Here:
6.2
State:
6.5
Median number of rooms in apartments:
Here:
4.5
State:
4.4
Notable locations in this zip code not listed on our city pages
Notable locations in zip code 37406: Harry Debutts Yards (A), McCarty Station (B), Tennessee Valley Railroad Museum (C), Chattanooga Fire Department Station 4 (D), Southwest Ambulance (E). Display/hide their locations on the map
Churches in zip code 37406 include: Kings Point Church (A), Antioch Church (B), Chamlee Heights Church (C), Avondale Baptist Church (D), Avondale Church of Christ (E), Calvary Temple Assembly of God (F), Chamberlain Memorial Baptist Church (G), East Chattanooga Baptist Church (H), East Chattanooga Church of Christ (I). Display/hide their locations on the map
In group quarters: 73 (-1 institutionalized population)
Size of family households: 1,421 2-persons, 753 3-persons, 692 4-persons, 282 5-persons, 63 6-persons, 22 7-or-more-persons
Size of nonfamily households: 1,701 1-person, 378 2-persons, 23 3-persons
643 married couples with children.
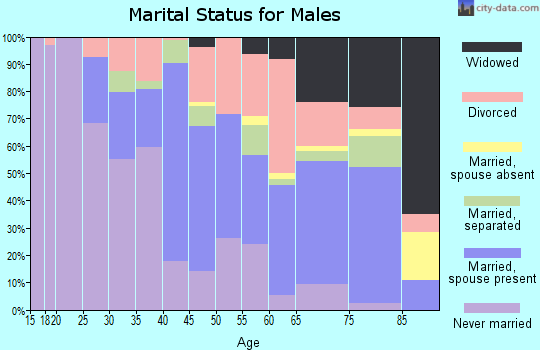
1,950 single-parent households (165 men, 1,785 women).
94.7% of residents of 37406 zip code speak English at home.
3.9% of residents speak Spanish at home (43% very well, 26% well, 20% not well, 11% not at all).
0.2% of residents speak other Indo-European language at home (14% very well, 86% well).
0.3% of residents speak Asian or Pacific Island language at home (100% very well).
0.7% of residents speak other language at home (100% very well).
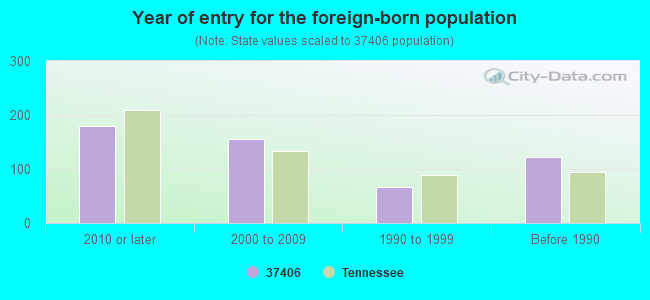
Foreign born population: 504 (3.8%) (22.6% of them are naturalized citizens)
Major facilities with environmental interests located in this zip code:
A-1 SHIPLEY'S WASTE OIL INC (1600 WILDER STREET in CHATTANOOGA, TN)
(Integrated Compliance Information System) - ICIS-04-2006-7003, ENFORCEMENT/COMPLIANCE ACTIVITY FORMAL ENFORCEMENT ACTION (Integrated Compliance Information System) - ICIS-04-2006-7003, ENFORCEMENT/COMPLIANCE ACTIVITY TRANSPORTER (Resource Conservation and Recovery Act (tracking hazardous waste)) USED OIL PROGRAM (Resource Conservation and Recovery Act (tracking hazardous waste)) Business NAICS classification: SPECIAL NEEDS TRANSPORTATION. Organizations: ELLEN SHIPLEY (CONTACT/OPERATOR)
, KEN SHIPLEY (CONTACT/OWNER)
ARCHER DANIELS MIDLAND COMPANY (1200 JUDD ROAD in CHATTANOOGA, TN)
AIR MINOR (AIRS/AFS) (Integrated Compliance Information System) - ICIS-04-1998-0177, FORMAL ENFORCEMENT ACTION CRITERIA AND HAZARDOUS AIR POLLUTANT INVENTORY (Inventory of air pollution sources) Small Quantity Generators, between 100 kg and 1000 kg of hazardous waste/month (Resource Conservation and Recovery Act (tracking hazardous waste)) - notification TRI REPORTER (Tracking of toxic chemicals releasing facilities) Business SIC classification: PREPARED FEEDS AND FEED INGREDIENTS FOR ANIMALS AND FOWLS, EXCEPT DOGS AND CATS Business NAICS classification: OTHER ANIMAL FOOD MANUFACTURING.; FATS AND OILS REFINING AND BLENDING. Alternative names: ADM
BASF CORPORATION (3805 AMNICOLA HIGHWAY in CHATTANOOGA, TN)
AIR SYNTHETIC MINOR (AIRS/AFS) CRITERIA AND HAZARDOUS AIR POLLUTANT INVENTORY (Inventory of air pollution sources) National Pollutant Discharge Elimination System NON-MAJOR (Tracking pollutant discharge elimination systems) - permit Large Quantity Generators, more that 1000 kg of hazardous waste/month (Resource Conservation and Recovery Act (tracking hazardous waste)) TRI REPORTER (Tracking of toxic chemicals releasing facilities) Business SIC classification: SYNTHETIC RUBBER (VULCANIZABLE ELASTOMERS) Business NAICS classification: SYNTHETIC RUBBER MANUFACTURING.; SYNTHETIC RUBBER MANUFACTURING. Organizations: J D PURVIS (CONTACT/OPERATOR)
, TRACY MALONE (CONTACT/OWNER)
Alternative names: BASF CORPORATION CONSUMER PRODUCTS/LIFE, BASF CORP PLT #1
BUSTER BROWN APPAREL INCORPORATED (2001 WHEELER AVE. in CHATTANOOGA, TN)
AIR MINOR (AIRS/AFS) (Resource Conservation and Recovery Act (tracking hazardous waste)) TRI REPORTER (Tracking of toxic chemicals releasing facilities) Business SIC classification: FINISHERS OF TEXTILES Business NAICS classification: OTHER HOSIERY AND SOCK MILLS.; OUTERWEAR KNITTING MILLS.; OUTERWEAR KNITTING MILLS.; UNDERWEAR AND NIGHTWEAR KNITTING MILLS. Alternative names: SKYLAND INTERNATIONAL CORPORATION
CUTTER LABORATORIES, INC (1800 CRUTCHFIELD in CHATTANOOGA, TN)
(Integrated Compliance Information System) - ICIS-04-1976-0020, FORMAL ENFORCEMENT ACTION (Resource Conservation and Recovery Act (tracking hazardous waste)) Business SIC classification: PHARMACEUTICAL PREPARATIONS Business NAICS classification: PHARMACEUTICAL PREPARATION MANUFACTURING.
CHATTANOOGA STATE MID COLLEGE HIGH SCHOOL (4501 AMNICOLA HW in CHATTANOOGA, TN)
(National Center for Education Statistics) - STATE ID-0086 Organizations: HAMILTON COUNTY SCHOOL DISTRCT (SCHOOL DISTRICT)
CHATTANOOGA STATE TECHNICAL COMMUNITY COLLEGE (4501 AMNICOLA HIGHWAY in CHATTANOOGA, TN)
AIR MINOR (AIRS/AFS) CRITERIA AND HAZARDOUS AIR POLLUTANT INVENTORY (Inventory of air pollution sources) Conditionally Exempt Small Quantity Generators, less than 100 kg/month of hazardous waste (Resource Conservation and Recovery Act (tracking hazardous waste)) - notification Business SIC classification: COLLEGES, UNIVERSITIES, AND PROFESSIONAL SCHOOLS; JUNIOR COLLEGES AND TECHNICAL INSTITUTES Organizations: DR. JAMES CATANZARO (CONTACT/OPERATOR)
, CHATTANOOGA STATE TECHNICAL COMM COLLEGE (CONTACT/OWNER)
Alternative names: CHATTANOOGA STATE TECHNICAL COMM COL, CHATTANOOGA STATE TECH COMM COLLEGE
DIXIE INDUSTRIES PL #2 (1210 S GREENWOOD AVENUE in CHATTANOOGA, TN)
AIR MINOR (AIRS/AFS) (Resource Conservation and Recovery Act (tracking hazardous waste)) TRI REPORTER (Tracking of toxic chemicals releasing facilities) Business SIC classification: IRON AND STEEL FORGINGS; NONCLASSIFIABLE ESTABLISHMENTS Business NAICS classification: IRON AND STEEL FORGING. Organizations: COLUMBUS-MCKINNON CORP (CONTACT/OWNER)
Alternative names: COLUMBUS MCKINNON CORP. DIXIE IND. DIV.
BROWN GALVANIZING CORP (4104 SOUTH CREEK ROAD EAST in CHATTANOOGA, TN)
AIR MINOR (AIRS/AFS) COMPLIANCE ACTIVITY (Tracking inspections of insecticide, fungicide, and rodenticide, and toxic substances) CRITERIA AND HAZARDOUS AIR POLLUTANT INVENTORY (Inventory of air pollution sources) TRI REPORTER (Tracking of toxic chemicals releasing facilities) Business SIC classification: COATING, ENGRAVING, AND ALLIED SERVICES; FABRICATED METAL PRODUCTS
DIXIE INDUSTRIAL COATING, INC. (3900 NORTH HAWTHORNE STREET in CHATTANOOGA, TN)
AIR SYNTHETIC MINOR (AIRS/AFS) CRITERIA AND HAZARDOUS AIR POLLUTANT INVENTORY (Inventory of air pollution sources) (Resource Conservation and Recovery Act (tracking hazardous waste)) Business SIC classification: COATING, ENGRAVING, AND ALLIED SERVICES Business NAICS classification: METAL COATING, ENGRAVING (EXCEPT JEWELRY AND SILVERWARE), AND ALLIED SERVICES TO MANUFACTURERS. Organizations: KURT HERTLE (CONTACT/OPERATOR)
, DIXIE INDUSTRIAL COATINGS, INC. (CONTACT/OWNER)
AMERICAN MANUFACTURING CO (3600 N. HAWTHORNE ST. in CHATTANOOGA, TN)
CRITERIA AND HAZARDOUS AIR POLLUTANT INVENTORY (Inventory of air pollution sources) HAZARDOUS WASTE BIENNIAL REPORTER (Resource Conservation and Recovery Act (tracking hazardous waste)) (Resource Conservation and Recovery Act (tracking hazardous waste)) TRI REPORTER (Tracking of toxic chemicals releasing facilities) Business SIC classification: ELECTROPLATING, PLATING, POLISHING, ANODIZING, AND COLORING; MISCELLANEOUS FABRICATED WIRE PRODUCTS Business NAICS classification: ELECTROPLATING, PLATING, POLISHING, ANODIZING, AND COLORING.; ALL OTHER MISCELLANEOUS FABRICATED METAL PRODUCT MANUFACTURING. Organizations: ARRAY - CHATTANOOGA (CONTACT/OWNER)
CARGILL INCORPORATED (1B RIVERSIDE LANE in CHATTANOOGA, TN)
AIR SYNTHETIC MINOR (AIRS/AFS) CRITERIA AND HAZARDOUS AIR POLLUTANT INVENTORY (Inventory of air pollution sources) (Resource Conservation and Recovery Act (tracking hazardous waste)) TRI REPORTER (Tracking of toxic chemicals releasing facilities) Business SIC classification: FLOUR AND OTHER GRAIN MILL PRODUCTS Business NAICS classification: FLOUR MILLING. Alternative names: HORIZON MILLING LLC
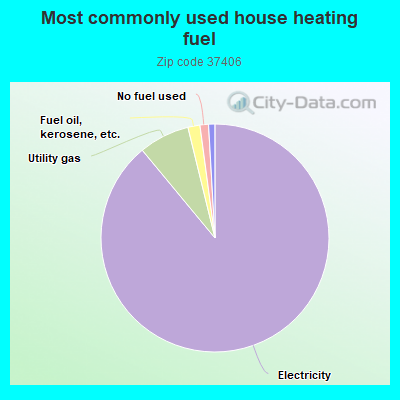
Housing units lacking complete plumbing facilities: 4.4% Housing units lacking complete kitchen facilities: 3.3%
88.9%Electricity
7.2%Utility gas
1.7%Fuel oil, kerosene, etc.
1.2%No fuel used
0.9%Bottled, tank, or LP gas
Population in 1990: 15,684.
Place of birth for U.S.-born residents:
This state: 9,789
Northeast: 254
Midwest: 547
South: 1,817
West: 165
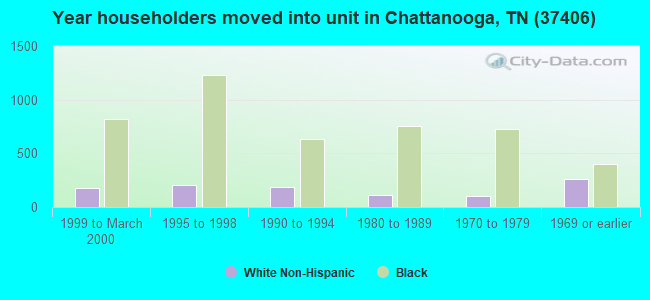
61% of the 37406 zip code residents lived in the same house 5 years ago. Out of people who lived in different houses, 85% lived in this county. Out of people who lived in different counties, 50% lived in Tennessee.
88% of the 37406 zip code residents lived in the same house 1 year ago. Out of people who lived in different houses, 84% moved from this county. Out of people who lived in different houses, 5% moved from different county within same state. Out of people who lived in different houses, 2% moved from different state. Out of people who lived in different houses, 0% moved from abroad.
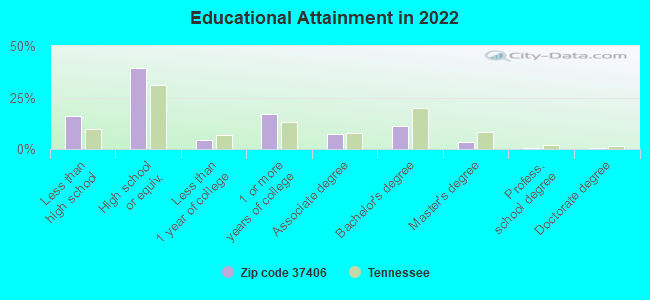
Private vs. public school enrollment:
Students in private schools in grades 1 to 8 (elementary and middle school): 62
Here:
4.5%
Tennessee:
15.0%
Students in private schools in grades 9 to 12 (high school): 31
Here:
2.8%
Tennessee:
16.2%
Students in private undergraduate colleges: 43
Here:
13.0%
Tennessee:
23.5%
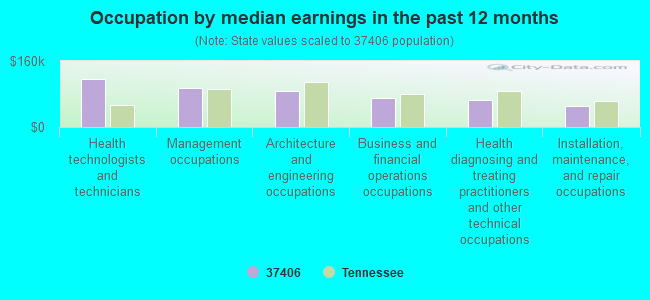
Occupation by median earnings in the past 12 months ($)
115,899Health technologists and technicians
93,971Management occupations
87,160Architecture and engineering occupations
70,479Business and financial operations occupations
64,771Health diagnosing and treating practitioners and other technical occupations
50,150Installation, maintenance, and repair occupations
Companies with federal contracts located in this zip code (CHATTANOOGA, TN):
HYDRO POWER SERVICES LLC (1415 STUART ST; small business) 100 employees, $0 revenue. : $8,324,045 in 30 contractsfrom 2005 to 2006
Contracts for Pipe, Tube and Rigid Tubing, Installation of Equipment -- Electric Wire, and Power and Distribution Equipment, Maintenance, Repair and Rebuilding of Equipment -- Engines, Turbines, and Components, Maintenance, Repair or Alteration of Real Property -- Dams, and moreby Army, U.S. Army Corps of Engineers - civil program financing only, Bureau of Reclamation Signed by year:2000: $0; 2001: $0; 2002: $0; 2003: $0; 2004: $0; 2005: $5,184,346; 2006: $3,139,699.
Biggest contracts:
$1,441,461 with Army for Pipe, Tube and Rigid Tubing. Taking place in GA. Signed on 2006-04-04. Completion date: 2006-09-29.
$748,221 with Army for Installation of Equipment -- Electric Wire, and Power and Distribution Equipment. Taking place in TX. Signed on 2005-11-21. Completion date: 2006-07-31.
$529,008 with U.S. Army Corps of Engineers - civil program financing only for Maintenance, Repair and Rebuilding of Equipment -- Engines, Turbines, and Components. Taking place in GA. Signed on 2005-05-09. Completion date: 2006-02-28.
$529,008 with Army for Maintenance, Repair and Rebuilding of Equipment -- Engines, Turbines, and Components. Taking place in GA. Signed on 2005-05-09. Completion date: 2006-02-28.
JAT OIL& SUPPLY INC (1110 STUART ST; small business) : $190,945 in 8 contractsfrom 1999 to 2003
Contracts for Fuel Oils, Liquid Propellants and Fuels, Petroleum Base by Tennessee Valley Authority, U.S. Army Corps of Engineers - civil program financing only Signed by year:2000: $25,000; 2001: $0; 2002: $0; 2003: -$1,055; 2004: $0; 2005: $0; 2006: $0.
Biggest contracts:
$220,000 with Tennessee Valley Authority for Fuel Oils. Signed on 2000-01-15. Completion date: 2000-01-15.
$118,000, same as above.Signed on 1999-11-15. Completion date: 1999-11-15.
$49,000, same as above.Signed on 1999-12-15. Completion date: 1999-12-15.
$25,000 with Tennessee Valley Authority for Fuel Oils. Taking place in AL. Signed on 2000-02-15. Completion date: 2000-02-15.
BROWNE LABORATORIES INC (4138 S CREEK RD; small business)
$34,885 with Navy for Facilities Operations Support Services. Taking place in FL. Signed on 2000-08-16. Completion date: 2001-08-15.
CHATTANOOGA STATE TECHNICAL CO (4501 AMNICOLA HWY)
$16,870 with Army for Other Administrative Support Services. Signed on 2006-04-19. Completion date: 2006-06-06.
CALVINS PROFESSIONAL LANDSCAPE (3032 TOWERWAY DR; small business) : $12,916 in 5 contractsfrom 2004 to 2005
Contracts for Landscaping/Groundskeeping Services by Navy Signed by year:2000: $0; 2001: $0; 2002: $0; 2003: $0; 2004: $5,500; 2005: $7,416; 2006: $0.
Biggest contracts:
$5,660 with Navy for Landscaping/Groundskeeping Services. Signed on 2005-05-19. Completion date: 2006-05-31.
$5,500, same as above.Signed on 2004-05-20. Completion date: 2005-05-31.
$1,490, same as above.Signed on 2005-02-22. Completion date: 2005-03-15.
$206, same as above.Signed on 2005-05-31. Completion date: 2006-05-31.
METALTEK INTERNATIONAL INC (4180 S CREEK RD) : $7,225 in 2 contractsfrom 2003 to 2004
$4,725 with Navy for Hardware, Commercial. Signed on 2003-11-21. Completion date: 2003-11-28.
$2,500 with Navy for Bars and Rods, Nonferrous Base Metal. Taking place in VA. Signed on 2004-06-23. Completion date: 2004-07-16.
TRI-STATE HYDRAULICS, INC (1310 CUSHMAN ST; small business) : $6,400 in 2 contractsin 2005
$4,200 with Army for Miscellaneous Machine Tools. Signed on 2005-09-08. Completion date: 2005-09-26.
$2,200, same as above.Signed on 2005-09-19. Completion date: 2005-09-26.
MODERN HEATING & AIR CONDITION (1807 ELMENDORF ST; small business)
$5,500 with U.S. Army Corps of Engineers - civil program financing only for Fans, Air Circulators, and Blower Equipment. Signed on 2002-07-15. Completion date: 2002-08-26.
COOKS PEST CONTROL, INC (2000 AMNICOLA HWY) : $4,080 in 6 contractsfrom 2002 to 2004
Contracts for Insect and Rodent Control Services by Army Signed by year:2000: $0; 2001: $0; 2002: $2,040; 2003: $0; 2004: $2,040; 2005: $0; 2006: $0.
Biggest contracts:
$1,020 with Army for Insect and Rodent Control Services. Signed on 2004-01-01. Completion date: 2004-12-31.
$1,020, same as above.Signed on 2004-01-01. Completion date: 2004-12-31.
$1,020, same as above.Signed on 2002-12-11. Completion date: 2003-12-31.
$1,020, same as above.Signed on 2002-12-11. Completion date: 2003-12-31.
Top industries in this zip code by the number of employees in 2005:
Wholesale Trade: Other Grocery and Related Products Merchant Wholesalers (100-249 employees: 1 establishment, 50-99 employees: 1 establishment, 10-19 employees: 1 establishment, 1-4 employees: 2 establishments)
2002 - 2018 National Fire Incident Reporting System (NFIRS) incidents
Based on the data from the years 2002 - 2018 the average number of fire incidents per year is 78. The highest number of fire incidents - 115 took place in 2007, and the least - 32 in 2002. The data has a rising trend.
When looking into fire subcategories, the most reports belonged to: Outside Fires (37.6%), and Structure Fires (33.1%).
Fire incident types reported to NFIRS in Zip Code 37406

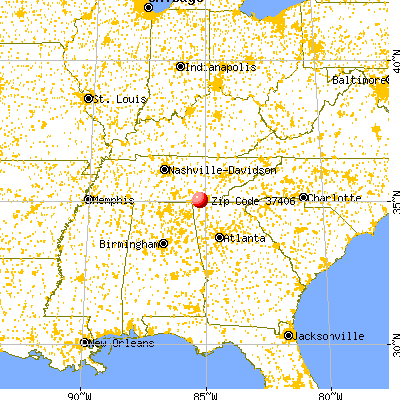


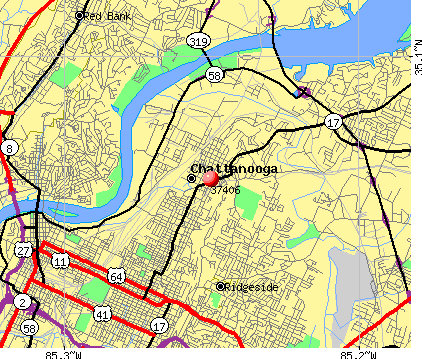 Nearest zip codes: 37351, 37411, 37404, 37403, 37415, 37416.


 Based on the data from the years 2002 - 2018 the average number of fire incidents per year is 78. The highest number of fire incidents - 115 took place in 2007, and the least - 32 in 2002. The data has a rising trend.
 When looking into fire subcategories, the most reports belonged to: Outside Fires (37.6%), and Structure Fires (33.1%).