Estimated zip code population in 2022: 38,927 Zip code population in 2010: 36,182 Zip code population in 2000: 33,493
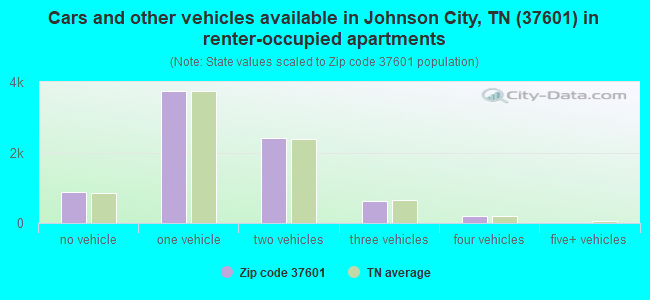
Houses and condos: 18,804 Renter-occupied apartments: 7,910
% of renters here:
45%
State:
33%
March 2022 cost of living index in zip code 37601: 83.4 (less than average, U.S. average is 100)
Land area: 46.2 sq. mi. Water area: 1.0 sq. mi.
Population density: 843 people per square mile
(low).
OSM Map
General Map
Google Map
MSN Map
OSM Map
General Map
Google Map
MSN Map
OSM Map
General Map
Google Map
MSN Map
OSM Map
General Map
Google Map
MSN Map
Please wait while loading the map...
Real estate property taxes paid for housing units in 2022:
This zip code:
0.6% ($1,257)
Tennessee:
0.5% ($1,376)
Median real estate property taxes paid for housing units with mortgages in 2022: $1,333 (0.6%) Median real estate property taxes paid for housing units with no mortgage in 2022: $1,181 (0.6%)
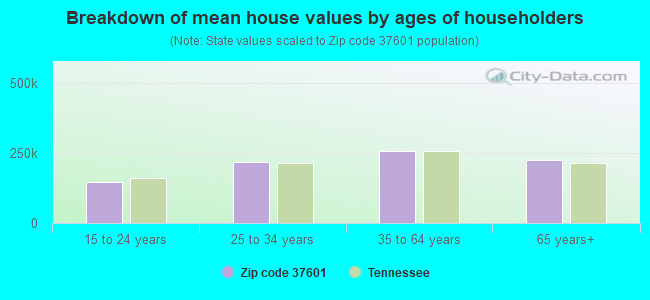
Estimated median house/condo value in 2022: $220,257
37601:
$220,257
Tennessee:
$284,800
According to our research of Tennessee and other state lists, there were 106 registered sex offenders living in 37601 zip code as of April 26, 2024. The ratio of all residents to sex offenders in zip code 37601 is 355 to 1. The ratio of registered sex offenders to all residents in this zip code is near the state average.
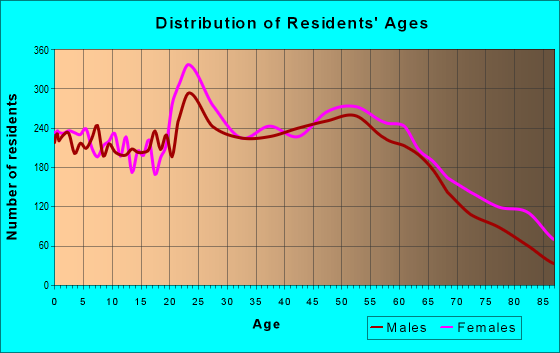
Median resident age:
This zip code:
38.7 years
Tennessee median age:
39.2 years
Average household size:
This zip code:
2.2 people
Tennessee:
2.4 people
Averages for the 2020 tax year for zip code 37601, filed in 2021:
Average Adjusted Gross Income (AGI) in 2020: $53,165 (Individual Income Tax Returns)
Here:
$53,165
State:
$69,014
Salary/wage: $44,540 (reported on 82.1% of returns)
Here:
$44,540
State:
$55,872
(% of AGI for various income ranges: 1160.0% for AGIs below $25k, 3451.7% for AGIs $25k-50k, 6031.2% for AGIs $50k-75k, 8791.3% for AGIs $75k-100k, 16145.8% for AGIs $100k-200k, 65240.6% for AGIs over 200k)
Taxable interest for individuals: $1,329 (reported on 31.2% of returns)
This zip code:
$1,329
Tennessee:
$1,945
(% of AGI for various income ranges: 11.8% for AGIs below $25k, 25.7% for AGIs $25k-50k, 58.2% for AGIs $50k-75k, 85.7% for AGIs $75k-100k, 162.7% for AGIs $100k-200k, 1321.8% for AGIs over 200k)
Ordinary dividends: $5,119 (reported on 12.8% of returns)
Here:
$5,119
State:
$8,105
(% of AGI for various income ranges: 10.7% for AGIs below $25k, 23.2% for AGIs $25k-50k, 58.6% for AGIs $50k-75k, 125.7% for AGIs $75k-100k, 234.5% for AGIs $100k-200k, 3191.8% for AGIs over 200k)
Net capital gain/loss in AGI: +$18,600 (reported on 12.3% of returns)
Here:
+$18,600
State:
+$33,664
(% of AGI for various income ranges: 5.3% for AGIs below $25k, 31.2% for AGIs $25k-50k, 85.2% for AGIs $50k-75k, 180.1% for AGIs $75k-100k, 726.1% for AGIs $100k-200k, 15835.3% for AGIs over 200k)
Profit/loss from business: +$21,451 (reported on 14.5% of returns)
Here:
+$21,451
State:
+$18,991
(% of AGI for various income ranges: 122.4% for AGIs below $25k, 150.4% for AGIs $25k-50k, 246.5% for AGIs $50k-75k, 388.7% for AGIs $75k-100k, 1055.0% for AGIs $100k-200k, 13441.8% for AGIs over 200k)
Taxable individual retirement arrangement distribution: $17,459 (reported on 7.8% of returns)
37601:
$17,459
Tennessee:
$20,036
(% of AGI for various income ranges: 37.7% for AGIs below $25k, 77.1% for AGIs $25k-50k, 187.7% for AGIs $50k-75k, 389.7% for AGIs $75k-100k, 702.5% for AGIs $100k-200k, 3155.3% for AGIs over 200k)
Self-employed (Keogh) retirement plans: $29,271 (reported on 0.4% of returns)
37601:
$29,271
Tennessee:
$28,955
(% of AGI for various income ranges: 56.4% for AGIs $75k-100k, 952.9% for AGIs over 200k)
Total itemized deductions: $42,838 (reported on 3.2% of returns)
Here:
$42,838
State:
$40,136
(% of AGI for various income ranges: 18.0% for AGIs below $25k, 41.5% for AGIs $25k-50k, 145.0% for AGIs $50k-75k, 210.9% for AGIs $75k-100k, 492.4% for AGIs $100k-200k, 6863.5% for AGIs over 200k)
Charity contributions: $18,488 (reported on 2.6% of returns)
Here:
$18,488
State:
$19,852
(% of AGI for various income ranges: 9.1% for AGIs $25k-50k, 36.7% for AGIs $50k-75k, 69.3% for AGIs $75k-100k, 180.0% for AGIs $100k-200k, 2911.8% for AGIs over 200k)
Taxes paid: $5,616 (reported on 3.1% of returns)
37601:
$5,616
State:
$6,038
(% of AGI for various income ranges: 1.2% for AGIs below $25k, 4.2% for AGIs $25k-50k, 15.2% for AGIs $50k-75k, 30.9% for AGIs $75k-100k, 81.5% for AGIs $100k-200k, 827.1% for AGIs over 200k)
Earned income credit: $2,188 (reported on 21.9% of returns)
Here:
$2,188
State:
$2,391
(% of AGI for various income ranges: 102.1% for AGIs below $25k, 64.4% for AGIs $25k-50k, 1.7% for AGIs $50k-75k)
Percentage of individuals using paid preparers for their 2020 taxes: 93.5%
Here:
94%
State:
93%
(% for various income ranges: 92.9% for AGIs below $25k, 94.3% for AGIs $25k-50k, 93.7% for AGIs $50k-75k, 93.6% for AGIs $75k-100k, 93.3% for AGIs $100k-200k, 95.9% for AGIs over 200k)
Averages for the 2012 tax year for zip code 37601, filed in 2013:
Average Adjusted Gross Income (AGI) in 2012: $42,093 (Individual Income Tax Returns)
Here:
$42,093
State:
$53,767
Salary/wage: $37,220 (reported on 84.6% of returns)
Here:
$37,220
State:
$45,421
(% of AGI for various income ranges: 78.7% for AGIs below $25k, 81.1% for AGIs $25k-50k, 74.6% for AGIs $50k-75k, 73.3% for AGIs $75k-100k, 76.8% for AGIs $100k-200k, 62.7% for AGIs over 200k)
Taxable interest for individuals: $1,389 (reported on 27.9% of returns)
This zip code:
$1,389
Tennessee:
$1,732
(% of AGI for various income ranges: 0.9% for AGIs below $25k, 0.6% for AGIs $25k-50k, 0.9% for AGIs $50k-75k, 0.8% for AGIs $75k-100k, 1.0% for AGIs $100k-200k, 1.2% for AGIs over 200k)
Ordinary dividends: $4,414 (reported on 12.8% of returns)
Here:
$4,414
State:
$6,739
(% of AGI for various income ranges: 0.8% for AGIs below $25k, 0.5% for AGIs $25k-50k, 1.0% for AGIs $50k-75k, 0.9% for AGIs $75k-100k, 1.2% for AGIs $100k-200k, 3.7% for AGIs over 200k)
Net capital gain/loss in AGI: +$4,848 (reported on 10.7% of returns)
Here:
+$4,848
State:
+$19,082
(% of AGI for various income ranges: 0.6% for AGIs $50k-75k, 1.0% for AGIs $75k-100k, 1.4% for AGIs $100k-200k, 4.5% for AGIs over 200k)
Profit/loss from business: +$15,166 (reported on 13.6% of returns)
Here:
+$15,166
State:
+$15,240
(% of AGI for various income ranges: 7.3% for AGIs below $25k, 3.2% for AGIs $25k-50k, 2.3% for AGIs $50k-75k, 4.3% for AGIs $75k-100k, 4.4% for AGIs $100k-200k, 8.5% for AGIs over 200k)
Taxable individual retirement arrangement distribution: $14,665 (reported on 8.2% of returns)
37601:
$14,665
Tennessee:
$15,505
(% of AGI for various income ranges: 2.2% for AGIs below $25k, 2.0% for AGIs $25k-50k, 2.5% for AGIs $50k-75k, 3.1% for AGIs $75k-100k, 2.8% for AGIs $100k-200k, 4.6% for AGIs over 200k)
Self-employment retirement plans: $22,283 (reported on 0.4% of returns)
37601:
$22,283
Tennessee:
$22,567
Total itemized deductions: $20,269 (20% of AGI, reported on 17.1% of returns)
Here:
$20,269
State:
$21,976
Here:
19.8% of AGI
State:
17.8% of AGI
(% of AGI for various income ranges: 5.1% for AGIs below $25k, 6.6% for AGIs $25k-50k, 8.2% for AGIs $50k-75k, 9.6% for AGIs $75k-100k, 10.8% for AGIs $100k-200k, 9.0% for AGIs over 200k)
Charity contributions: $6,178 (reported on 13.8% of returns)
Here:
$6,178
State:
$6,709
(% of AGI for various income ranges: 0.5% for AGIs below $25k, 1.0% for AGIs $25k-50k, 1.5% for AGIs $50k-75k, 2.5% for AGIs $75k-100k, 3.1% for AGIs $100k-200k, 3.5% for AGIs over 200k)
Taxes paid: $4,277 (reported on 16.9% of returns)
37601:
$4,277
State:
$4,829
(% of AGI for various income ranges: 0.7% for AGIs below $25k, 1.1% for AGIs $25k-50k, 1.5% for AGIs $50k-75k, 2.0% for AGIs $75k-100k, 2.6% for AGIs $100k-200k, 2.4% for AGIs over 200k)
Earned income credit: $2,102 (reported on 24.9% of returns)
Here:
$2,102
State:
$2,404
(% of AGI for various income ranges: 7.0% for AGIs below $25k, 1.2% for AGIs $25k-50k)
Percentage of individuals using paid preparers for their 2012 taxes: 47.6%
Here:
48%
State:
52%
(% for various income ranges: 44.6% for AGIs below $25k, 46.6% for AGIs $25k-50k, 48.9% for AGIs $50k-75k, 54.3% for AGIs $75k-100k, 56.4% for AGIs $100k-200k, 85.2% for AGIs over 200k)
Averages for the 2004 tax year for zip code 37601, filed in 2005:
Average Adjusted Gross Income (AGI) in 2004: $37,483 (Individual Income Tax Returns)
Here:
$37,483
State:
$44,088
Salary/wage: $32,465 (reported on 84.5% of returns)
Here:
$32,465
State:
$38,825
(% of AGI for various income ranges: 100.8% for AGIs below $10k, 78.0% for AGIs $10k-25k, 81.6% for AGIs $25k-50k, 80.4% for AGIs $50k-75k, 79.7% for AGIs $75k-100k, 55.6% for AGIs over 100k)
Taxable interest for individuals: $1,783 (reported on 37.3% of returns)
This zip code:
$1,783
Tennessee:
$1,802
(% of AGI for various income ranges: 3.5% for AGIs below $10k, 2.0% for AGIs $10k-25k, 1.6% for AGIs $25k-50k, 1.4% for AGIs $50k-75k, 1.6% for AGIs $75k-100k, 1.9% for AGIs over 100k)
Taxable dividends: $3,331 (reported on 17.1% of returns)
Here:
$3,331
State:
$3,727
(% of AGI for various income ranges: 2.6% for AGIs below $10k, 0.9% for AGIs $10k-25k, 0.7% for AGIs $25k-50k, 0.8% for AGIs $50k-75k, 1.7% for AGIs $75k-100k, 2.7% for AGIs over 100k)
Net capital gain/loss: +$14,215 (reported on 13.6% of returns)
Here:
+$14,215
State:
+$15,776
(% of AGI for various income ranges: 0.6% for AGIs below $10k, 0.3% for AGIs $10k-25k, 0.7% for AGIs $25k-50k, 0.7% for AGIs $50k-75k, 1.5% for AGIs $75k-100k, 15.1% for AGIs over 100k)
Profit/loss from business: +$11,651 (reported on 14.1% of returns)
Here:
+$11,651
State:
+$12,882
(% of AGI for various income ranges: 7.0% for AGIs below $10k, 4.9% for AGIs $10k-25k, 3.0% for AGIs $25k-50k, 3.1% for AGIs $50k-75k, 3.3% for AGIs $75k-100k, 6.2% for AGIs over 100k)
IRA payment deduction: $2,724 (reported on 2.0% of returns)
37601:
$2,724
Tennessee:
$2,934
(% of AGI for various income ranges: 0.2% for AGIs below $10k, 0.1% for AGIs $10k-25k, 0.2% for AGIs $25k-50k, 0.2% for AGIs $50k-75k, 0.2% for AGIs $75k-100k, 0.1% for AGIs over 100k)
Self-employed pension: $19,915 (reported on 0.4% of returns)
Here:
$19,915
Tennessee:
$16,857
Total itemized deductions: $16,582 (21% of AGI, reported on 19.4% of returns)
Here:
$16,582
State:
$18,035
Here:
20.9% of AGI
State:
19.9% of AGI
(% of AGI for various income ranges: 6.7% for AGIs below $10k, 5.2% for AGIs $10k-25k, 7.7% for AGIs $25k-50k, 9.7% for AGIs $50k-75k, 12.1% for AGIs $75k-100k, 9.0% for AGIs over 100k)
Charity contributions deductions: $5,108 (6% of AGI, reported on 16.2% of returns)
Here:
$5,108
State:
$5,167
Here:
6.0% of AGI
State:
5.3% of AGI
(% of AGI for various income ranges: 0.6% for AGIs below $10k, 0.8% for AGIs $10k-25k, 1.3% for AGIs $25k-50k, 1.9% for AGIs $50k-75k, 3.1% for AGIs $75k-100k, 3.5% for AGIs over 100k)
Total tax: $5,829 (reported on 71.7% of returns)
37601:
$5,829
State:
$7,482
(% of AGI for various income ranges: 3.1% for AGIs below $10k, 4.1% for AGIs $10k-25k, 7.1% for AGIs $25k-50k, 9.3% for AGIs $50k-75k, 11.2% for AGIs $75k-100k, 19.2% for AGIs over 100k)
Earned income credit: $1,658 (reported on 21.2% of returns)
Here:
$1,658
State:
$1,826
Percentage of individuals using paid preparers for their 2004 taxes: 56.6%
Here:
57%
State:
60%
(% for various income ranges: 52.9% for AGIs below $10k, 58.3% for AGIs $10k-25k, 56.2% for AGIs $25k-50k, 56.1% for AGIs $50k-75k, 53.1% for AGIs $75k-100k, 69.2% for AGIs over 100k)
Likely homosexual households (counted as self-reported same-sex unmarried-partner households)
Lesbian couples: 0.1% of all households
Gay men: 0.1% of all households
Household received Food Stamps/SNAP in the past 12 months: 2,520 Household did not receive Food Stamps/SNAP in the past 12 months: 14,887
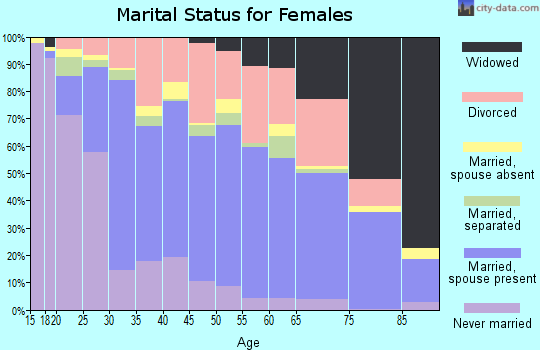
Women who had a birth in the past 12 months: 364 (242 now married, 121 unmarried) Women who did not have a birth in the past 12 months: 10,222 (3,891 now married, 6,330 unmarried)
Housing units in zip code 37601 with a mortgage: 4,846 (495 second mortgage, 387 both second mortgage and home equity loan) Houses without a mortgage: 132
Median monthly owner costs for units with a mortgage: $1,202 Median monthly owner costs for units without a mortgage: $380
Residents with income below the poverty level in 2022:
This zip code:
20.5%
Whole state:
13.3%
Residents with income below 50% of the poverty level in 2022:
This zip code:
10.9%
Whole state:
7.1%
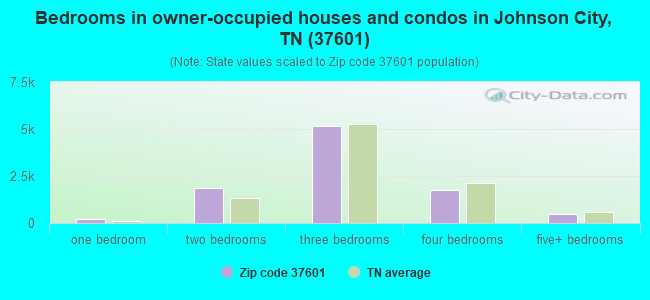
Median number of rooms in houses and condos:
Here:
6.4
State:
6.5
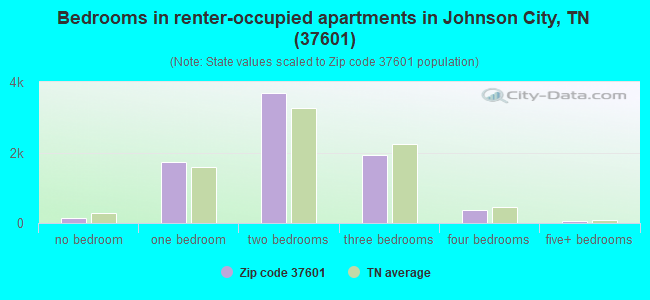
Median number of rooms in apartments:
Here:
4.3
State:
4.4
Notable locations in this zip code not listed on our city pages
Notable locations in zip code 37601: Knob Creek Boat Dock (A), Dry Creek Camp Ground (B), Smalling Crossroads (C), Brush Creek Sewage Treatment Plant (D), Johnson City Industrial Park (E), Johnson City Golf and Country Club (F), Tipton-Haynes Farm (G), West Carter County Volunteer Fire Department (H), James H and Cecile C Quillen Rehabilitation Hospital (I), Johnson City Fire Department Station 9 (J), Watauga Avenue Fire Station (K), Johnson City Fire Department Station 5 (L), Indian Ridge Fire Station (M), Johnson City Fire Department Station 3 Headquarters (N), Central Community Volunteer Fire Department (O), Johnson City Fire Department Station 1 (P), Washington County / Johnson City EMS (Q). Display/hide their locations on the map
Shopping Centers: Center South Shopping Center (1), Creekside Shopping Center (2), Holiday Shopping Center (3), Johnson City Plaza Shopping Center (4), Kens Plaza Shopping Center (5), King Springs Shopping Center (6), Miracle Mall Shopping Center (7). Display/hide their locations on the map
Churches in zip code 37601 include: College Park Freewill Baptist Church (A), Harbor Light Baptist Church (B), Union Church (C), Sinking Creek Church (D), Westside Church (E), Anderson Chapel (F), Watauga Avenue Presbyterian Church (G), Unaka Baptist Church (H), Thankful Baptist Church (I). Display/hide their locations on the map
Cemeteries: Wolfe Cemetery (1), White Cemetery (2), Tipton-Haynes Cemetery (3), Tipton Cemetery (4), Reasoner Cemetery (5), Range Cemetery (6), Phillips Cemetery (7). Display/hide their locations on the map
Streams, rivers, and creeks: Sinking Creek (A), Toll Branch (B), Brush Creek (C), Buffalo Creek (D), Catbird Creek (E), Cobb Creek (F), Dry Creek (G), Knob Creek (H), Pugh Branch (I). Display/hide their locations on the map
Parks in zip code 37601 include: Lions Field (1), Civitan Park (2), Jaycee Park (3), Memorial Park (4), Lakeview Park (5), Lions Park (6), Rotary Park (7), Spurrier Field (8). Display/hide their locations on the map
3,766 married couples with children.
2,535 single-parent households (321 men, 2,214 women).
92.9% of residents of 37601 zip code speak English at home.
3.7% of residents speak Spanish at home (51% very well, 16% well, 28% not well, 4% not at all).
0.6% of residents speak other Indo-European language at home (75% very well, 25% well).
0.6% of residents speak Asian or Pacific Island language at home (70% very well, 15% well, 6% not well, 9% not at all).
2.2% of residents speak other language at home (66% very well, 17% well, 17% not well).
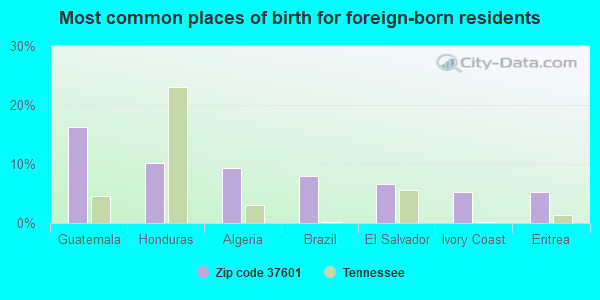
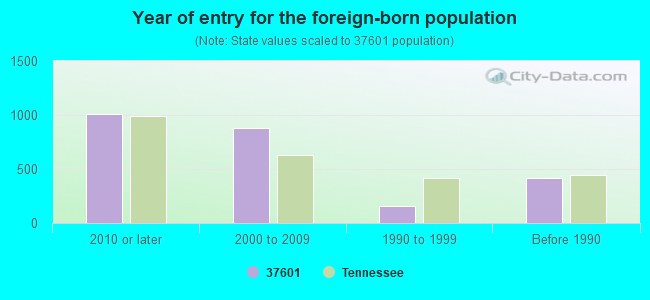
Foreign born population: 2,221 (5.7%) (28.0% of them are naturalized citizens)
Major facilities with environmental interests located in this zip code:
DOUGLAS DYNAMICS L L C (915 RIVERVIEW DR., SUITE 2 in JOHNSON CITY, TN)
AIR MINOR (AIRS/AFS) CRITERIA AND HAZARDOUS AIR POLLUTANT INVENTORY (Inventory of air pollution sources) HAZARDOUS WASTE BIENNIAL REPORTER (Resource Conservation and Recovery Act (tracking hazardous waste)) (Resource Conservation and Recovery Act (tracking hazardous waste)) TRI REPORTER (Tracking of toxic chemicals releasing facilities) Business SIC classification: MISCELLANEOUS STRUCTURAL METALWORK; CONSTRUCTION MACHINERY AND EQUIPMENT Organizations: JAMES R ROETHLE (CONTACT/OPERATOR)
, AK STEEL CORPORATION (CONTACT/OWNER)
, DOUGLAS DYNAMICS HOLDINGS INC (CONTACT/OWNER)
Alternative names: DOUGLAS DYNAMICS, LLC, FLOUR CITY ARCHITECTURAL METAL
CENTRAL ELEMENTARY SCHOOL (252 TAYLOR TOWN RD in JOHNSON CITY, TN)
(Geographic Names Information System) (National Center for Education Statistics) - STATE ID-0005 Organizations: CARTER COUNTY SCHOOL DISTRICT (SCHOOL DISTRICT)
AMERICAN WATER HEATER INCORPORATED (1100 EAST FAIRVIEW AVENUE in JOHNSON CITY, TN)
AIR SYNTHETIC MINOR (AIRS/AFS) CRITERIA AND HAZARDOUS AIR POLLUTANT INVENTORY (Inventory of air pollution sources) HAZARDOUS WASTE BIENNIAL REPORTER (Resource Conservation and Recovery Act (tracking hazardous waste)) Small Quantity Generators, between 100 kg and 1000 kg of hazardous waste/month (Resource Conservation and Recovery Act (tracking hazardous waste)) TRI REPORTER (Tracking of toxic chemicals releasing facilities) Business SIC classification: HOUSEHOLD APPLIANCES Business NAICS classification: OTHER MAJOR HOUSEHOLD APPLIANCE MANUFACTURING. Organizations: ANDREW M. DEMSKI (CONTACT/OPERATOR)
, SOUTHCORP USA INC (CONTACT/OWNER)
, AMERICAN WATER HEATER HOLDINGS, INC. (CONTACT/OWNER)
Alternative names: AMERICAN WATER HEATER GROUP
DECANTER MACHINE, INC. (3622 BRISTOL HWY in JOHNSON CITY, TN)
AIR MINOR (AIRS/AFS) Small Quantity Generators, between 100 kg and 1000 kg of hazardous waste/month (Resource Conservation and Recovery Act (tracking hazardous waste)) - notification Business SIC classification: FABRICATED METAL PRODUCTS Business NAICS classification: ALL OTHER MISCELLANEOUS GENERAL PURPOSE MACHINERY MANUFACTURING. Organizations: LARRY L LOVEGROVE (CONTACT/OPERATOR)
, SANDY POWELL, CEO (CONTACT/OWNER)
CANTECH INDUSTRIES INCORPORATED (2222 EDDIE WILLIAMS RD. in JOHNSON CITY, TN)
AIR MAJOR (AIRS/AFS) CRITERIA AND HAZARDOUS AIR POLLUTANT INVENTORY (Inventory of air pollution sources) Small Quantity Generators, between 100 kg and 1000 kg of hazardous waste/month (Resource Conservation and Recovery Act (tracking hazardous waste)) - notification TRI REPORTER (Tracking of toxic chemicals releasing facilities) Business SIC classification: PACKAGING PAPER AND PLASTICS FILM, COATED AND LAMINATED; COATED AND LAMINATED PAPER; PLASTICS, FOIL, AND COATED PAPER BAGS; UNSUPPORTED PLASTICS FILM AND SHEET Business NAICS classification: COATED AND LAMINATED PAPER MANUFACTURING.; COATED AND LAMINATED PAPER MANUFACTURING. Organizations: MARK PATTON, PLANT MANAGER (CONTACT/OPERATOR)
, LEONARD COHEN (CONTACT/OWNER)
CONCORD CUSTOM CLEANERS (809 NORTH ROAN STREET in JOHNSON CITY, TN)
AIR MINOR (AIRS/AFS) Small Quantity Generators, between 100 kg and 1000 kg of hazardous waste/month (Resource Conservation and Recovery Act (tracking hazardous waste)) - notification Business SIC classification: COIN-OPERATED LAUNDRIES AND DRYCLEANING Organizations: STORE MGR (CONTACT/OPERATOR)
Alternative names: CONCORD CUSTOM CLEANERS #032
COLUMBUS ELECTRIC MANUFACTURING COMPANY (135 WESLEY ST in JOHNSON CITY, TN)
AIR SYNTHETIC MINOR (AIRS/AFS) (Resource Conservation and Recovery Act (tracking hazardous waste)) Business SIC classification: ELECTRICAL MACHINERY, EQUIPMENT, AND SUPPLIES Business NAICS classification: AUTOMATIC ENVIRONMENTAL CONTROL MANUFACTURING FOR RESIDENTIAL, COMMERCIAL, AND APPLIANCE USE. Organizations: GARY HART (CONTACT/OPERATOR)
, R E HENRY SR (CONTACT/OWNER)
AD-MAT INTERNATIONAL COASTERS USA INC. (2205 EDDIE WILLIAMS ROAD in JOHNSON CITY, TN)
(Resource Conservation and Recovery Act (tracking hazardous waste)) Business NAICS classification: QUICK PRINTING. Organizations: MICHAEL ELBERS (CONTACT/OPERATOR)
CITY OF JOHNSON CITY, WATER DEPARTMENT (MASTERS KNOB RESERVOIR in JOHNSON CITY, TN)
(Resource Conservation and Recovery Act (tracking hazardous waste)) Organizations: JIM SIPE (CONTACT/OPERATOR)
CLUTCH & BRAKE SUPPLY CO. INC. (2909 EAST OAKLAND AVENUE in JOHNSON CITY, TN)
(Resource Conservation and Recovery Act (tracking hazardous waste)) Organizations: MUREL E. MATHELY (CONTACT/OPERATOR)
, MUREL E. MATHERLY (CONTACT/OWNER)
CITY OF JOHNSON CITY, WATER DEPARTMENT (CHEROKEE RESERVOIR in JOHNSON CITY, TN)
(Resource Conservation and Recovery Act (tracking hazardous waste)) Organizations: JIM SIPE (CONTACT/OPERATOR)
BACHMAN-RULE TOYOTA INC. (3200 BRISTOL HIGHWAY in JOHNSON CITY, TN)
(Resource Conservation and Recovery Act (tracking hazardous waste)) Business NAICS classification: GENERAL AUTOMOTIVE REPAIR. Organizations: PHILLIP M. BACHMAN & JAMES RULE (CONTACT/OWNER)
CITY OF JOHNSON CITY WATER DEPARTMENT (WEST HILLS RESERVOIR in JOHNSON CITY, TN)
(Resource Conservation and Recovery Act (tracking hazardous waste)) Organizations: CITY OF JOHNSON CITY, WATER DEPARTMENT (CONTACT/OWNER)
Housing units lacking complete plumbing facilities: 2.1% Housing units lacking complete kitchen facilities: 3.2%
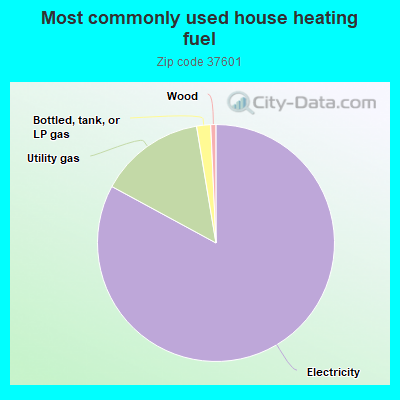
82.5%Electricity
14.4%Utility gas
1.9%Bottled, tank, or LP gas
0.7%Wood
Population in 1990: 27,978. Population change in the 1990s: +5,515 (+19.7%).
Place of birth for U.S.-born residents:
This state: 23,006
Northeast: 1,974
Midwest: 2,476
South: 7,465
West: 1,541
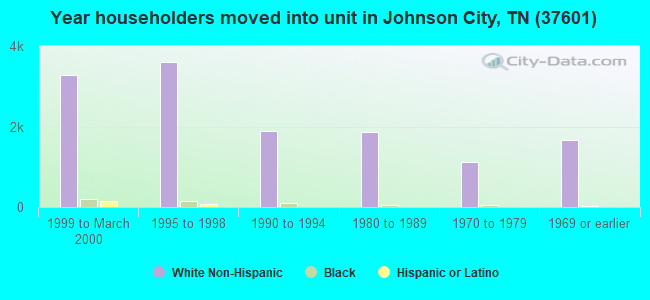
50% of the 37601 zip code residents lived in the same house 5 years ago. Out of people who lived in different houses, 46% lived in this county. Out of people who lived in different counties, 50% lived in Tennessee.
86% of the 37601 zip code residents lived in the same house 1 year ago. Out of people who lived in different houses, 41% moved from this county. Out of people who lived in different houses, 27% moved from different county within same state. Out of people who lived in different houses, 24% moved from different state. Out of people who lived in different houses, 8% moved from abroad.
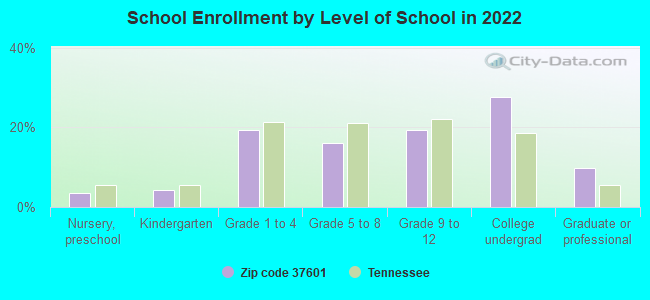
Private vs. public school enrollment:
Students in private schools in grades 1 to 8 (elementary and middle school): 393
Here:
12.5%
Tennessee:
15.0%
Students in private schools in grades 9 to 12 (high school): 169
Here:
9.9%
Tennessee:
16.2%
Students in private undergraduate colleges: 360
Here:
14.6%
Tennessee:
23.5%
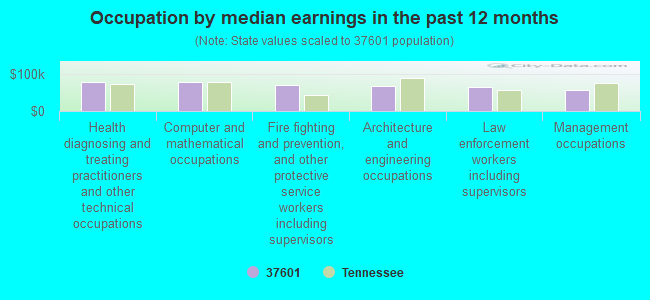
Occupation by median earnings in the past 12 months ($)
78,585Health diagnosing and treating practitioners and other technical occupations
76,273Computer and mathematical occupations
68,297Fire fighting and prevention, and other protective service workers including supervisors
66,475Architecture and engineering occupations
65,217Law enforcement workers including supervisors
57,294Management occupations
Companies with biggest federal contracts located in this zip code (JOHNSON CITY, TN):
QUALITY SAFETY PRODUCTS INC (312 EAST MAIN STREET; small business) : $503,325 in 14 contractsfrom 2004 to 2006
Contracts for Flags and Pennants by Defense Logistics Agency Signed by year:2000: $0; 2001: $0; 2002: $0; 2003: $0; 2004: $430,755; 2005: $24,500; 2006: $48,070.
Biggest contracts:
$215,750 with Defense Logistics Agency for Flags and Pennants. Signed on 2004-07-08. Completion date: 2005-06-05.
$77,400, same as above.Signed on 2004-07-29. Completion date: 2005-06-26.
$55,405, same as above.Signed on 2004-01-20. Completion date: 2004-12-13.
$41,900, same as above.Signed on 2004-09-30. Completion date: 2005-08-01.
TYSINGER HAMPTON & PARTNERS IN (3428 BRISTOL HWY) : $308,468 in 5 contractsfrom 1999 to 2000
Contracts for Architect - Engineer Services (including landscaping, interior layout, and designing) by U.S. Army Corps of Engineers - civil program financing only, Department of Veterans Affairs Signed by year:2000: $251,000; 2001: $0; 2002: $0; 2003: $0; 2004: $0; 2005: $0; 2006: $0.
Biggest contracts:
$102,000 with U.S. Army Corps of Engineers - civil program financing only for Architect - Engineer Services (including landscaping, interior layout, and designing). Signed on 2000-07-20. Completion date: 2000-10-20.
$102,000, same as above.Signed on 2000-07-19. Completion date: 2000-10-20.
$47,000 with Department of Veterans Affairs for Architect - Engineer Services (including landscaping, interior layout, and designing). Signed on 2000-07-15. Completion date: 2000-12-15.
$34,971 with U.S. Army Corps of Engineers - civil program financing only for Architect - Engineer Services (including landscaping, interior layout, and designing). Signed on 1999-11-03. Completion date: 2000-01-15.
WESLEY COURT DEVELOPMENT (2513 WESLEY STREET; small business) : $164,535 in 17 contractsfrom 2003 to 2006
Contracts for Lease or Rental of Facilities -- Office Buildings by Public Buildings Service Signed by year:2000: $0; 2001: $0; 2002: $0; 2003: $0; 2004: $30,861; 2005: $92,526; 2006: $41,148.
Biggest contracts:
$10,287 with Public Buildings Service for Lease or Rental of Facilities -- Office Buildings. Signed on 2006-04-01. Completion date: 2006-09-30.
$10,287, same as above.Signed on 2006-04-01. Completion date: 2006-09-30.
$10,287, same as above.Signed on 2006-07-01. Completion date: 2006-09-30.
$10,287, same as above.Signed on 2006-04-01. Completion date: 2006-09-30.
AMSOUTH BANK (1212 E WATAUGA & BROADWAY; small business) : $141,795 in 14 contractsfrom 2003 to 2005
Contracts for Lease or Rental of Facilities -- Office Buildings, Electric Services by Public Buildings Service Signed by year:2000: $0; 2001: $0; 2002: $0; 2003: $126,972; 2004: $13,048; 2005: $1,775; 2006: $0.
Biggest contracts:
$13,048 with Public Buildings Service for Lease or Rental of Facilities -- Office Buildings. Signed on 2004-10-01. Completion date: 2004-10-31.
$10,581, same as above.Signed on 2003-12-01. Completion date: 2004-07-31.
$10,581, same as above.Signed on 2003-12-01. Completion date: 2004-07-31.
$10,581, same as above.Signed on 2003-12-01. Completion date: 2004-07-31.
WILLIAMS, DANNA CHRIS (400 E STATE OF FRANKLIN R; small business) : $92,280 in 12 contractsfrom 2001 to 2003
Contracts for Other Special Studies and Analyses by Consumer Product Safety Commission Signed by year:2000: $0; 2001: $68,000; 2002: $48,059; 2003: -$23,779; 2004: $0; 2005: $0; 2006: $0.
Biggest contracts:
$36,000 with Consumer Product Safety Commission for Other Special Studies and Analyses. Signed on 2002-04-15. Completion date: 2002-09-15.
$36,000, same as above.Signed on 2001-10-15. Completion date: 2002-09-15.
$28,000, same as above.Signed on 2001-04-15. Completion date: 2001-09-15.
$23,779, same as above.Signed on 2002-12-15. Completion date: 2003-09-15.
BEST WESTERN HOTEL & CONFERENC (2406 N ROAN ST; small business) : $48,151 in 2 contractsfrom 2004 to 2005
$44,935 with Army for Lodging - Hotel/Motel. Signed on 2004-10-07. Completion date: 2004-10-23.
$3,216, same as above.Signed on 2005-09-24. Completion date: 2005-09-30.
THE HOUSE OF RIBS RESTAURANT (3100 NORTH RD; small business)
$38,000 with Forest Service (disused code: now 12C2) for Food Services. Signed on 2000-12-15. Completion date: 2000-12-15.
HOMETECH INDUSTRIES GROUP, INC (2507 PLYMOUTH RD; small business)
$37,875 with Army for Scaffolding Equipment and Concrete Forms. Signed on 2005-06-15. Completion date: 2005-07-29.
MARY'S SALADS & PRODUCE (349 AUSTIN SPRINGS RD; small business) : $9,765 in 3 contractsin 2005
$3,904 with Defense Logistics Agency for Fruits and Vegetables. Signed on 2005-07-02. Completion date: 2005-07-02.
$3,135, same as above.Signed on 2005-06-12. Completion date: 2005-06-12.
$2,726, same as above.Signed on 2005-05-08. Completion date: 2005-05-08.
TCT (2406 N ROAN ST; small business)
$4,440 with Navy for Food Services. Signed on 2005-09-29. Completion date: 2005-10-01.
Top industries in this zip code by the number of employees in 2005:
Administrative and Support and Waste Management and Remediation Services: Temporary Help Services (500-999: 1, 50-99: 1, 20-49: 1, 10-19: 2, 5-9: 1, 1-4: 4)
Health Care and Social Assistance: Offices of Physicians (except Mental Health Specialists) (250-499: 1, 100-249: 1, 50-99: 2, 20-49: 3, 10-19: 1, 5-9: 10, 1-4: 13)
Information: Cellular and Other Wireless Telecommunications (500-999: 1, 10-19: 1, 5-9: 4, 1-4: 1)
Real Estate and Rental and Leasing: Residential Property Managers (500-999: 1, 10-19: 2, 5-9: 1, 1-4: 1)
People in group quarters in 2010:
355 people in nursing facilities/skilled-nursing facilities
104 people in local jails and other municipal confinement facilities
92 people in other noninstitutional facilities
20 people in group homes intended for adults
11 people in correctional facilities intended for juveniles
People in group quarters in 2000:
505 people in college dormitories (includes college quarters off campus)
285 people in nursing homes
56 people in other noninstitutional group quarters
44 people in local jails and other confinement facilities (including police lockups)
33 people in homes for the mentally ill
19 people in homes for the mentally retarded
16 people in short-term care, detention or diagnostic centers for delinquent children
13 people in unknown juvenile institutions
7 people in other group homes
5 people in orthopedic wards and institutions for the physically handicapped
Fatal accident statistics in 2014:
Fatal accident count: 1
Vehicles involved in fatal accidents: 2
Fatal accidents caused by drunken drivers: 0
Fatalities: 1
Persons involved in fatal accidents: 2
Pedestrians involved in fatal accidents: 0
Fatal accident statistics in 2013:
Fatal accident count: 6
Vehicles involved in fatal accidents: 7
Fatal accidents caused by drunken drivers: 2
Fatalities: 7
Persons involved in fatal accidents: 10
Pedestrians involved in fatal accidents: 1
Home Mortgage Disclosure Act Aggregated Statistics For Year 2009 (Based on 7 full and 18 partial tracts)
A) FHA, FSA/RHS & VA Home Purchase Loans
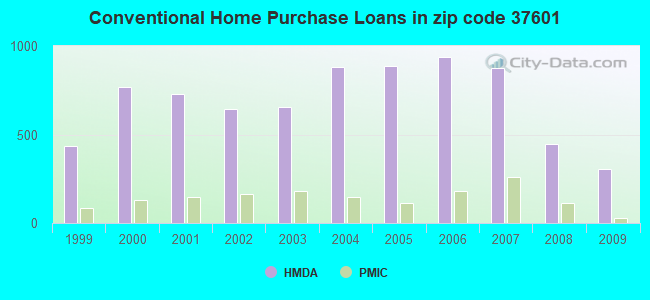
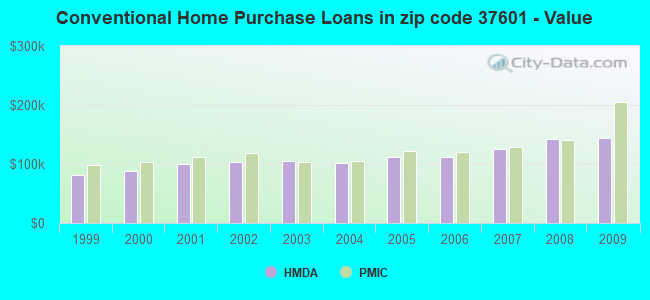
B) Conventional Home Purchase Loans
C) Refinancings
D) Home Improvement Loans
E) Loans on Dwellings For 5+ Families
F) Non-occupant Loans on < 5 Family Dwellings (A B C & D)
G) Loans On Manufactured Home Dwelling (A B C & D)
Number
Average Value
Number
Average Value
Number
Average Value
Number
Average Value
Number
Average Value
Number
Average Value
Number
Average Value
LOANS ORIGINATED
163
$113,912
304
$143,515
920
$143,950
84
$71,947
17
$885,266
121
$107,571
34
$47,600
APPLICATIONS APPROVED, NOT ACCEPTED
9
$106,459
15
$100,658
92
$132,086
4
$32,083
0
$0
5
$110,354
4
$43,198
APPLICATIONS DENIED
30
$114,715
67
$111,592
306
$131,533
34
$41,313
2
$20,985
43
$90,652
25
$55,515
APPLICATIONS WITHDRAWN
18
$132,115
24
$135,650
148
$157,643
10
$83,374
0
$0
9
$139,114
3
$51,480
FILES CLOSED FOR INCOMPLETENESS
8
$132,242
7
$107,970
39
$140,311
4
$91,558
1
$800,000
2
$91,440
2
$58,925
Aggregated Statistics For Year 2008 (Based on 7 full and 18 partial tracts)
A) FHA, FSA/RHS & VA Home Purchase Loans
B) Conventional Home Purchase Loans
C) Refinancings
D) Home Improvement Loans
E) Loans on Dwellings For 5+ Families
F) Non-occupant Loans on < 5 Family Dwellings (A B C & D)
G) Loans On Manufactured Home Dwelling (A B C & D)
Number
Average Value
Number
Average Value
Number
Average Value
Number
Average Value
Number
Average Value
Number
Average Value
Number
Average Value
LOANS ORIGINATED
134
$121,779
449
$141,628
550
$118,945
85
$64,589
18
$713,478
175
$103,561
28
$67,037
APPLICATIONS APPROVED, NOT ACCEPTED
9
$139,679
49
$133,273
56
$91,868
10
$30,605
0
$0
7
$139,157
7
$66,603
APPLICATIONS DENIED
48
$115,154
75
$136,159
370
$112,336
60
$57,830
0
$0
34
$90,876
35
$78,100
APPLICATIONS WITHDRAWN
12
$122,864
40
$120,819
150
$146,582
17
$59,930
2
$162,315
10
$143,228
5
$53,224
FILES CLOSED FOR INCOMPLETENESS
5
$148,274
9
$106,666
23
$150,723
3
$79,657
0
$0
5
$157,780
0
$0
Aggregated Statistics For Year 2007 (Based on 7 full and 18 partial tracts)
A) FHA, FSA/RHS & VA Home Purchase Loans
B) Conventional Home Purchase Loans
C) Refinancings
D) Home Improvement Loans
E) Loans on Dwellings For 5+ Families
F) Non-occupant Loans on < 5 Family Dwellings (A B C & D)
G) Loans On Manufactured Home Dwelling (A B C & D)
Number
Average Value
Number
Average Value
Number
Average Value
Number
Average Value
Number
Average Value
Number
Average Value
Number
Average Value
LOANS ORIGINATED
57
$111,981
875
$125,129
609
$112,276
114
$48,391
12
$647,338
233
$105,281
59
$71,229
APPLICATIONS APPROVED, NOT ACCEPTED
9
$99,197
113
$138,197
100
$115,237
10
$30,604
0
$0
32
$100,133
14
$51,061
APPLICATIONS DENIED
31
$93,019
161
$113,538
444
$114,947
78
$44,948
0
$0
39
$103,014
57
$54,780
APPLICATIONS WITHDRAWN
9
$123,821
75
$125,500
207
$116,125
32
$86,421
0
$0
20
$128,322
4
$34,582
FILES CLOSED FOR INCOMPLETENESS
2
$199,755
25
$120,745
76
$164,629
2
$169,950
0
$0
3
$179,073
0
$0
Aggregated Statistics For Year 2006 (Based on 7 full and 18 partial tracts)
A) FHA, FSA/RHS & VA Home Purchase Loans
B) Conventional Home Purchase Loans
C) Refinancings
D) Home Improvement Loans
E) Loans on Dwellings For 5+ Families
F) Non-occupant Loans on < 5 Family Dwellings (A B C & D)
G) Loans On Manufactured Home Dwelling (A B C & D)
Number
Average Value
Number
Average Value
Number
Average Value
Number
Average Value
Number
Average Value
Number
Average Value
Number
Average Value
LOANS ORIGINATED
68
$103,232
939
$111,641
660
$101,016
121
$32,334
13
$424,770
222
$79,536
74
$50,220
APPLICATIONS APPROVED, NOT ACCEPTED
7
$134,217
170
$92,612
129
$122,882
16
$39,258
0
$0
33
$68,564
33
$56,754
APPLICATIONS DENIED
21
$61,999
251
$83,854
484
$102,820
89
$46,426
0
$0
80
$74,226
102
$54,673
APPLICATIONS WITHDRAWN
7
$100,240
95
$107,821
262
$111,339
40
$70,522
0
$0
19
$64,390
3
$68,763
FILES CLOSED FOR INCOMPLETENESS
1
$120,000
30
$98,289
67
$116,849
4
$27,460
0
$0
2
$64,855
0
$0
Aggregated Statistics For Year 2005 (Based on 7 full and 18 partial tracts)
A) FHA, FSA/RHS & VA Home Purchase Loans
B) Conventional Home Purchase Loans
C) Refinancings
D) Home Improvement Loans
E) Loans on Dwellings For 5+ Families
F) Non-occupant Loans on < 5 Family Dwellings (A B C & D)
G) Loans On Manufactured Home Dwelling (A B C & D)
Number
Average Value
Number
Average Value
Number
Average Value
Number
Average Value
Number
Average Value
Number
Average Value
Number
Average Value
LOANS ORIGINATED
50
$112,235
886
$111,926
747
$103,008
115
$48,283
29
$1,356,786
201
$91,425
59
$49,566
APPLICATIONS APPROVED, NOT ACCEPTED
6
$94,628
150
$92,193
169
$83,091
8
$49,036
0
$0
16
$89,844
35
$59,583
APPLICATIONS DENIED
11
$68,205
247
$68,519
597
$95,107
74
$40,112
2
$155,000
57
$73,679
117
$59,487
APPLICATIONS WITHDRAWN
2
$53,345
116
$100,664
373
$111,620
22
$111,675
1
$175,640
21
$106,790
9
$55,158
FILES CLOSED FOR INCOMPLETENESS
0
$0
31
$84,177
46
$102,788
3
$57,333
0
$0
10
$109,150
0
$0
Aggregated Statistics For Year 2004 (Based on 7 full and 18 partial tracts)
A) FHA, FSA/RHS & VA Home Purchase Loans
B) Conventional Home Purchase Loans
C) Refinancings
D) Home Improvement Loans
E) Loans on Dwellings For 5+ Families
F) Non-occupant Loans on < 5 Family Dwellings (A B C & D)
G) Loans On Manufactured Home Dwelling (A B C & D)
Number
Average Value
Number
Average Value
Number
Average Value
Number
Average Value
Number
Average Value
Number
Average Value
Number
Average Value
LOANS ORIGINATED
51
$97,712
882
$101,939
877
$106,464
123
$27,143
17
$460,605
212
$81,146
89
$42,920
APPLICATIONS APPROVED, NOT ACCEPTED
2
$47,820
135
$76,929
174
$87,974
17
$39,581
0
$0
27
$57,370
51
$47,608
APPLICATIONS DENIED
21
$56,576
228
$74,736
559
$82,969
83
$38,555
0
$0
40
$59,689
109
$51,735
APPLICATIONS WITHDRAWN
4
$61,958
97
$100,339
364
$103,739
28
$37,484
2
$2,540,125
20
$95,848
21
$87,092
FILES CLOSED FOR INCOMPLETENESS
1
$74,000
28
$105,274
31
$130,050
2
$24,420
0
$0
2
$65,330
0
$0
Aggregated Statistics For Year 2003 (Based on 7 full and 18 partial tracts)
A) FHA, FSA/RHS & VA Home Purchase Loans
B) Conventional Home Purchase Loans
C) Refinancings
D) Home Improvement Loans
E) Loans on Dwellings For 5+ Families
F) Non-occupant Loans on < 5 Family Dwellings (A B C & D)
Number
Average Value
Number
Average Value
Number
Average Value
Number
Average Value
Number
Average Value
Number
Average Value
LOANS ORIGINATED
43
$99,210
658
$105,645
1,528
$95,952
108
$22,746
3
$1,146,990
225
$65,993
APPLICATIONS APPROVED, NOT ACCEPTED
4
$142,968
78
$73,834
269
$77,841
16
$21,726
1
$1,000,000
22
$67,010
APPLICATIONS DENIED
10
$89,769
196
$63,284
653
$85,808
75
$24,752
0
$0
34
$62,868
APPLICATIONS WITHDRAWN
15
$96,094
90
$96,035
295
$101,278
5
$30,074
0
$0
20
$81,869
FILES CLOSED FOR INCOMPLETENESS
1
$79,000
8
$96,512
51
$101,987
4
$25,950
0
$0
6
$79,503
Aggregated Statistics For Year 2002 (Based on 7 full and 18 partial tracts)
A) FHA, FSA/RHS & VA Home Purchase Loans
B) Conventional Home Purchase Loans
C) Refinancings
D) Home Improvement Loans
E) Loans on Dwellings For 5+ Families
F) Non-occupant Loans on < 5 Family Dwellings (A B C & D)
Number
Average Value
Number
Average Value
Number
Average Value
Number
Average Value
Number
Average Value
Number
Average Value
LOANS ORIGINATED
69
$84,370
643
$103,242
1,109
$93,833
115
$19,578
8
$637,680
148
$76,111
APPLICATIONS APPROVED, NOT ACCEPTED
10
$75,995
130
$77,303
204
$67,993
9
$26,509
0
$0
23
$55,090
APPLICATIONS DENIED
17
$73,282
275
$55,769
520
$75,896
62
$15,949
0
$0
30
$62,138
APPLICATIONS WITHDRAWN
12
$72,382
84
$85,485
227
$87,917
13
$13,908
0
$0
17
$59,970
FILES CLOSED FOR INCOMPLETENESS
0
$0
21
$84,030
42
$90,756
0
$0
0
$0
0
$0
Aggregated Statistics For Year 2001 (Based on 7 full and 18 partial tracts)
A) FHA, FSA/RHS & VA Home Purchase Loans
B) Conventional Home Purchase Loans
C) Refinancings
D) Home Improvement Loans
E) Loans on Dwellings For 5+ Families
F) Non-occupant Loans on < 5 Family Dwellings (A B C & D)
Number
Average Value
Number
Average Value
Number
Average Value
Number
Average Value
Number
Average Value
Number
Average Value
LOANS ORIGINATED
80
$82,702
727
$100,088
998
$86,386
137
$22,514
13
$1,431,832
131
$81,723
APPLICATIONS APPROVED, NOT ACCEPTED
5
$130,102
168
$45,336
136
$73,465
21
$21,654
2
$159,995
9
$68,352
APPLICATIONS DENIED
20
$73,744
502
$48,289
564
$69,260
48
$13,592
1
$59,540
46
$45,027
APPLICATIONS WITHDRAWN
6
$91,037
111
$75,826
268
$81,402
23
$20,271
0
$0
13
$66,645
FILES CLOSED FOR INCOMPLETENESS
2
$81,410
13
$92,290
43
$79,656
0
$0
0
$0
4
$94,055
Aggregated Statistics For Year 2000 (Based on 7 full and 18 partial tracts)
A) FHA, FSA/RHS & VA Home Purchase Loans
B) Conventional Home Purchase Loans
C) Refinancings
D) Home Improvement Loans
E) Loans on Dwellings For 5+ Families
F) Non-occupant Loans on < 5 Family Dwellings (A B C & D)
Number
Average Value
Number
Average Value
Number
Average Value
Number
Average Value
Number
Average Value
Number
Average Value
LOANS ORIGINATED
58
$82,789
767
$87,627
439
$67,153
111
$17,161
9
$309,427
118
$60,744
APPLICATIONS APPROVED, NOT ACCEPTED
41
$45,153
167
$52,210
112
$58,765
38
$20,770
0
$0
16
$45,821
APPLICATIONS DENIED
77
$50,321
547
$42,638
378
$59,210
66
$21,009
1
$230,000
22
$67,563
APPLICATIONS WITHDRAWN
14
$58,349
115
$61,900
199
$60,601
12
$28,395
2
$259,700
21
$49,310
FILES CLOSED FOR INCOMPLETENESS
2
$96,205
22
$65,940
29
$62,020
1
$5,000
0
$0
0
$0
Aggregated Statistics For Year 1999 (Based on 5 full and 9 partial tracts)
A) FHA, FSA/RHS & VA Home Purchase Loans
B) Conventional Home Purchase Loans
C) Refinancings
D) Home Improvement Loans
E) Loans on Dwellings For 5+ Families
F) Non-occupant Loans on < 5 Family Dwellings (A B C & D)
2002 - 2018 National Fire Incident Reporting System (NFIRS) incidents
Based on the data from the years 2002 - 2018 the average number of fires per year is 223. The highest number of reported fire incidents - 329 took place in 2007, and the least - 118 in 2011. The data has a growing trend.
When looking into fire subcategories, the most incidents belonged to: Structure Fires (40.4%), and Outside Fires (39.1%).
Fire incident types reported to NFIRS in Zip Code 37601


 Nearest zip codes: 37682, 37694, 37614, 37604, 37686, 37692.
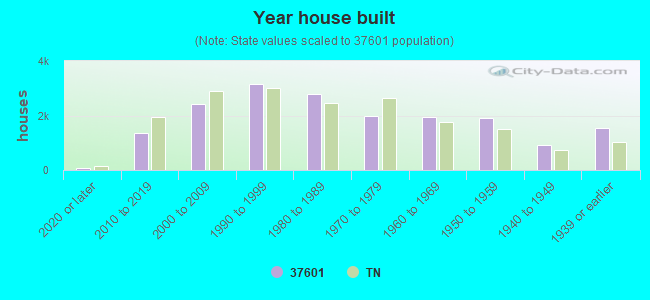


 Based on the data from the years 2002 - 2018 the average number of fires per year is 223. The highest number of reported fire incidents - 329 took place in 2007, and the least - 118 in 2011. The data has a growing trend.
 When looking into fire subcategories, the most incidents belonged to: Structure Fires (40.4%), and Outside Fires (39.1%).