Estimated zip code population in 2022: 14,142 Zip code population in 2010: 12,931 Zip code population in 2000: 12,627
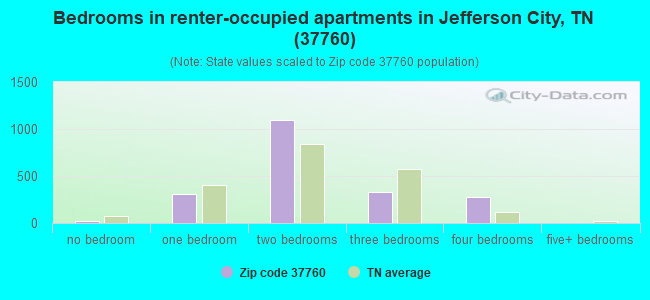
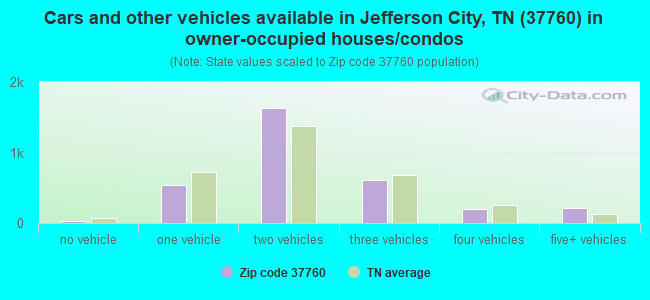
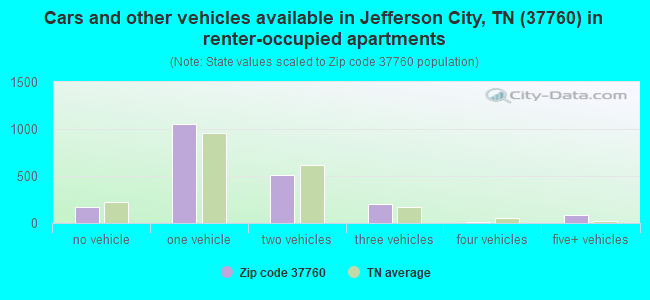
Houses and condos: 5,849 Renter-occupied apartments: 2,019
% of renters here:
39%
State:
33%
March 2022 cost of living index in zip code 37760: 79.4 (low, U.S. average is 100)
Land area: 40.0 sq. mi. Water area: 2.9 sq. mi.
Population density: 354 people per square mile
(very low).
OSM Map
General Map
Google Map
MSN Map
OSM Map
General Map
Google Map
MSN Map
OSM Map
General Map
Google Map
MSN Map
OSM Map
General Map
Google Map
MSN Map
Please wait while loading the map...
Real estate property taxes paid for housing units in 2022:
This zip code:
0.5% ($1,191)
Tennessee:
0.5% ($1,376)
Median real estate property taxes paid for housing units with mortgages in 2022: $1,179 (0.5%) Median real estate property taxes paid for housing units with no mortgage in 2022: $1,222 (0.5%)
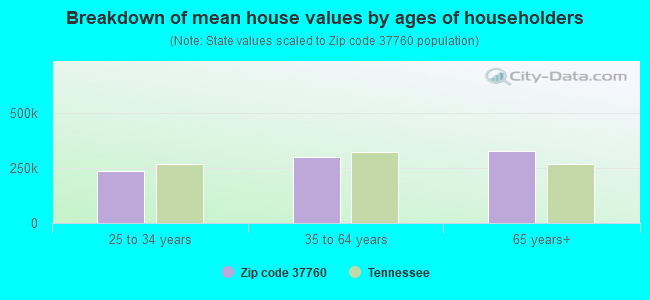
Estimated median house/condo value in 2022: $261,609
37760:
$261,609
Tennessee:
$284,800
According to our research of Tennessee and other state lists, there were 17 registered sex offenders living in 37760 zip code as of April 26, 2024. The ratio of all residents to sex offenders in zip code 37760 is 773 to 1. The ratio of registered sex offenders to all residents in this zip code is lower than the state average.
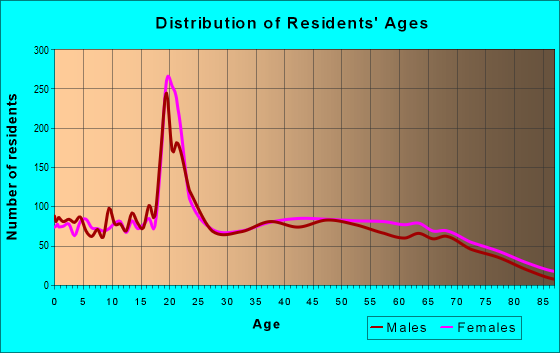
Median resident age:
This zip code:
36.9 years
Tennessee median age:
39.2 years
Average household size:
This zip code:
2.5 people
Tennessee:
2.4 people
Averages for the 2020 tax year for zip code 37760, filed in 2021:
Average Adjusted Gross Income (AGI) in 2020: $52,464 (Individual Income Tax Returns)
Here:
$52,464
State:
$69,014
Salary/wage: $43,603 (reported on 83.9% of returns)
Here:
$43,603
State:
$55,872
(% of AGI for various income ranges: 1169.5% for AGIs below $25k, 3441.8% for AGIs $25k-50k, 6291.4% for AGIs $50k-75k, 9634.8% for AGIs $75k-100k, 14636.5% for AGIs $100k-200k, 50265.0% for AGIs over 200k)
Taxable interest for individuals: $1,284 (reported on 24.1% of returns)
This zip code:
$1,284
Tennessee:
$1,945
(% of AGI for various income ranges: 15.6% for AGIs below $25k, 15.2% for AGIs $25k-50k, 28.3% for AGIs $50k-75k, 74.5% for AGIs $75k-100k, 155.4% for AGIs $100k-200k, 785.0% for AGIs over 200k)
Ordinary dividends: $5,460 (reported on 11.9% of returns)
Here:
$5,460
State:
$8,105
(% of AGI for various income ranges: 10.5% for AGIs below $25k, 27.0% for AGIs $25k-50k, 54.9% for AGIs $50k-75k, 161.8% for AGIs $75k-100k, 272.2% for AGIs $100k-200k, 3267.5% for AGIs over 200k)
Net capital gain/loss in AGI: +$17,900 (reported on 11.7% of returns)
Here:
+$17,900
State:
+$33,664
(% of AGI for various income ranges: 2.6% for AGIs below $25k, 31.3% for AGIs $25k-50k, 70.3% for AGIs $50k-75k, 330.9% for AGIs $75k-100k, 718.9% for AGIs $100k-200k, 18407.5% for AGIs over 200k)
Profit/loss from business: +$16,155 (reported on 12.9% of returns)
Here:
+$16,155
State:
+$18,991
(% of AGI for various income ranges: 116.8% for AGIs below $25k, 101.6% for AGIs $25k-50k, 161.7% for AGIs $50k-75k, 393.9% for AGIs $75k-100k, 537.6% for AGIs $100k-200k, 10882.5% for AGIs over 200k)
Taxable individual retirement arrangement distribution: $16,914 (reported on 7.3% of returns)
37760:
$16,914
Tennessee:
$20,036
(% of AGI for various income ranges: 31.4% for AGIs below $25k, 73.4% for AGIs $25k-50k, 181.0% for AGIs $50k-75k, 302.4% for AGIs $75k-100k, 727.3% for AGIs $100k-200k, 2067.5% for AGIs over 200k)
Self-employed (Keogh) retirement plans: $38,000 (reported on 0.3% of returns)
37760:
$38,000
Tennessee:
$28,955
(% of AGI for various income ranges: 205.4% for AGIs $100k-200k)
Total itemized deductions: $37,225 (reported on 2.8% of returns)
Here:
$37,225
State:
$40,136
(% of AGI for various income ranges: 86.9% for AGIs $25k-50k, 192.1% for AGIs $75k-100k, 492.2% for AGIs $100k-200k, 5840.0% for AGIs over 200k)
Charity contributions: $17,793 (reported on 2.6% of returns)
Here:
$17,793
State:
$19,852
(% of AGI for various income ranges: 64.1% for AGIs $50k-75k, 233.2% for AGIs $100k-200k, 3570.0% for AGIs over 200k)
Taxes paid: $5,362 (reported on 2.8% of returns)
37760:
$5,362
State:
$6,038
(% of AGI for various income ranges: 10.1% for AGIs $25k-50k, 29.4% for AGIs $75k-100k, 72.4% for AGIs $100k-200k, 892.5% for AGIs over 200k)
Earned income credit: $2,277 (reported on 19.9% of returns)
Here:
$2,277
State:
$2,391
(% of AGI for various income ranges: 94.8% for AGIs below $25k, 71.7% for AGIs $25k-50k, 2.4% for AGIs $50k-75k)
Percentage of individuals using paid preparers for their 2020 taxes: 94.8%
Here:
95%
State:
93%
(% for various income ranges: 94.4% for AGIs below $25k, 95.6% for AGIs $25k-50k, 94.9% for AGIs $50k-75k, 94.0% for AGIs $75k-100k, 94.9% for AGIs $100k-200k, 91.7% for AGIs over 200k)
Averages for the 2012 tax year for zip code 37760, filed in 2013:
Average Adjusted Gross Income (AGI) in 2012: $41,330 (Individual Income Tax Returns)
Here:
$41,330
State:
$53,767
Salary/wage: $35,057 (reported on 85.7% of returns)
Here:
$35,057
State:
$45,421
(% of AGI for various income ranges: 80.4% for AGIs below $25k, 81.6% for AGIs $25k-50k, 75.5% for AGIs $50k-75k, 72.5% for AGIs $75k-100k, 73.3% for AGIs $100k-200k, 43.8% for AGIs over 200k)
Taxable interest for individuals: $1,426 (reported on 25.8% of returns)
This zip code:
$1,426
Tennessee:
$1,732
(% of AGI for various income ranges: 1.0% for AGIs below $25k, 0.8% for AGIs $25k-50k, 0.6% for AGIs $50k-75k, 0.8% for AGIs $75k-100k, 0.8% for AGIs $100k-200k, 1.5% for AGIs over 200k)
Ordinary dividends: $3,945 (reported on 12.4% of returns)
Here:
$3,945
State:
$6,739
(% of AGI for various income ranges: 0.8% for AGIs below $25k, 0.8% for AGIs $25k-50k, 1.0% for AGIs $50k-75k, 1.3% for AGIs $75k-100k, 1.2% for AGIs $100k-200k, 2.4% for AGIs over 200k)
Net capital gain/loss in AGI: +$4,560 (reported on 11.0% of returns)
Here:
+$4,560
State:
+$19,082
(% of AGI for various income ranges: 0.2% for AGIs $25k-50k, 0.4% for AGIs $50k-75k, 0.6% for AGIs $75k-100k, 0.7% for AGIs $100k-200k, 7.0% for AGIs over 200k)
Profit/loss from business: +$13,107 (reported on 14.0% of returns)
Here:
+$13,107
State:
+$15,240
(% of AGI for various income ranges: 6.6% for AGIs below $25k, 3.1% for AGIs $25k-50k, 3.8% for AGIs $50k-75k, 2.9% for AGIs $75k-100k, 4.5% for AGIs $100k-200k, 6.8% for AGIs over 200k)
Taxable individual retirement arrangement distribution: $14,191 (reported on 8.7% of returns)
37760:
$14,191
Tennessee:
$15,505
(% of AGI for various income ranges: 1.9% for AGIs below $25k, 2.4% for AGIs $25k-50k, 2.7% for AGIs $50k-75k, 3.2% for AGIs $75k-100k, 6.8% for AGIs $100k-200k)
Total itemized deductions: $21,300 (22% of AGI, reported on 16.3% of returns)
Here:
$21,300
State:
$21,976
Here:
22.0% of AGI
State:
17.8% of AGI
(% of AGI for various income ranges: 4.3% for AGIs below $25k, 6.1% for AGIs $25k-50k, 8.5% for AGIs $50k-75k, 9.0% for AGIs $75k-100k, 11.4% for AGIs $100k-200k, 11.9% for AGIs over 200k)
Charity contributions: $6,113 (reported on 13.0% of returns)
Here:
$6,113
State:
$6,709
(% of AGI for various income ranges: 0.4% for AGIs below $25k, 0.9% for AGIs $25k-50k, 1.7% for AGIs $50k-75k, 1.9% for AGIs $75k-100k, 3.5% for AGIs $100k-200k, 3.4% for AGIs over 200k)
Taxes paid: $3,780 (reported on 15.9% of returns)
37760:
$3,780
State:
$4,829
(% of AGI for various income ranges: 0.5% for AGIs below $25k, 0.9% for AGIs $25k-50k, 1.4% for AGIs $50k-75k, 1.6% for AGIs $75k-100k, 2.3% for AGIs $100k-200k, 2.3% for AGIs over 200k)
Earned income credit: $2,298 (reported on 24.0% of returns)
Here:
$2,298
State:
$2,404
(% of AGI for various income ranges: 7.5% for AGIs below $25k, 1.2% for AGIs $25k-50k)
Percentage of individuals using paid preparers for their 2012 taxes: 57.2%
Here:
57%
State:
52%
(% for various income ranges: 54.0% for AGIs below $25k, 58.6% for AGIs $25k-50k, 59.7% for AGIs $50k-75k, 58.3% for AGIs $75k-100k, 63.3% for AGIs $100k-200k, 85.7% for AGIs over 200k)
Averages for the 2004 tax year for zip code 37760, filed in 2005:
Average Adjusted Gross Income (AGI) in 2004: $36,277 (Individual Income Tax Returns)
Here:
$36,277
State:
$44,088
Salary/wage: $31,821 (reported on 85.6% of returns)
Here:
$31,821
State:
$38,825
(% of AGI for various income ranges: 98.0% for AGIs below $10k, 78.7% for AGIs $10k-25k, 82.7% for AGIs $25k-50k, 81.5% for AGIs $50k-75k, 76.6% for AGIs $75k-100k, 56.9% for AGIs over 100k)
Taxable interest for individuals: $1,598 (reported on 35.2% of returns)
This zip code:
$1,598
Tennessee:
$1,802
(% of AGI for various income ranges: 4.5% for AGIs below $10k, 2.1% for AGIs $10k-25k, 1.2% for AGIs $25k-50k, 1.0% for AGIs $50k-75k, 1.6% for AGIs $75k-100k, 1.7% for AGIs over 100k)
Taxable dividends: $2,531 (reported on 15.8% of returns)
Here:
$2,531
State:
$3,727
(% of AGI for various income ranges: 2.3% for AGIs below $10k, 0.8% for AGIs $10k-25k, 0.6% for AGIs $25k-50k, 0.7% for AGIs $50k-75k, 1.4% for AGIs $75k-100k, 1.9% for AGIs over 100k)
Net capital gain/loss: +$6,638 (reported on 13.3% of returns)
Here:
+$6,638
State:
+$15,776
(% of AGI for various income ranges: -0.5% for AGIs below $10k, 0.2% for AGIs $10k-25k, 0.7% for AGIs $25k-50k, 0.8% for AGIs $50k-75k, 1.3% for AGIs $75k-100k, 7.7% for AGIs over 100k)
Profit/loss from business: +$12,929 (reported on 16.0% of returns)
Here:
+$12,929
State:
+$12,882
(% of AGI for various income ranges: 10.4% for AGIs below $10k, 5.1% for AGIs $10k-25k, 3.2% for AGIs $25k-50k, 2.8% for AGIs $50k-75k, 3.6% for AGIs $75k-100k, 11.6% for AGIs over 100k)
IRA payment deduction: $3,384 (reported on 2.1% of returns)
37760:
$3,384
Tennessee:
$2,934
(% of AGI for various income ranges: 0.3% for AGIs $10k-25k, 0.3% for AGIs $25k-50k, 0.2% for AGIs $50k-75k, 0.2% for AGIs over 100k)
Self-employed pension: $7,962 (reported on 0.5% of returns)
Here:
$7,962
Tennessee:
$16,857
Total itemized deductions: $16,693 (23% of AGI, reported on 19.1% of returns)
Here:
$16,693
State:
$18,035
Here:
22.9% of AGI
State:
19.9% of AGI
(% of AGI for various income ranges: 9.8% for AGIs below $10k, 5.2% for AGIs $10k-25k, 7.9% for AGIs $25k-50k, 9.9% for AGIs $50k-75k, 10.5% for AGIs $75k-100k, 9.7% for AGIs over 100k)
Charity contributions deductions: $5,320 (7% of AGI, reported on 16.0% of returns)
Here:
$5,320
State:
$5,167
Here:
6.9% of AGI
State:
5.3% of AGI
(% of AGI for various income ranges: 0.7% for AGIs below $10k, 0.7% for AGIs $10k-25k, 1.3% for AGIs $25k-50k, 2.0% for AGIs $50k-75k, 2.6% for AGIs $75k-100k, 4.7% for AGIs over 100k)
Total tax: $5,217 (reported on 71.6% of returns)
37760:
$5,217
State:
$7,482
(% of AGI for various income ranges: 3.3% for AGIs below $10k, 3.9% for AGIs $10k-25k, 6.3% for AGIs $25k-50k, 8.7% for AGIs $50k-75k, 11.3% for AGIs $75k-100k, 19.4% for AGIs over 100k)
Earned income credit: $1,783 (reported on 20.7% of returns)
Here:
$1,783
State:
$1,826
Percentage of individuals using paid preparers for their 2004 taxes: 61.8%
Here:
62%
State:
60%
(% for various income ranges: 53.2% for AGIs below $10k, 65.8% for AGIs $10k-25k, 65.1% for AGIs $25k-50k, 59.7% for AGIs $50k-75k, 59.2% for AGIs $75k-100k, 68.6% for AGIs over 100k)
Household received Food Stamps/SNAP in the past 12 months: 539 Household did not receive Food Stamps/SNAP in the past 12 months: 4,689
Women who had a birth in the past 12 months: 262 (268 now married, 0 unmarried) Women who did not have a birth in the past 12 months: 3,056 (1,109 now married, 1,946 unmarried)
Housing units in zip code 37760 with a mortgage: 1,888 (185 second mortgage, 188 both second mortgage and home equity loan) Houses without a mortgage: 57
Median monthly owner costs for units with a mortgage: $1,214 Median monthly owner costs for units without a mortgage: $417
Residents with income below the poverty level in 2022:
This zip code:
15.2%
Whole state:
13.3%
Residents with income below 50% of the poverty level in 2022:
This zip code:
9.7%
Whole state:
7.1%
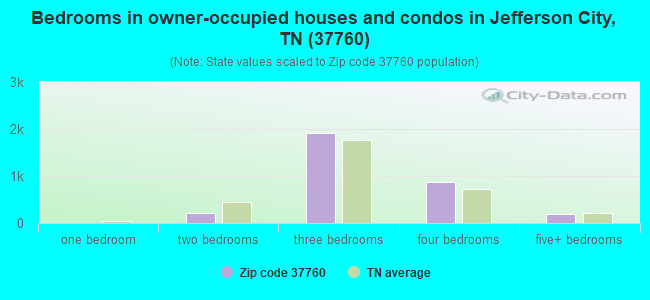
Median number of rooms in houses and condos:
Here:
6.8
State:
6.5
Median number of rooms in apartments:
Here:
4.6
State:
4.4
Notable locations in this zip code not listed on our city pages
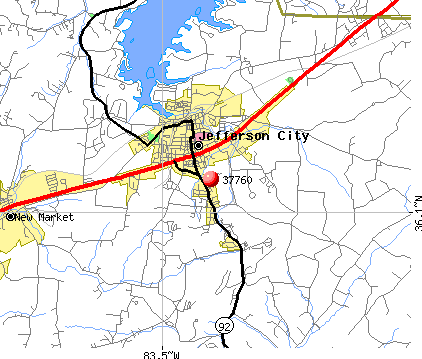
Notable locations in zip code 37760: Jefferson City Community Center (A), Mossy Creek Beat Dock (B), Jefferson City Industrial Park (C), Five Chimneys Plantation (D), Black Oak Grove Cabin Area (E), Black Oak Doock (F), Maples Library (G), Jefferson City Community Center (H), Jefferson City City Hall (I), Holt Fieldhouse (J), Lakeway Central Volunteer Fire Department (K), Jefferson City Fire Department (L). Display/hide their locations on the map
Shopping Centers: West End Shopping Center (1), North Ridge Shopping Center (2), Jefferson Shopping Center (3), College Square Shopping Center (4). Display/hide their locations on the map
Churches in zip code 37760 include: Lebanon Church (A), Hebron Church (B), Wesley Chapel (C), Oakland Methodist Church (D), Mill Springs Baptist Church (E), Jefferson City First Baptist Church (F), Friendsview Baptist Church (G), Mountain View Church (H), Mount Vale Church (I). Display/hide their locations on the map
Cemeteries: Jefferson Memorial Gardens Cemetery (1), Branner Cemetery (2), Westview Cemetery (3), Clevenger Cemetery (4), Hebron Cemetery (5), Wesleys Chapel Cemetery (6), Oakland Cemetery (7). Display/hide their locations on the map
Streams, rivers, and creeks: Buffalo Wallow Branch (A), Byrd Spring Branch (B), Black Oak Creek (C), Mossy Creek (D), Mill Spring Creek (E). Display/hide their locations on the map
Parks in zip code 37760 include: Black Oak Park (1), Nelson Merry Park (2), Johnson Ball Park (3), Great Indian War Trail Monument (4), Burke-Tarr Stadium (5). Display/hide their locations on the map
1,762 married couples with children.
825 single-parent households (185 men, 640 women).
92.3% of residents of 37760 zip code speak English at home.
6.0% of residents speak Spanish at home (59% very well, 7% well, 26% not well, 8% not at all).
0.7% of residents speak other Indo-European language at home (89% very well, 11% well).
0.7% of residents speak Asian or Pacific Island language at home (93% very well, 7% not well).
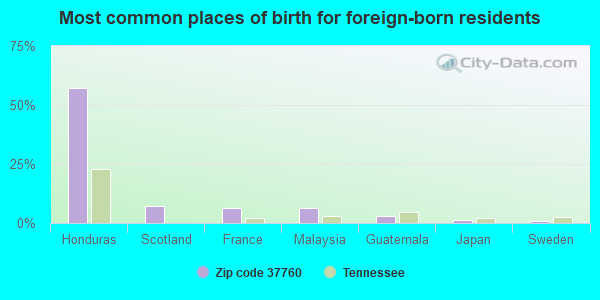
Foreign born population: 463 (3.3%) (30.1% of them are naturalized citizens)
This zip code:
3.3%
Whole state:
5.6%
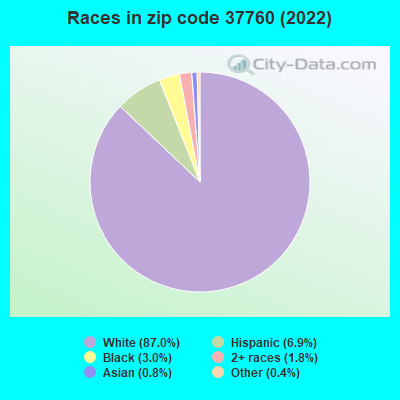
57%Honduras
7%Scotland
6%France
6%Malaysia
3%Guatemala
1%Japan
1%Sweden
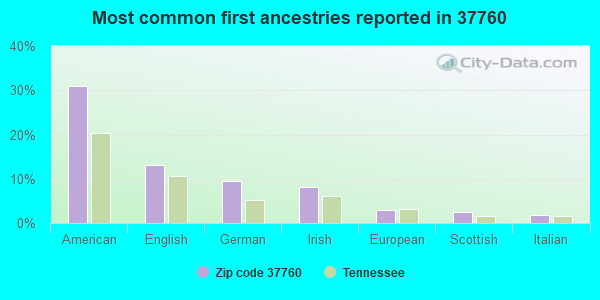
31%American
13%English
10%German
8%Irish
3%European
2%Scottish
2%Italian
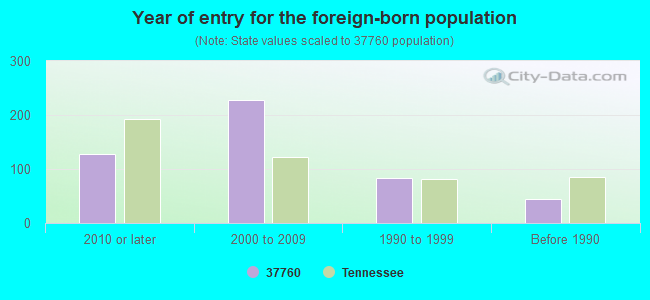
Year of entry for the foreign-born population
1272010 or later
2282000 to 2009
831990 to 1999
44Before 1990
Major facilities with environmental interests located in this zip code:
CARSON-NEWMAN COLLEGE (1646 RUSSELL ST in JEFFERSON CITY, TN)
AIR MINOR (AIRS/AFS) Conditionally Exempt Small Quantity Generators, less than 100 kg/month of hazardous waste (Resource Conservation and Recovery Act (tracking hazardous waste)) - notification Business SIC classification: COLLEGES, UNIVERSITIES, AND PROFESSIONAL SCHOOLS Organizations: MR. MARK ORTLIEB (CONTACT/OPERATOR)
CHEROKEE PRODUCTS, INC. (HIGHWAY 92 NORTH in JEFFERSON CITY, TN)
AIR MINOR (AIRS/AFS) (Resource Conservation and Recovery Act (tracking hazardous waste)) Business SIC classification: EXPLOSIVES Alternative names: CHEROKEE EXPLOSIVES PRODUCTS CO. INC,
ASARCO INC. COY MINE (420 W. BROADWAY BLVD. in JEFFERSON CITY, TN)
National Pollutant Discharge Elimination System MAJOR (Tracking pollutant discharge elimination systems) - permit TRI REPORTER (Tracking of toxic chemicals releasing facilities) Business SIC classification: LEAD AND ZINC ORES Organizations: ASARCO, INC. - TN MINES DIV. (CONTACT/OWNER)
Alternative names: ASARCO, INC., TN MINES DIV., ASARCO INC. TENNESSEE MINES DIV.
A M I INC (PO BOX 391 in JEFFERSON CITY, TN)
(Resource Conservation and Recovery Act (tracking hazardous waste))
AMERICAN LIMESTONE CO., INC. (HWY 11 EAST in JEFFERSON CITY, TN)
AIR MINOR (AIRS/AFS) Business SIC classification: CRUSHED AND BROKEN LIMESTONE
APAC-TENNESSEE, INC.: KNOXVILLE DIVISION (0408 ASPHALT PLANT HICKS RD in JEFFERSON CITY, TN)
(Resource Conservation and Recovery Act (tracking hazardous waste))
APPALACHIAN DOOR (506 MUNICIPAL DRIVE in JEFFERSON CITY, TN)
AIR MINOR (AIRS/AFS) Business SIC classification: MILLWORK
ASARCO, INC. - YOUNG MILL (1170 REED BULL ROAD in JEFFERSON CITY, TN)
AIR MINOR (AIRS/AFS) Business SIC classification: LEAD AND ZINC ORES
BROADWAY GULF SERVICES (302 W. BROADWAY in JEFFERSON CITY, TN)
(Resource Conservation and Recovery Act (tracking hazardous waste))
CURRIE INC (HIGHWAY 11 EAST in JEFFERSON CITY, TN)
(Resource Conservation and Recovery Act (tracking hazardous waste)) Business NAICS classification: FABRICATED STRUCTURAL METAL MANUFACTURING.
CUSTOM CARE CLEANERS (205 EAST BROADWAY in JEFFERSON CITY, TN)
AIR MINOR (AIRS/AFS) Business SIC classification: COIN-OPERATED LAUNDRIES AND DRYCLEANING
CUSTOM CARE CLEANERS (1096 MARTHA GLASS DRIVE in JEFFERSON CITY, TN)
Conditionally Exempt Small Quantity Generators, less than 100 kg/month of hazardous waste (Resource Conservation and Recovery Act (tracking hazardous waste)) Organizations: BENNIE ATKINS (CONTACT/OPERATOR)
, BENNIE S ATKINS (CONTACT/OWNER)
APAC TENNESSEE INC. (1360 HICKS RD. in JEFFERSON CITY, TN)
AIR SYNTHETIC MINOR (AIRS/AFS) TRI REPORTER (Tracking of toxic chemicals releasing facilities) Business SIC classification: ASPHALT PAVING MIXTURES AND BLOCKS Alternative names: APAC-TENNESSEE, INC.
Housing units lacking complete plumbing facilities: 2.2% Housing units lacking complete kitchen facilities: 2.2%
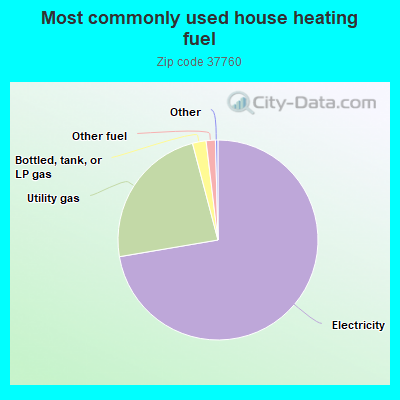
72.4%Electricity
23.6%Utility gas
2.2%Bottled, tank, or LP gas
1.5%Other fuel
Population in 1990: 9,438. Population change in the 1990s: +3,189 (+33.8%).
Place of birth for U.S.-born residents:
This state: 8,738
Northeast: 477
Midwest: 1,223
South: 2,778
West: 382
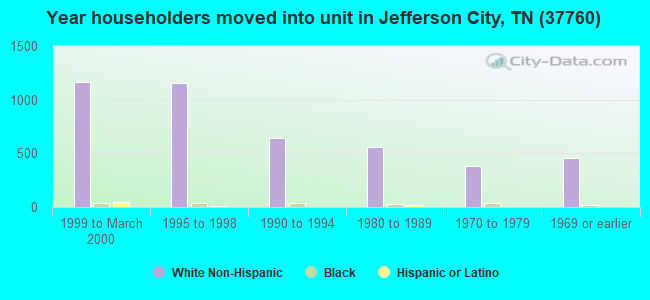
49% of the 37760 zip code residents lived in the same house 5 years ago. Out of people who lived in different houses, 38% lived in this county. Out of people who lived in different counties, 50% lived in Tennessee.
87% of the 37760 zip code residents lived in the same house 1 year ago. Out of people who lived in different houses, 47% moved from this county. Out of people who lived in different houses, 32% moved from different county within same state. Out of people who lived in different houses, 16% moved from different state. Out of people who lived in different houses, 4% moved from abroad.
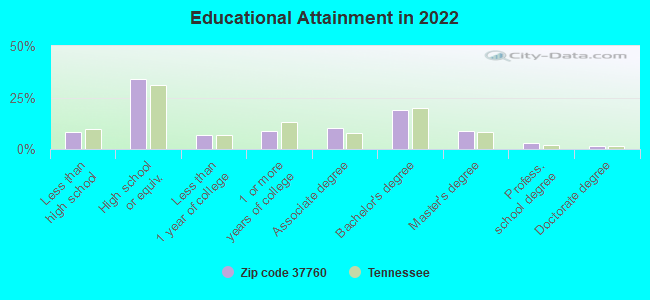
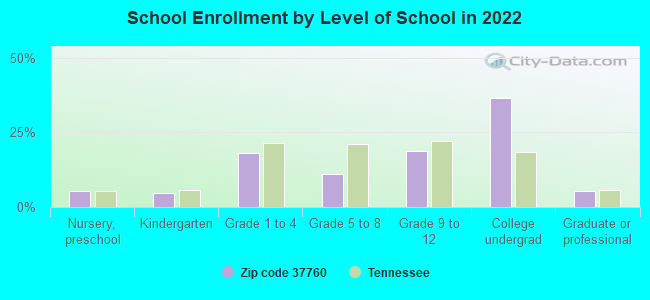
Private vs. public school enrollment:
Students in private schools in grades 1 to 8 (elementary and middle school): 209
Here:
16.8%
Tennessee:
15.0%
Students in private schools in grades 9 to 12 (high school): 156
Here:
19.5%
Tennessee:
16.2%
Students in private undergraduate colleges: 1,080
Here:
70.4%
Tennessee:
23.5%
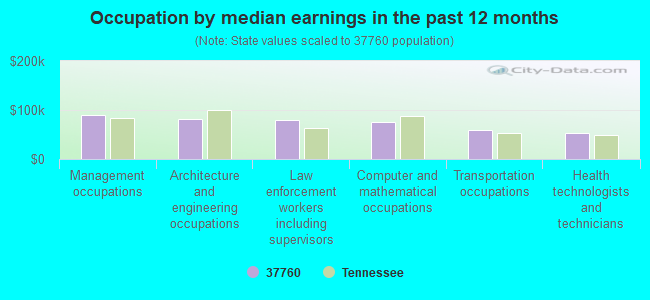
Occupation by median earnings in the past 12 months ($)
89,155Management occupations
81,054Architecture and engineering occupations
79,693Law enforcement workers including supervisors
75,482Computer and mathematical occupations
58,308Transportation occupations
53,585Health technologists and technicians
Companies with federal contracts located in this zip code:
CARSON-NEWMAN COLLEGE (1646 RUSSELL AVE in JEFFERSON CITY, TN) : $14,420 in 2 contractsin 2005
$7,210 with Air Force for Tuition, Registration, and Membership Fees. Signed on 2005-04-01. Completion date: 2005-09-30.
$7,210, same as above.Signed on 2005-01-20. Completion date: 2005-09-30.
MONROE, STEVEN PC (156 W BROADWAY BLVD STE 1 in JEFFERSON CITY, TN; small business) : $7,842 in 5 contractsfrom 2004 to 2005
Contracts for Dentistry Services by Army Signed by year:2000: $0; 2001: $0; 2002: $0; 2003: $0; 2004: $8,039; 2005: -$197; 2006: $0.
Biggest contracts:
$4,441 with Army for Dentistry Services. Signed on 2004-08-24. Completion date: 2004-08-27.
$3,596, same as above.Signed on 2004-03-25. Completion date: 2004-04-02.
$1, same as above.Signed on 2004-03-31. Completion date: 2004-04-02.
$1, same as above.Signed on 2004-05-05. Completion date: 2004-04-02.
STINSON, ROBERT DDS (113 E BROADWAY BLVD in JEFFERSON CITY, TN; small business)
$4,200 with Army for Dentistry Services. Signed on 2004-03-29. Completion date: 2004-04-02.
Top industries in this zip code by the number of employees in 2005:
Educational Services: Colleges, Universities, and Professional Schools (500-999 employees: 1 establishment)
2002 - 2018 National Fire Incident Reporting System (NFIRS) incidents
Based on the data from the years 2002 - 2018 the average number of fires per year is 53. The highest number of reported fires - 83 took place in 2006, and the least - 36 in 2013. The data has a rising trend.
When looking into fire subcategories, the most reports belonged to: Structure Fires (45.6%), and Outside Fires (28.3%).
Fire incident types reported to NFIRS in Zip Code 37760


 Nearest zip codes: 37877, 37820, 37725, 37861, 37890, 37814.
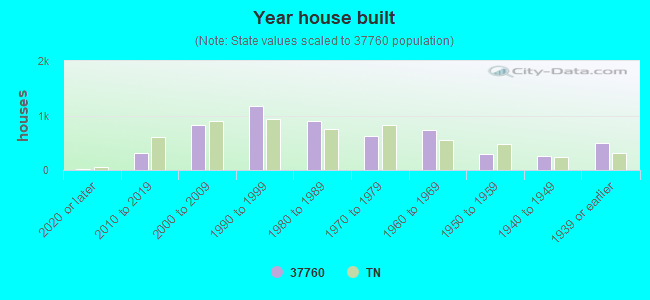


 Based on the data from the years 2002 - 2018 the average number of fires per year is 53. The highest number of reported fires - 83 took place in 2006, and the least - 36 in 2013. The data has a rising trend.
 When looking into fire subcategories, the most reports belonged to: Structure Fires (45.6%), and Outside Fires (28.3%).