Estimated zip code population in 2022: 31,526 Zip code population in 2010: 28,194 Zip code population in 2000: 27,609
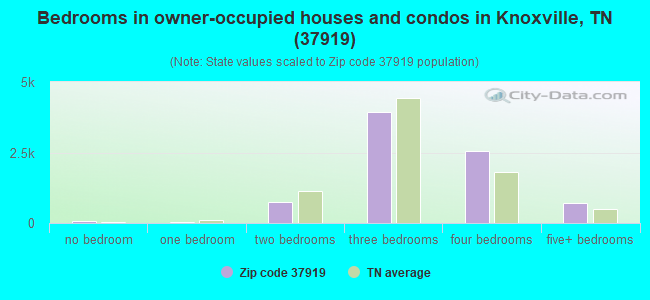
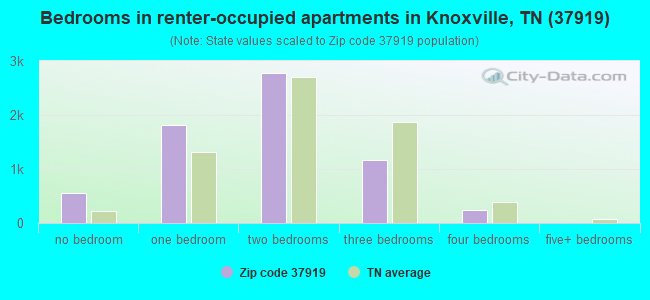
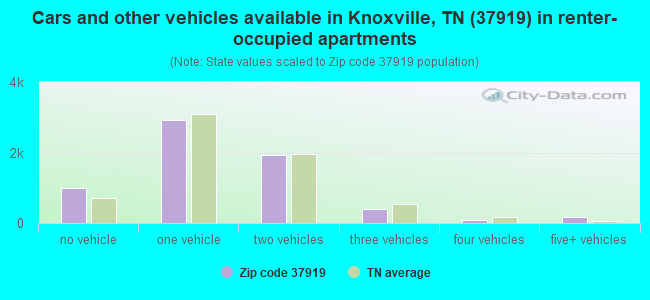
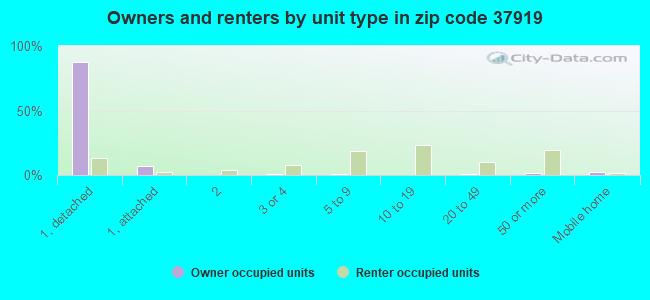
Houses and condos: 15,718 Renter-occupied apartments: 6,528
% of renters here:
45%
State:
33%
March 2022 cost of living index in zip code 37919: 89.7 (less than average, U.S. average is 100)
Land area: 18.9 sq. mi. Water area: 1.7 sq. mi.
Population density: 1,664 people per square mile
(low).
OSM Map
General Map
Google Map
MSN Map
OSM Map
General Map
Google Map
MSN Map
OSM Map
General Map
Google Map
MSN Map
OSM Map
General Map
Google Map
MSN Map
Please wait while loading the map...
Real estate property taxes paid for housing units in 2022:
This zip code:
0.5% ($2,470)
Tennessee:
0.5% ($1,376)
Median real estate property taxes paid for housing units with mortgages in 2022: $2,657 (0.5%) Median real estate property taxes paid for housing units with no mortgage in 2022: $2,182 (0.4%)
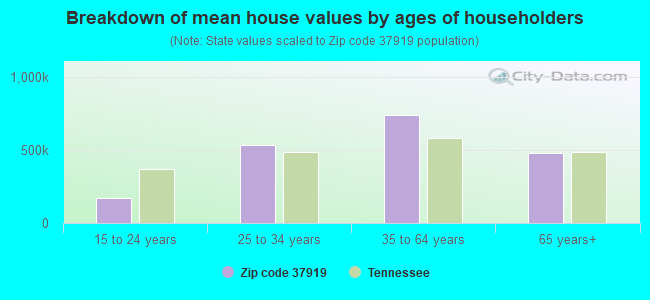
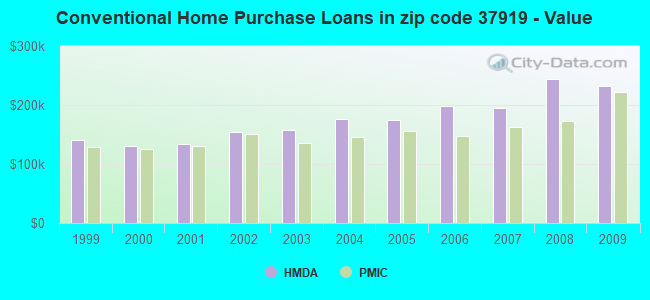
Estimated median house/condo value in 2022: $510,579
37919:
$510,579
Tennessee:
$284,800
According to our research of Tennessee and other state lists, there were 11 registered sex offenders living in 37919 zip code as of April 27, 2024. The ratio of all residents to sex offenders in zip code 37919 is 2,593 to 1. The ratio of registered sex offenders to all residents in this zip code is much lower than the state average.
Median resident age:
This zip code:
38.9 years
Tennessee median age:
39.2 years
Average household size:
This zip code:
2.2 people
Tennessee:
2.4 people
Averages for the 2020 tax year for zip code 37919, filed in 2021:
Average Adjusted Gross Income (AGI) in 2020: $159,133 (Individual Income Tax Returns)
Here:
$159,133
State:
$69,014
Salary/wage: $95,698 (reported on 79.9% of returns)
Here:
$95,698
State:
$55,872
(% of AGI for various income ranges: 1213.6% for AGIs below $25k, 3726.6% for AGIs $25k-50k, 6619.9% for AGIs $50k-75k, 9701.8% for AGIs $75k-100k, 18016.8% for AGIs $100k-200k, 104947.4% for AGIs over 200k)
Taxable interest for individuals: $4,884 (reported on 40.0% of returns)
This zip code:
$4,884
Tennessee:
$1,945
(% of AGI for various income ranges: 15.3% for AGIs below $25k, 23.6% for AGIs $25k-50k, 57.9% for AGIs $50k-75k, 139.7% for AGIs $75k-100k, 242.0% for AGIs $100k-200k, 3809.7% for AGIs over 200k)
Ordinary dividends: $23,353 (reported on 32.0% of returns)
Here:
$23,353
State:
$8,105
(% of AGI for various income ranges: 46.6% for AGIs below $25k, 98.4% for AGIs $25k-50k, 226.3% for AGIs $50k-75k, 477.5% for AGIs $75k-100k, 1061.7% for AGIs $100k-200k, 14437.9% for AGIs over 200k)
Net capital gain/loss in AGI: +$55,911 (reported on 30.5% of returns)
Here:
+$55,911
State:
+$33,664
(% of AGI for various income ranges: 28.0% for AGIs below $25k, 57.4% for AGIs $25k-50k, 191.8% for AGIs $50k-75k, 435.1% for AGIs $75k-100k, 1039.6% for AGIs $100k-200k, 38045.4% for AGIs over 200k)
Profit/loss from business: +$37,004 (reported on 19.9% of returns)
Here:
+$37,004
State:
+$18,991
(% of AGI for various income ranges: 132.3% for AGIs below $25k, 184.5% for AGIs $25k-50k, 497.3% for AGIs $50k-75k, 666.6% for AGIs $75k-100k, 1726.0% for AGIs $100k-200k, 11373.9% for AGIs over 200k)
Taxable individual retirement arrangement distribution: $28,930 (reported on 10.7% of returns)
37919:
$28,930
Tennessee:
$20,036
(% of AGI for various income ranges: 45.5% for AGIs below $25k, 94.7% for AGIs $25k-50k, 288.1% for AGIs $50k-75k, 538.2% for AGIs $75k-100k, 956.8% for AGIs $100k-200k, 3825.2% for AGIs over 200k)
Self-employed (Keogh) retirement plans: $35,202 (reported on 2.7% of returns)
37919:
$35,202
Tennessee:
$28,955
(% of AGI for various income ranges: 33.0% for AGIs $50k-75k, 131.9% for AGIs $100k-200k, 1987.7% for AGIs over 200k)
Total itemized deductions: $62,096 (reported on 11.8% of returns)
Here:
$62,096
State:
$40,136
(% of AGI for various income ranges: 37.5% for AGIs below $25k, 96.2% for AGIs $25k-50k, 260.2% for AGIs $50k-75k, 500.0% for AGIs $75k-100k, 1066.8% for AGIs $100k-200k, 14061.5% for AGIs over 200k)
Charity contributions: $37,853 (reported on 10.4% of returns)
Here:
$37,853
State:
$19,852
(% of AGI for various income ranges: 3.5% for AGIs below $25k, 12.4% for AGIs $25k-50k, 45.1% for AGIs $50k-75k, 113.6% for AGIs $75k-100k, 347.2% for AGIs $100k-200k, 8586.7% for AGIs over 200k)
Taxes paid: $7,725 (reported on 11.8% of returns)
37919:
$7,725
State:
$6,038
(% of AGI for various income ranges: 6.2% for AGIs below $25k, 13.7% for AGIs $25k-50k, 43.7% for AGIs $50k-75k, 79.3% for AGIs $75k-100k, 213.5% for AGIs $100k-200k, 1521.8% for AGIs over 200k)
Earned income credit: $2,019 (reported on 10.8% of returns)
Here:
$2,019
State:
$2,391
(% of AGI for various income ranges: 69.7% for AGIs below $25k, 42.8% for AGIs $25k-50k, 1.0% for AGIs $50k-75k)
Percentage of individuals using paid preparers for their 2020 taxes: 92.8%
Here:
93%
State:
93%
(% for various income ranges: 92.0% for AGIs below $25k, 93.7% for AGIs $25k-50k, 92.9% for AGIs $50k-75k, 90.8% for AGIs $75k-100k, 92.4% for AGIs $100k-200k, 94.3% for AGIs over 200k)
Averages for the 2012 tax year for zip code 37919, filed in 2013:
Average Adjusted Gross Income (AGI) in 2012: $154,003 (Individual Income Tax Returns)
Here:
$154,003
State:
$53,767
Salary/wage: $83,408 (reported on 79.9% of returns)
Here:
$83,408
State:
$45,421
(% of AGI for various income ranges: 78.9% for AGIs below $25k, 78.5% for AGIs $25k-50k, 69.6% for AGIs $50k-75k, 66.6% for AGIs $75k-100k, 64.5% for AGIs $100k-200k, 32.9% for AGIs over 200k)
Taxable interest for individuals: $10,753 (reported on 42.3% of returns)
This zip code:
$10,753
Tennessee:
$1,732
(% of AGI for various income ranges: 1.5% for AGIs below $25k, 1.0% for AGIs $25k-50k, 1.1% for AGIs $50k-75k, 1.2% for AGIs $75k-100k, 1.0% for AGIs $100k-200k, 3.7% for AGIs over 200k)
Ordinary dividends: $36,218 (reported on 32.4% of returns)
Here:
$36,218
State:
$6,739
(% of AGI for various income ranges: 3.3% for AGIs below $25k, 2.4% for AGIs $25k-50k, 3.2% for AGIs $50k-75k, 3.4% for AGIs $75k-100k, 3.7% for AGIs $100k-200k, 9.3% for AGIs over 200k)
Net capital gain/loss in AGI: +$98,464 (reported on 28.5% of returns)
Here:
+$98,464
State:
+$19,082
(% of AGI for various income ranges: 0.7% for AGIs below $25k, 0.7% for AGIs $25k-50k, 1.2% for AGIs $50k-75k, 2.0% for AGIs $75k-100k, 2.8% for AGIs $100k-200k, 24.7% for AGIs over 200k)
Profit/loss from business: +$34,320 (reported on 19.6% of returns)
Here:
+$34,320
State:
+$15,240
(% of AGI for various income ranges: 7.8% for AGIs below $25k, 4.8% for AGIs $25k-50k, 4.8% for AGIs $50k-75k, 5.8% for AGIs $75k-100k, 7.6% for AGIs $100k-200k, 3.5% for AGIs over 200k)
Taxable individual retirement arrangement distribution: $23,141 (reported on 12.1% of returns)
37919:
$23,141
Tennessee:
$15,505
(% of AGI for various income ranges: 2.6% for AGIs below $25k, 2.7% for AGIs $25k-50k, 3.6% for AGIs $50k-75k, 3.5% for AGIs $75k-100k, 4.8% for AGIs $100k-200k, 1.0% for AGIs over 200k)
Self-employment retirement plans: $30,392 (reported on 2.8% of returns)
37919:
$30,392
Tennessee:
$22,567
(% of AGI for various income ranges: 0.2% for AGIs below $25k, 0.5% for AGIs $50k-75k, 0.7% for AGIs $100k-200k, 0.6% for AGIs over 200k)
Total itemized deductions: $37,880 (10% of AGI, reported on 34.8% of returns)
Here:
$37,880
State:
$21,976
Here:
10.2% of AGI
State:
17.8% of AGI
(% of AGI for various income ranges: 9.9% for AGIs below $25k, 10.3% for AGIs $25k-50k, 11.3% for AGIs $50k-75k, 12.8% for AGIs $75k-100k, 13.3% for AGIs $100k-200k, 7.2% for AGIs over 200k)
Charity contributions: $15,520 (reported on 29.9% of returns)
Here:
$15,520
State:
$6,709
(% of AGI for various income ranges: 0.8% for AGIs below $25k, 1.2% for AGIs $25k-50k, 1.8% for AGIs $50k-75k, 2.8% for AGIs $75k-100k, 3.3% for AGIs $100k-200k, 3.3% for AGIs over 200k)
Taxes paid: $9,986 (reported on 34.3% of returns)
37919:
$9,986
State:
$4,829
(% of AGI for various income ranges: 1.6% for AGIs below $25k, 1.9% for AGIs $25k-50k, 2.5% for AGIs $50k-75k, 3.0% for AGIs $75k-100k, 3.4% for AGIs $100k-200k, 2.0% for AGIs over 200k)
Earned income credit: $1,946 (reported on 12.6% of returns)
Here:
$1,946
State:
$2,404
(% of AGI for various income ranges: 4.4% for AGIs below $25k, 0.6% for AGIs $25k-50k)
Percentage of individuals using paid preparers for their 2012 taxes: 50.9%
Here:
51%
State:
52%
(% for various income ranges: 42.1% for AGIs below $25k, 43.9% for AGIs $25k-50k, 50.3% for AGIs $50k-75k, 53.5% for AGIs $75k-100k, 61.1% for AGIs $100k-200k, 81.8% for AGIs over 200k)
Averages for the 2004 tax year for zip code 37919, filed in 2005:
Average Adjusted Gross Income (AGI) in 2004: $94,950 (Individual Income Tax Returns)
Here:
$94,950
State:
$44,088
Salary/wage: $60,165 (reported on 79.5% of returns)
Here:
$60,165
State:
$38,825
(% of AGI for various income ranges: 166.0% for AGIs below $10k, 78.6% for AGIs $10k-25k, 76.9% for AGIs $25k-50k, 69.8% for AGIs $50k-75k, 69.4% for AGIs $75k-100k, 41.9% for AGIs over 100k)
Taxable interest for individuals: $4,697 (reported on 49.5% of returns)
This zip code:
$4,697
Tennessee:
$1,802
(% of AGI for various income ranges: 15.1% for AGIs below $10k, 2.6% for AGIs $10k-25k, 2.4% for AGIs $25k-50k, 2.4% for AGIs $50k-75k, 2.0% for AGIs $75k-100k, 2.4% for AGIs over 100k)
Taxable dividends: $10,911 (reported on 36.7% of returns)
Here:
$10,911
State:
$3,727
(% of AGI for various income ranges: 13.0% for AGIs below $10k, 2.8% for AGIs $10k-25k, 2.5% for AGIs $25k-50k, 3.1% for AGIs $50k-75k, 2.4% for AGIs $75k-100k, 4.7% for AGIs over 100k)
Net capital gain/loss: +$42,908 (reported on 32.1% of returns)
Here:
+$42,908
State:
+$15,776
(% of AGI for various income ranges: 2.6% for AGIs below $10k, 1.1% for AGIs $10k-25k, 1.4% for AGIs $25k-50k, 2.3% for AGIs $50k-75k, 2.7% for AGIs $75k-100k, 18.8% for AGIs over 100k)
Profit/loss from business: +$30,163 (reported on 18.0% of returns)
Here:
+$30,163
State:
+$12,882
(% of AGI for various income ranges: 8.6% for AGIs below $10k, 4.5% for AGIs $10k-25k, 4.7% for AGIs $25k-50k, 4.9% for AGIs $50k-75k, 5.7% for AGIs $75k-100k, 5.9% for AGIs over 100k)
IRA payment deduction: $3,306 (reported on 2.7% of returns)
37919:
$3,306
Tennessee:
$2,934
(% of AGI for various income ranges: 0.5% for AGIs below $10k, 0.2% for AGIs $10k-25k, 0.2% for AGIs $25k-50k, 0.2% for AGIs $50k-75k, 0.2% for AGIs $75k-100k, 0.1% for AGIs over 100k)
Self-employed pension: $22,906 (reported on 3.1% of returns)
Here:
$22,906
Tennessee:
$16,857
(% of AGI for various income ranges: 0.2% for AGIs $25k-50k, 0.2% for AGIs $50k-75k, 0.5% for AGIs $75k-100k, 0.9% for AGIs over 100k)
Total itemized deductions: $29,358 (15% of AGI, reported on 35.9% of returns)
Here:
$29,358
State:
$18,035
Here:
14.9% of AGI
State:
19.9% of AGI
(% of AGI for various income ranges: 23.3% for AGIs below $10k, 8.8% for AGIs $10k-25k, 10.9% for AGIs $25k-50k, 14.8% for AGIs $50k-75k, 14.7% for AGIs $75k-100k, 10.5% for AGIs over 100k)
Charity contributions deductions: $14,726 (7% of AGI, reported on 31.8% of returns)
Here:
$14,726
State:
$5,167
Here:
6.8% of AGI
State:
5.3% of AGI
(% of AGI for various income ranges: 1.2% for AGIs below $10k, 1.1% for AGIs $10k-25k, 1.6% for AGIs $25k-50k, 2.9% for AGIs $50k-75k, 3.2% for AGIs $75k-100k, 5.8% for AGIs over 100k)
Total tax: $23,338 (reported on 78.6% of returns)
37919:
$23,338
State:
$7,482
(% of AGI for various income ranges: 5.6% for AGIs below $10k, 4.9% for AGIs $10k-25k, 8.3% for AGIs $25k-50k, 10.4% for AGIs $50k-75k, 12.0% for AGIs $75k-100k, 22.8% for AGIs over 100k)
Earned income credit: $1,451 (reported on 10.2% of returns)
Here:
$1,451
State:
$1,826
Percentage of individuals using paid preparers for their 2004 taxes: 53.3%
Here:
53%
State:
60%
(% for various income ranges: 47.5% for AGIs below $10k, 46.5% for AGIs $10k-25k, 49.0% for AGIs $25k-50k, 53.4% for AGIs $50k-75k, 54.4% for AGIs $75k-100k, 72.9% for AGIs over 100k)
Likely homosexual households (counted as self-reported same-sex unmarried-partner households)
Lesbian couples: 0.1% of all households
Gay men: 0.3% of all households
Household received Food Stamps/SNAP in the past 12 months: 787 Household did not receive Food Stamps/SNAP in the past 12 months: 13,791
Women who had a birth in the past 12 months: 342 (303 now married, 42 unmarried) Women who did not have a birth in the past 12 months: 7,372 (3,286 now married, 4,086 unmarried)
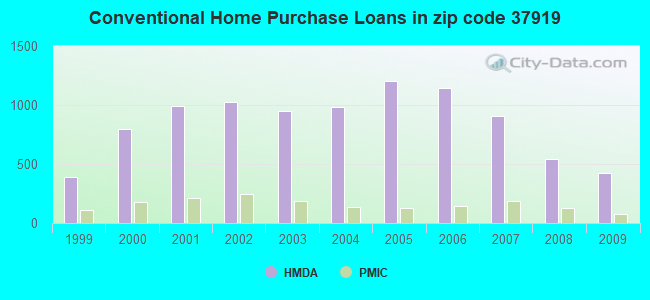
Housing units in zip code 37919 with a mortgage: 4,474 (689 second mortgage, 667 both second mortgage and home equity loan) Houses without a mortgage: 129
Median monthly owner costs for units with a mortgage: $2,032 Median monthly owner costs for units without a mortgage: $639
Residents with income below the poverty level in 2022:
This zip code:
9.6%
Whole state:
13.3%
Residents with income below 50% of the poverty level in 2022:
This zip code:
4.7%
Whole state:
7.1%
Median number of rooms in houses and condos:
Here:
7.6
State:
6.5
Median number of rooms in apartments:
Here:
4.0
State:
4.4
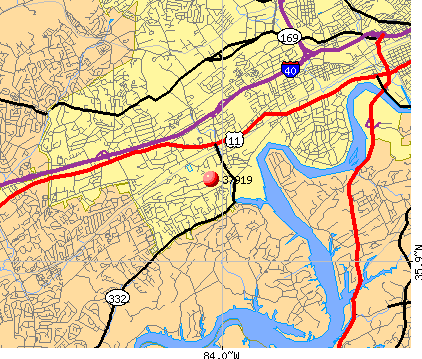
Notable locations in this zip code not listed on our city pages
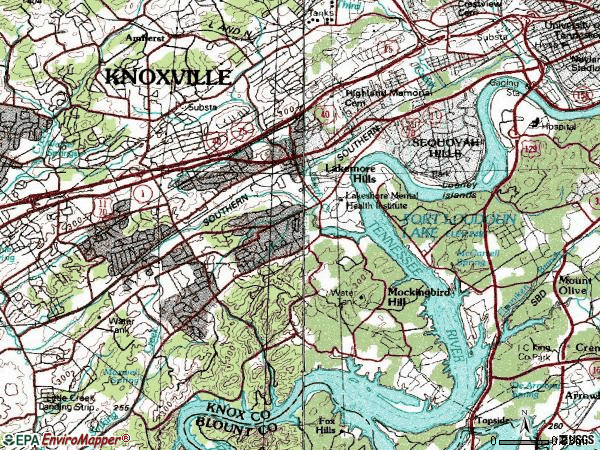
Notable locations in zip code 37919: Deane Hill Golf and Country Club (A), Knoxville Boat Club Dock (B), Duncan Dock (C), Cherokee Golf and Country Club (D), University of Tennessee Experimental Farm (E), Old Water Mill (F), Arnstein Community Center (G), Knoxville Fire Department Station 18 (H), Knoxville Fire Department Station 12 (I), Rural / Metro Fire Department Knoxville 17 (J), Appalachian Child Development Center (K). Display/hide their locations on the map
Shopping Centers: West Town Mall (1), Western Plaza Shopping Center (2), Walker Springs Plaza Shopping Center (3), Village Square Shopping Center (4), Suburban Shopping Center (5), Rocky Hill Shopping Center (6), Montvue Shopping Center (7), Knox Plaza Shopping Center (8), Kingston Pike Shopping Center (9). Display/hide their locations on the map
Churches in zip code 37919 include: Saint Marks United Methodist Church (A), First Cumberland Presbyterian Church (B), Washburn Street Church (C), Bearden United Methodist Church (D), Central Baptist Church of Bearden (E), Church of the Ascension (F), Wrights Ferry Church (G), First Church of Christ Science (H), First United Methodist Church (I). Display/hide their locations on the map
Cemeteries: Knott Cemetery (1), Bearden Cemetery (2), Dunn Cemetery (3), Edgewood Cemetery (4), Highland Memorial Cemetery (5), Flenniken Cemetery (6), Rudder Cemetery (7). Display/hide their locations on the map
Streams, rivers, and creeks: East Third Creek (A), Duncan Branch (B), Beardens Creek (C), Fourth Creek (D), Henson Spring Branch (E). Display/hide their locations on the map
4,920 married couples with children.
1,252 single-parent households (201 men, 1,051 women).
91.9% of residents of 37919 zip code speak English at home.
3.1% of residents speak Spanish at home (66% very well, 5% well, 26% not well, 3% not at all).
2.5% of residents speak other Indo-European language at home (81% very well, 11% well, 2% not well, 6% not at all).
1.1% of residents speak Asian or Pacific Island language at home (71% very well, 27% well, 2% not well).
1.5% of residents speak other language at home (83% very well, 13% well, 4% not well).
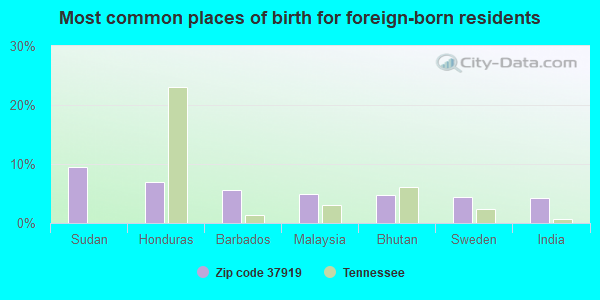
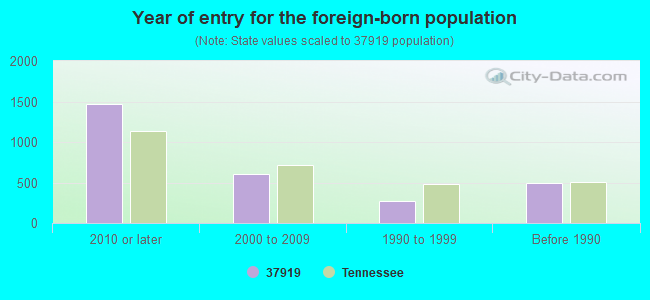
Foreign born population: 2,482 (7.9%) (40.8% of them are naturalized citizens)
Major facilities with environmental interests located in this zip code:
BEARDEN ELEMENTARY SCHOOL (5717 KINGSTON PK in KNOXVILLE, TN)
(Geographic Names Information System) (National Center for Education Statistics) - STATE ID-0012 Organizations: KNOX COUNTY SCHOOL DISTRICT (SCHOOL DISTRICT)
BEARDEN HIGH SCHOOL (8352 KINGSTON PK in KNOXVILLE, TN)
(Geographic Names Information System) (National Center for Education Statistics) - STATE ID-0017 Organizations: KNOX COUNTY SCHOOL DISTRICT (SCHOOL DISTRICT)
CROWN CLEANERS (6300 KINGSTON PIKE in KNOXVILLE, TN)
AIR MINOR (AIRS/AFS) Conditionally Exempt Small Quantity Generators, less than 100 kg/month of hazardous waste (Resource Conservation and Recovery Act (tracking hazardous waste)) Business SIC classification: DRYCLEANING PLANTS, EXCEPT RUG CLEANING Organizations: ROBERT E ROWAN (CONTACT/OPERATOR)
, DONALD HOLECEK (CONTACT/OPERATOR)
A R C INCORPORATED (4621 NEWCOM AVE in KNOXVILLE, TN)
(Resource Conservation and Recovery Act (tracking hazardous waste))
ADKINS CLASSIC CLEANER (8515 KINGSTON PIKE in KNOXVILLE, TN)
(Resource Conservation and Recovery Act (tracking hazardous waste))
AIR & HYDRAULIC EQUIPMENT INC (3901 PAPERMILL DR in KNOXVILLE, TN)
(Resource Conservation and Recovery Act (tracking hazardous waste)) Business NAICS classification: GENERAL AUTOMOTIVE REPAIR.
ALLIED COLOR INDUS MID-SO INC (320 F TROY CIRCLE in KNOXVILLE, TN)
(Resource Conservation and Recovery Act (tracking hazardous waste)) Business NAICS classification: INORGANIC DYE AND PIGMENT MANUFACTURING.
AMSTED INDUSTRIES INCORPORATED (LEXINGTON DRIVE in KNOXVILLE, TN)
(Resource Conservation and Recovery Act (tracking hazardous waste)) Business NAICS classification: PLASTICS MATERIAL AND RESIN MANUFACTURING.
(Resource Conservation and Recovery Act (tracking hazardous waste))
BRANDONS INC (124 NORTHSHORE DRIVE in KNOXVILLE, TN)
(Resource Conservation and Recovery Act (tracking hazardous waste)) Business NAICS classification: ALL OTHER MISCELLANEOUS STORE RETAILERS (EXCEPT TOBACCO STORES).
BRITTON CARL CO (514 VAN ST in KNOXVILLE, TN)
(Resource Conservation and Recovery Act (tracking hazardous waste)) Business NAICS classification: NONUPHOLSTERED WOOD HOUSEHOLD FURNITURE MANUFACTURING.
C & S LAUNDRY (5961 KINGSTON PIKE in KNOXVILLE, TN)
(Resource Conservation and Recovery Act (tracking hazardous waste))
Housing units lacking complete plumbing facilities: 0.4% Housing units lacking complete kitchen facilities: 1.1%
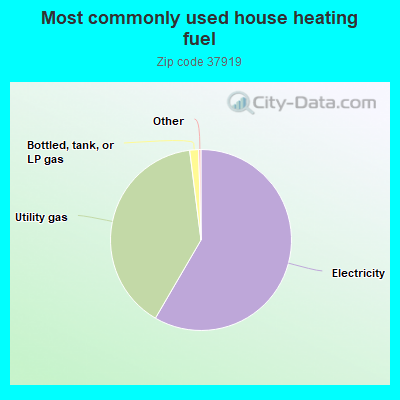
58.4%Electricity
39.6%Utility gas
1.6%Bottled, tank, or LP gas
Population in 1990: 25,653. Population change in the 1990s: +1,956 (+7.6%).
Place of birth for U.S.-born residents:
This state: 16,046
Northeast: 1,890
Midwest: 3,483
South: 6,228
West: 1,177
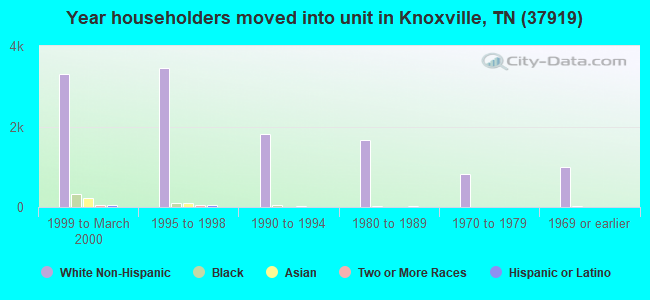
48% of the 37919 zip code residents lived in the same house 5 years ago. Out of people who lived in different houses, 52% lived in this county. Out of people who lived in different counties, 50% lived in Tennessee.
87% of the 37919 zip code residents lived in the same house 1 year ago. Out of people who lived in different houses, 50% moved from this county. Out of people who lived in different houses, 23% moved from different county within same state. Out of people who lived in different houses, 24% moved from different state. Out of people who lived in different houses, 1% moved from abroad.
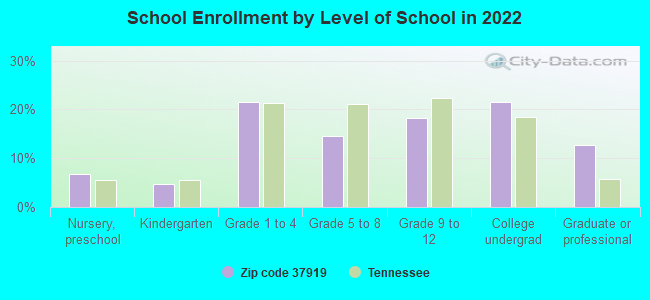
Private vs. public school enrollment:
Students in private schools in grades 1 to 8 (elementary and middle school): 655
Here:
22.0%
Tennessee:
15.0%
Students in private schools in grades 9 to 12 (high school): 312
Here:
20.7%
Tennessee:
16.2%
Students in private undergraduate colleges: 132
Here:
7.5%
Tennessee:
23.5%
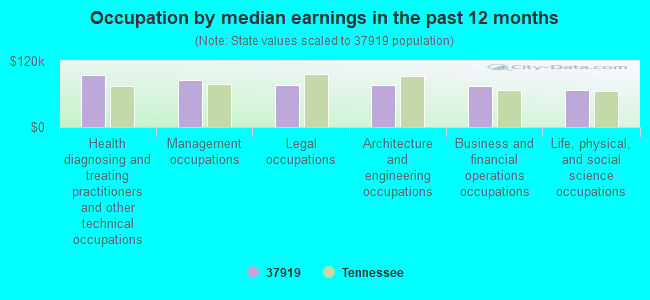
Occupation by median earnings in the past 12 months ($)
94,473Health diagnosing and treating practitioners and other technical occupations
85,362Management occupations
76,760Legal occupations
76,385Architecture and engineering occupations
75,411Business and financial operations occupations
66,402Life, physical, and social science occupations
Companies with biggest federal contracts located in this zip code (KNOXVILLE, TN):
BLAINE CONSTRUCTION CORPORATIO (6510 DEAN E HILL DR) : $1,581,223 in 2 contractsin 2005
$1,578,723 with Air Force for Maintenance, Repair or Alteration of Real Property -- Other Non-Building Facilities. Signed on 2005-01-24. Completion date: 2005-07-31.
$2,500, same as above.Signed on 2005-09-30. Completion date: 2005-10-30.
GOODWILL INDUSTRIES-KNOXVILLE (5508 KINGSTON PIKE) : $1,457,855 in 26 contractsfrom 1999 to 2006
Contracts for Miscellaneous Vehicular Components, Centrifugals, Separators, and Pressure and Vacuum Filters, Vehicular Power Transmission Components, Custodial Janitorial Services, and moreby Defense Logistics Agency, Army Signed by year:2000: $89,106; 2001: $227,364; 2002: $70,564; 2003: $264,742; 2004: $373,545; 2005: $273,177; 2006: $96,381.
Biggest contracts:
$113,116 with Defense Logistics Agency for Miscellaneous Vehicular Components. Signed on 2004-01-26. Completion date: 2004-07-24.
$99,654 with Defense Logistics Agency for Centrifugals, Separators, and Pressure and Vacuum Filters. Signed on 2003-12-03. Completion date: 2004-04-01.
$97,939, same as above.Signed on 2005-12-19. Completion date: 2006-04-18.
$89,106 with Defense Logistics Agency for Vehicular Power Transmission Components. Signed on 2000-05-10. Completion date: 2000-10-15.
FULTON BELLOWS & COMPONENTS, I (2318 KINGSTON PIKE, SW; small business) : $1,406,180 in 45 contractsfrom 2001 to 2006
Contracts for Engine Fuel System Components, Aircraft and Missile Prime Movers, Valves, Nonpowered, Radar Equipment, Airborne, Liquid and Gas Flow, Liquid Level, and Mechanical Motion Measuring Instruments, and moreby Defense Logistics Agency Signed by year:2000: $0; 2001: $396,030; 2002: $89,905; 2003: $221,547; 2004: $169,697; 2005: $406,492; 2006: $122,509.
Biggest contracts:
$119,780 with Defense Logistics Agency for Engine Fuel System Components, Aircraft and Missile Prime Movers. Signed on 2001-08-13. Completion date: 2002-01-28.
$113,106, same as above.Signed on 2001-08-30. Completion date: 2002-01-22.
$89,905, same as above.Signed on 2002-05-17. Completion date: 2003-08-26.
$77,040 with Defense Logistics Agency for Valves, Nonpowered. Signed on 2005-10-18. Completion date: 2006-01-24.
CONTROL CENTER INC (3517 SUTHERLAND AVE; small business) : $1,162,606 in 10 contractsfrom 2000 to 2005
Contracts for Valves, Nonpowered, Water Purification Equipment, Valves, Powered by Air Force, Tennessee Valley Authority Signed by year:2000: $61,365; 2001: $0; 2002: $202,882; 2003: $581,135; 2004: $0; 2005: $317,224; 2006: $0.
Biggest contracts:
$452,203 with Air Force for Valves, Nonpowered. Signed on 2003-09-29. Completion date: 2004-03-16.
$197,724 with Air Force for Water Purification Equipment. Signed on 2005-06-28. Completion date: 2005-10-26.
$119,500 with Air Force for Valves, Powered. Signed on 2005-08-22. Completion date: 2005-12-20.
$116,310, same as above.Signed on 2002-02-28. Completion date: 2002-04-30.
SON SHINE PRODUCE, INC (2801 SUTHERLAND AVE; small business) : $942,429 in 87 contractsfrom 2004 to 2006
Contracts for Fruits and Vegetables by Defense Logistics Agency Signed by year:2000: $0; 2001: $0; 2002: $0; 2003: $0; 2004: $206,705; 2005: $440,023; 2006: $295,701.
Biggest contracts:
$27,691 with Defense Logistics Agency for Fruits and Vegetables. Signed on 2004-11-21. Completion date: 2004-11-21.
$25,900, same as above.Signed on 2006-05-08. Completion date: 2006-05-08.
$24,852, same as above.Signed on 2005-01-23. Completion date: 2005-01-23.
$23,572, same as above.Signed on 2005-04-13. Completion date: 2005-04-13.
COPE ASSOCIATES, INC (2607 KINGSTON PIKE; small business) : $877,201 in 4 contractsfrom 2001 to 2005
$644,640 with Army for Administrative and Service Buildings. Signed on 2001-10-22. Completion date: 2002-04-17.
$227,521, same as above.Signed on 2002-09-11. Completion date: 2002-04-17.
$8,030, same as above.Signed on 2005-03-03. Completion date: 2002-04-17.
-$2,990, same as above.Signed on 2005-03-04. Completion date: 2002-04-17.
L & H TECHNOLOGIES INC (316 NANCY LYNN LN STE 12B) : $698,667 in 14 contractsfrom 2001 to 2005
Contracts for Purchase of Structures and Facilities -- Dams, Valves, Powered, Compressors and Vacuum Pumps by U.S. Army Corps of Engineers - civil program financing only, Army Signed by year:2000: $0; 2001: $576,547; 2002: $0; 2003: $0; 2004: $114,524; 2005: $7,596; 2006: $0.
Biggest contracts:
$576,254 with U.S. Army Corps of Engineers - civil program financing only for Purchase of Structures and Facilities -- Dams. Signed on 2001-07-25. Completion date: 2001-12-22.
$29,636, same as above.Signed on 2001-11-28. Completion date: 2001-12-22.
$23,652 with U.S. Army Corps of Engineers - civil program financing only for Valves, Powered. Signed on 2004-08-27. Completion date: 2004-09-30.
$23,652 with Army for Valves, Powered. Signed on 2004-08-27. Completion date: 2004-09-30.
EASY VAC INC (7922 NUBBINS RIDGE RD; small business) : $239,250 in 6 contractsfrom 2002 to 2006
Contracts for Lubrication and Fuel Dispensing Equipment, Power and Hand Pumps by Defense Logistics Agency Signed by year:2000: $0; 2001: $0; 2002: $36,762; 2003: $99,445; 2004: $97,822; 2005: $2,566; 2006: $2,655.
Biggest contracts:
$99,445 with Defense Logistics Agency for Lubrication and Fuel Dispensing Equipment. Signed on 2003-11-26. Completion date: 2004-01-25.
$95,172, same as above.Signed on 2004-05-27. Completion date: 2004-08-27.
$36,762 with Defense Logistics Agency for Lubrication and Fuel Dispensing Equipment. Taking place in CA. Signed on 2002-06-06. Completion date: 2002-08-06.
$2,655 with Defense Logistics Agency for Power and Hand Pumps. Signed on 2006-03-08. Completion date: 2006-04-10.
DYNAMIC SOLUTIONS LLC (322 NANCY LYNN LN STE 1; small business) : $208,333 in 5 contractsfrom 2004 to 2006
Contracts for Chemical/Biological Studies and Analyses, Environmental Studies and Assessments, Other Environmental Services, Studies, and Analytical Support, Other Research and Development -- Engineering Development (R&D) by Army Signed by year:2000: $0; 2001: $0; 2002: $0; 2003: $0; 2004: $28,815; 2005: $101,893; 2006: $77,625.
Biggest contracts:
$77,625 with Army for Chemical/Biological Studies and Analyses. Signed on 2006-05-05. Completion date: 2007-10-28.
$65,717 with Army for Environmental Studies and Assessments. Signed on 2005-05-25. Completion date: 2006-11-25.
$28,815 with Army for Other Environmental Services, Studies, and Analytical Support. Signed on 2004-09-23. Completion date: 2005-09-22.
$24,900 with Army for Other Research and Development -- Engineering Development (R&D). Signed on 2005-07-18. Completion date: 2005-09-30.
SI MODERNTECH (1626 DOWNTOWN WEST BLVD; small business) : $178,819 in 14 contractsfrom 2002 to 2006
Contracts for Miscellaneous Special Industry Machinery, ADP Software, , Technical Assistance, and moreby Air Force, NASA, Army, U.S. Army Corps of Engineers - civil program financing only, and others Signed by year:2000: $0; 2001: $0; 2002: $3,987; 2003: $16,000; 2004: $0; 2005: $140,872; 2006: $17,960.
Biggest contracts:
$61,025 with Air Force for Miscellaneous Special Industry Machinery. Signed on 2005-09-28. Completion date: 2005-11-28.
$21,831 with Air Force for ADP Software. Taking place in GA. Signed on 2005-04-07. Completion date: 2005-04-29.
$19,376 with Air Force for ADP Software. Signed on 2005-09-15. Completion date: 2005-09-28.
$19,010 with NASA for . Signed on 2006-04-24. Completion date: 2006-05-15.
Top industries in this zip code by the number of employees in 2005:
2002 - 2018 National Fire Incident Reporting System (NFIRS) incidents
According to the data from the years 2002 - 2018 the average number of fire incidents per year is 134. The highest number of reported fire incidents - 234 took place in 2007, and the least - 78 in 2017. The data has a dropping trend.
When looking into fire subcategories, the most reports belonged to: Outside Fires (42.1%), and Structure Fires (36.3%).
Fire incident types reported to NFIRS in Zip Code 37919

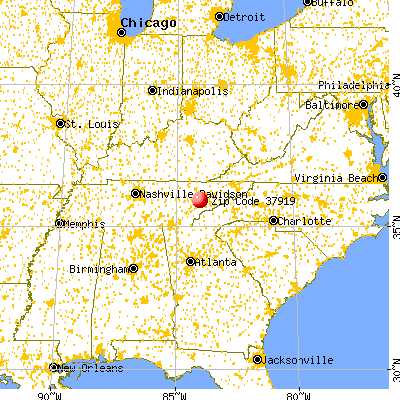


 Nearest zip codes: 37909, 37921, 37916, 37923, 37902, 37912.


 According to the data from the years 2002 - 2018 the average number of fire incidents per year is 134. The highest number of reported fire incidents - 234 took place in 2007, and the least - 78 in 2017. The data has a dropping trend.
 When looking into fire subcategories, the most reports belonged to: Outside Fires (42.1%), and Structure Fires (36.3%).