Estimated zip code population in 2022: 2,015 Zip code population in 2010: 2,052 Zip code population in 2000: 1,636
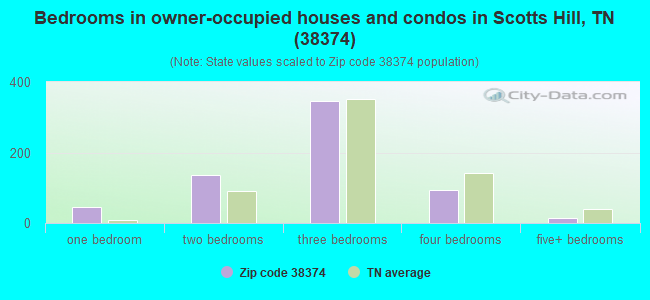
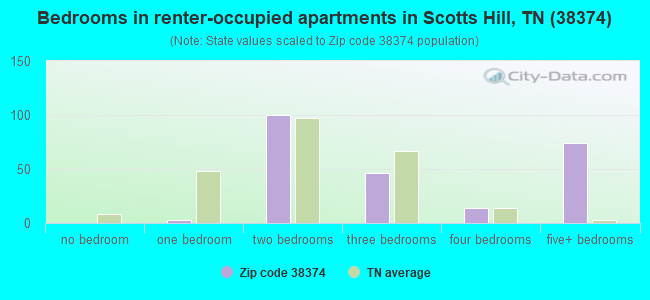
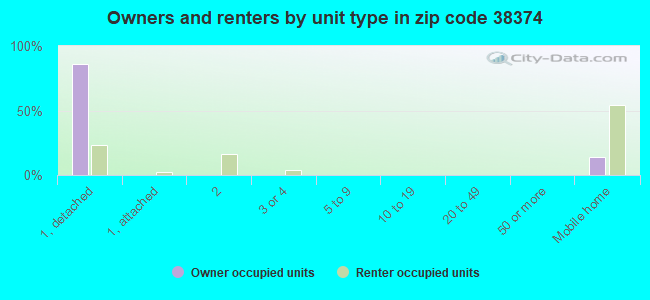
Houses and condos: 1,116 Renter-occupied apartments: 239
% of renters here:
27%
State:
33%
March 2022 cost of living index in zip code 38374: 79.2 (low, U.S. average is 100)
Land area: 44.0 sq. mi. Water area: 0.0 sq. mi.
Population density: 46 people per square mile
(very low).
OSM Map
General Map
Google Map
MSN Map
OSM Map
General Map
Google Map
MSN Map
OSM Map
General Map
Google Map
MSN Map
OSM Map
General Map
Google Map
MSN Map
Please wait while loading the map...
Real estate property taxes paid for housing units in 2022:
This zip code:
0.3% ($498)
Tennessee:
0.5% ($1,376)
Median real estate property taxes paid for housing units with mortgages in 2022: $447 (0.4%) Median real estate property taxes paid for housing units with no mortgage in 2022: $527 (0.4%)
Business Search- 14 Million verified businesses
Males: 968
(48.0%)
Females: 1,047
(52.0%)
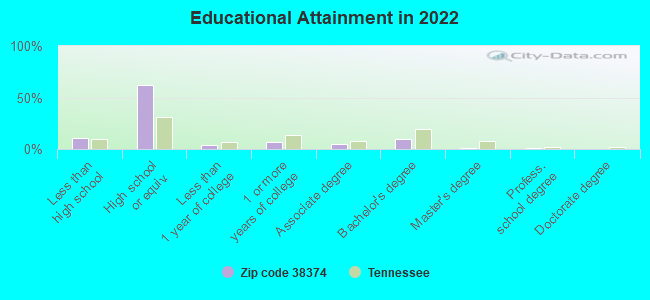
For population 25 years and over in 38374:
High school or higher: 88.2%
Bachelor's degree or higher: 12.0%
Graduate or professional degree: 2.4%
Unemployed: 1.2%
Mean travel time to work (commute): 25.3 minutes
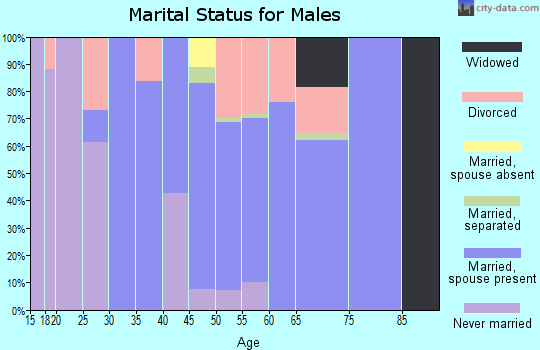
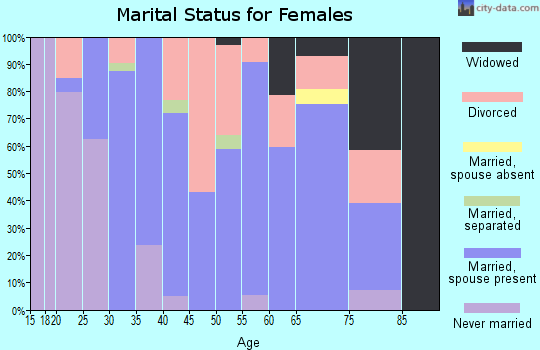
For population 15 years and over in 38374:
Never married: 22.4%
Now married: 51.7%
Separated: 0.0%
Widowed: 10.4%
Divorced: 15.5%
Zip code 38374 compared to state average:
Median household income below state average.
Median house value below state average.
Unemployed percentage significantly below state average.
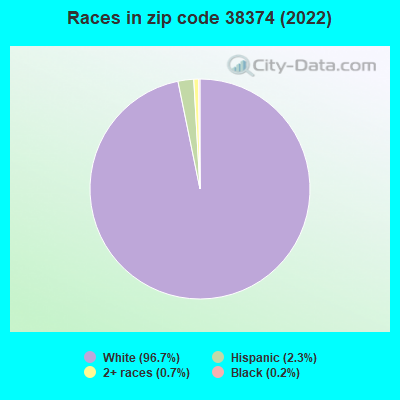
Black race population percentage significantly below state average.
Hispanic race population percentage below state average.
Median age significantly above state average.
Foreign-born population percentage significantly below state average.
Length of stay since moving in significantly above state average.
Number of college students below state average.
Percentage of population with a bachelor's degree or higher significantly below state average.
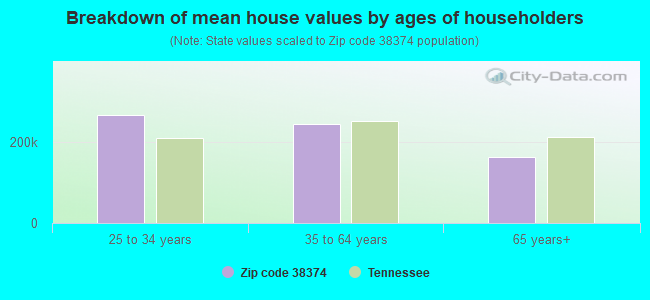
Estimated median house/condo value in 2022: $146,265
38374:
$146,265
Tennessee:
$284,800
According to our research of Tennessee and other state lists, there were 8 registered sex offenders living in 38374 zip code as of April 27, 2024. The ratio of all residents to sex offenders in zip code 38374 is 279 to 1. The ratio of registered sex offenders to all residents in this zip code is near the state average.
Median resident age:
This zip code:
50.8 years
Tennessee median age:
39.2 years
Average household size:
This zip code:
2.3 people
Tennessee:
2.4 people
Averages for the 2020 tax year for zip code 38374, filed in 2021:
Average Adjusted Gross Income (AGI) in 2020: $46,394 (Individual Income Tax Returns)
Here:
$46,394
State:
$69,014
Salary/wage: $40,246 (reported on 79.3% of returns)
Here:
$40,246
State:
$55,872
(% of AGI for various income ranges: 977.5% for AGIs below $25k, 3342.5% for AGIs $25k-50k, 5701.0% for AGIs $50k-75k, 6605.0% for AGIs $75k-100k, 14930.0% for AGIs $100k-200k)
Taxable interest for individuals: $762 (reported on 29.3% of returns)
This zip code:
$762
Tennessee:
$1,945
(% of AGI for various income ranges: 20.0% for AGIs below $25k, 6.0% for AGIs $25k-50k, 45.0% for AGIs $50k-75k, 25.0% for AGIs $75k-100k, 126.0% for AGIs $100k-200k)
Ordinary dividends: $1,867 (reported on 7.3% of returns)
Here:
$1,867
State:
$8,105
(% of AGI for various income ranges: 34.5% for AGIs $25k-50k, 71.7% for AGIs $75k-100k)
Net capital gain/loss in AGI: +$10,829 (reported on 8.5% of returns)
Here:
+$10,829
State:
+$33,664
(% of AGI for various income ranges: 17.9% for AGIs below $25k, 1191.7% for AGIs $75k-100k)
Profit/loss from business: +$10,564 (reported on 17.1% of returns)
Here:
+$10,564
State:
+$18,991
(% of AGI for various income ranges: 170.4% for AGIs below $25k, 38.0% for AGIs $25k-50k, 125.0% for AGIs $50k-75k, 1448.3% for AGIs $75k-100k)
Taxable individual retirement arrangement distribution: $10,650 (reported on 9.8% of returns)
38374:
$10,650
Tennessee:
$20,036
(% of AGI for various income ranges: 90.8% for AGIs below $25k, 128.5% for AGIs $25k-50k, 628.3% for AGIs $75k-100k)
Earned income credit: $2,295 (reported on 23.2% of returns)
Here:
$2,295
State:
$2,391
(% of AGI for various income ranges: 114.2% for AGIs below $25k, 81.0% for AGIs $25k-50k)
Percentage of individuals using paid preparers for their 2020 taxes: 96.3%
Here:
96%
State:
93%
(% for various income ranges: 93.8% for AGIs below $25k, 100.0% for AGIs $25k-50k, 91.7% for AGIs $50k-75k, 100.0% for AGIs $75k-100k, 100.0% for AGIs $100k-200k)
Averages for the 2012 tax year for zip code 38374, filed in 2013:
Average Adjusted Gross Income (AGI) in 2012: $40,455 (Individual Income Tax Returns)
Here:
$40,455
State:
$53,767
Salary/wage: $36,905 (reported on 81.8% of returns)
Here:
$36,905
State:
$45,421
(% of AGI for various income ranges: 71.4% for AGIs below $25k, 81.7% for AGIs $25k-50k, 82.1% for AGIs $50k-75k, 78.1% for AGIs $75k-100k, 57.6% for AGIs $100k-200k)
Taxable interest for individuals: $1,032 (reported on 28.6% of returns)
This zip code:
$1,032
Tennessee:
$1,732
(% of AGI for various income ranges: 1.3% for AGIs below $25k, 0.9% for AGIs $25k-50k, 0.4% for AGIs $50k-75k, 0.3% for AGIs $75k-100k, 0.7% for AGIs $100k-200k)
Ordinary dividends: $1,862 (reported on 10.4% of returns)
Here:
$1,862
State:
$6,739
Net capital gain/loss in AGI: +$3,283 (reported on 7.8% of returns)
Here:
+$3,283
State:
+$19,082
Profit/loss from business: +$6,869 (reported on 16.9% of returns)
Here:
+$6,869
State:
+$15,240
(% of AGI for various income ranges: 10.8% for AGIs below $25k, 3.3% for AGIs $25k-50k, 2.4% for AGIs $50k-75k)
Taxable individual retirement arrangement distribution: $12,871 (reported on 9.1% of returns)
38374:
$12,871
Tennessee:
$15,505
(% of AGI for various income ranges: 2.5% for AGIs below $25k, 4.0% for AGIs $25k-50k, 8.8% for AGIs $75k-100k)
Total itemized deductions: $20,209 (26% of AGI, reported on 14.3% of returns)
Here:
$20,209
State:
$21,976
Here:
25.8% of AGI
State:
17.8% of AGI
(% of AGI for various income ranges: 7.3% for AGIs $25k-50k, 7.9% for AGIs $50k-75k, 20.2% for AGIs $75k-100k)
Charity contributions: $5,343 (reported on 9.1% of returns)
Here:
$5,343
State:
$6,709
Taxes paid: $2,900 (reported on 14.3% of returns)
38374:
$2,900
State:
$4,829
(% of AGI for various income ranges: 0.6% for AGIs $25k-50k, 1.3% for AGIs $50k-75k, 1.4% for AGIs $75k-100k, 1.6% for AGIs $100k-200k)
Earned income credit: $2,220 (reported on 26.0% of returns)
Here:
$2,220
State:
$2,404
(% of AGI for various income ranges: 7.7% for AGIs below $25k, 1.4% for AGIs $25k-50k)
Percentage of individuals using paid preparers for their 2012 taxes: 67.5%
Here:
68%
State:
52%
(% for various income ranges: 64.7% for AGIs below $25k, 68.2% for AGIs $25k-50k, 63.6% for AGIs $50k-75k, 83.3% for AGIs $75k-100k, 75.0% for AGIs $100k-200k)
Averages for the 2004 tax year for zip code 38374, filed in 2005:
Average Adjusted Gross Income (AGI) in 2004: $30,286 (Individual Income Tax Returns)
Here:
$30,286
State:
$44,088
Salary/wage: $29,665 (reported on 84.8% of returns)
Here:
$29,665
State:
$38,825
(% of AGI for various income ranges: 105.3% for AGIs below $10k, 75.2% for AGIs $10k-25k, 89.6% for AGIs $25k-50k, 90.1% for AGIs $50k-75k, 79.2% for AGIs $75k-100k, 57.2% for AGIs over 100k)
Taxable interest for individuals: $945 (reported on 31.3% of returns)
This zip code:
$945
Tennessee:
$1,802
(% of AGI for various income ranges: 4.0% for AGIs below $10k, 2.7% for AGIs $10k-25k, 0.6% for AGIs $25k-50k, 0.5% for AGIs $50k-75k, 0.4% for AGIs $75k-100k, 0.3% for AGIs over 100k)
Taxable dividends: $1,247 (reported on 9.5% of returns)
Here:
$1,247
State:
$3,727
(% of AGI for various income ranges: 0.5% for AGIs $10k-25k, 0.2% for AGIs $25k-50k, 0.2% for AGIs $50k-75k, 2.1% for AGIs $75k-100k)
Net capital gain/loss: +$2,984 (reported on 7.5% of returns)
Here:
+$2,984
State:
+$15,776
(% of AGI for various income ranges: 0.3% for AGIs $10k-25k, 0.0% for AGIs $25k-50k, 0.0% for AGIs $50k-75k, 8.3% for AGIs $75k-100k)
Profit/loss from business: +$4,786 (reported on 18.9% of returns)
Here:
+$4,786
State:
+$12,882
(% of AGI for various income ranges: -15.8% for AGIs below $10k, 8.1% for AGIs $10k-25k, 1.9% for AGIs $25k-50k, 5.8% for AGIs $50k-75k)
IRA payment deduction: $1,824 (reported on 2.1% of returns)
38374:
$1,824
Tennessee:
$2,934
Total itemized deductions: $16,705 (27% of AGI, reported on 11.7% of returns)
Here:
$16,705
State:
$18,035
Here:
27.0% of AGI
State:
19.9% of AGI
(% of AGI for various income ranges: 4.1% for AGIs $10k-25k, 6.5% for AGIs $25k-50k, 6.1% for AGIs $50k-75k, 11.4% for AGIs $75k-100k, 8.4% for AGIs over 100k)
Charity contributions deductions: $3,123 (5% of AGI, reported on 9.0% of returns)
Here:
$3,123
State:
$5,167
Here:
4.7% of AGI
State:
5.3% of AGI
(% of AGI for various income ranges: 0.9% for AGIs $25k-50k, 1.2% for AGIs $50k-75k, 1.3% for AGIs $75k-100k, 1.7% for AGIs over 100k)
Total tax: $3,375 (reported on 71.1% of returns)
38374:
$3,375
State:
$7,482
(% of AGI for various income ranges: 3.3% for AGIs below $10k, 4.1% for AGIs $10k-25k, 6.0% for AGIs $25k-50k, 8.2% for AGIs $50k-75k, 11.0% for AGIs $75k-100k, 17.1% for AGIs over 100k)
Earned income credit: $1,620 (reported on 22.0% of returns)
Here:
$1,620
State:
$1,826
Percentage of individuals using paid preparers for their 2004 taxes: 73.7%
Here:
74%
State:
60%
(% for various income ranges: 64.9% for AGIs below $10k, 76.6% for AGIs $10k-25k, 77.5% for AGIs $25k-50k, 72.8% for AGIs $50k-75k, 69.6% for AGIs $75k-100k, 85.0% for AGIs over 100k)
Household received Food Stamps/SNAP in the past 12 months: 143 Household did not receive Food Stamps/SNAP in the past 12 months: 733
Women who had a birth in the past 12 months: 76 (77 now married, 0 unmarried) Women who did not have a birth in the past 12 months: 323 (85 now married, 237 unmarried)
Housing units in zip code 38374 with a mortgage: 182 Median monthly owner costs for units with a mortgage: $821 Median monthly owner costs for units without a mortgage: $400
Residents with income below the poverty level in 2022:
This zip code:
27.1%
Whole state:
13.3%
Residents with income below 50% of the poverty level in 2022:
This zip code:
21.7%
Whole state:
7.1%
Median number of rooms in houses and condos:
Here:
5.5
State:
6.5
Median number of rooms in apartments:
Here:
5.7
State:
4.4
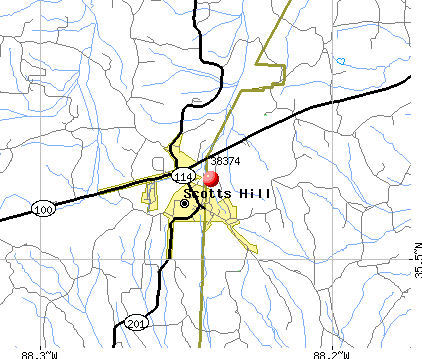
Notable locations in this zip code not listed on our city pages
Churches in zip code 38374 include: Smith Chapel (A), Fellowship Church (B), Liberty Church (C), Pentecost Church (D), Scotts Hill First Baptist Church (E), Judson Church (F), Corinth Church (G), Oak Grove Church (H). Display/hide their locations on the map
Cemeteries: Bethel Cemetery (1), Chumney Cemetery (2), Murphy Cemetery (3), Corinth Cemetery (4), Powers Cemetery (5), Presley Cemetery (6). Display/hide their locations on the map
Streams, rivers, and creeks: Laster Branch (A), Lacy Branch (B), Holland Branch (C), Hoad Branch (D), Gilbert Branch (E), Dry Branch (F), Colbert Branch (G), Browns Creek (H), East Fork Cane Creek (I). Display/hide their locations on the map
In group quarters: 5 (-1 institutionalized population)
Size of family households: 249 2-persons, 89 3-persons, 39 4-persons, 34 5-persons, 74 6-persons, 12 7-or-more-persons
Size of nonfamily households: 331 1-person, 44 2-persons
279 married couples with children.
31 single-parent households (31 women).
99.8% of residents of 38374 zip code speak English at home.
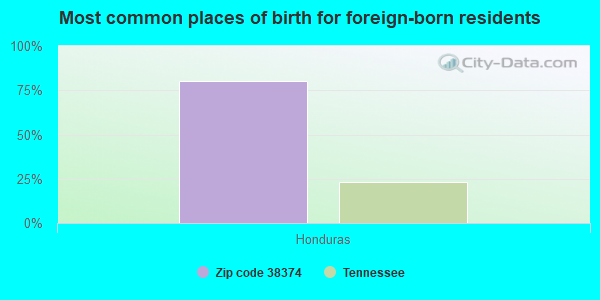
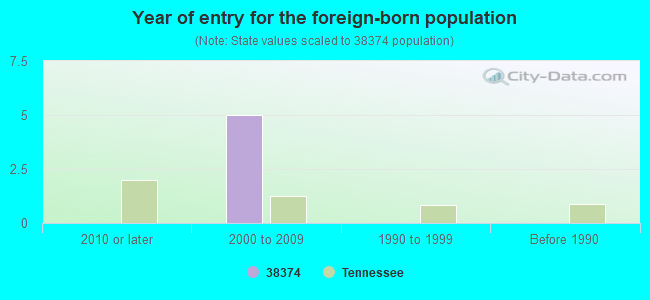
Foreign born population: 5 (0.3%) (0.0% of them are naturalized citizens)
:
0.3%
Whole state:
5.6%
80%Honduras
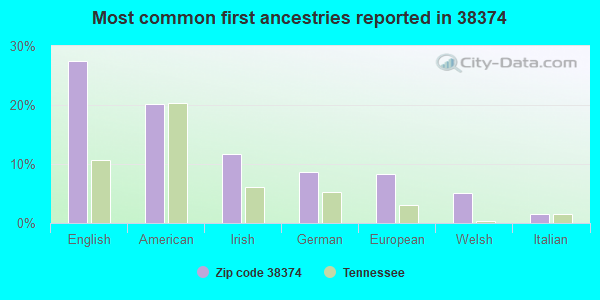
27%English
20%American
12%Irish
9%German
8%European
5%Welsh
2%Italian
Year of entry for the foreign-born population
02010 or later
52000 to 2009
01990 to 1999
0Before 1990
Facilities with environmental interests located in this zip code:
BRASHER JAMES M (92.2 N 281 Y Y Y / in SCOTTS HILL, TN)
(Resource Conservation and Recovery Act (tracking hazardous waste)) Business NAICS classification: MOTOR VEHICLE BODY MANUFACTURING.
Housing units lacking complete plumbing facilities: 4.9% Housing units lacking complete kitchen facilities: 5.3%
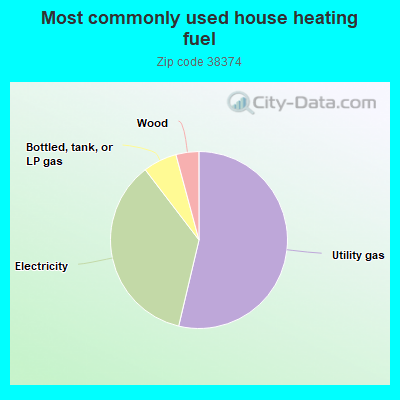
53.8%Utility gas
36.0%Electricity
6.2%Bottled, tank, or LP gas
4.2%Wood
Population in 1990: 1,657.
Place of birth for U.S.-born residents:
This state: 1,583
Northeast: 36
Midwest: 226
South: 104
West: 33
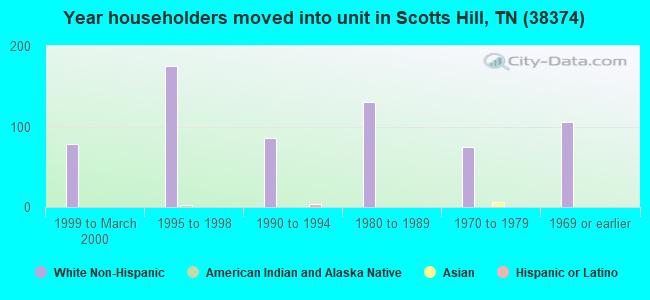
68% of the 38374 zip code residents lived in the same house 5 years ago. Out of people who lived in different houses, 40% lived in this county. Out of people who lived in different counties, 50% lived in Tennessee.
95% of the 38374 zip code residents lived in the same house 1 year ago. Out of people who lived in different houses, 76% moved from this county. Out of people who lived in different houses, 13% moved from different county within same state. Out of people who lived in different houses, 12% moved from different state.
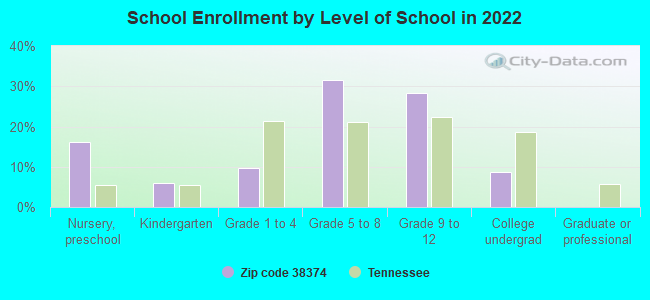
Private vs. public school enrollment:
Students in private schools in grades 1 to 8 (elementary and middle school):
Here:
0.0%
Tennessee:
15.0%
Students in private schools in grades 9 to 12 (high school):
Here:
0.0%
Tennessee:
16.2%
Students in private undergraduate colleges: 21
Here:
76.5%
Tennessee:
23.5%
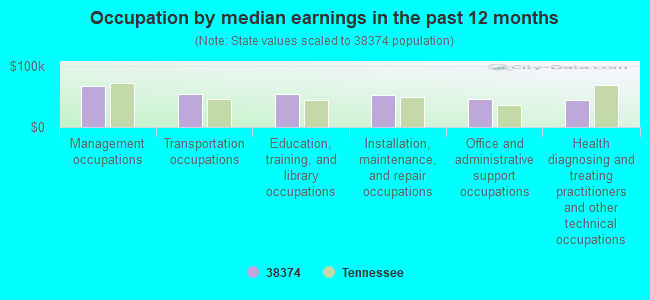
Occupation by median earnings in the past 12 months ($)
66,841Management occupations
53,872Transportation occupations
53,400Education, training, and library occupations
51,718Installation, maintenance, and repair occupations
45,643Office and administrative support occupations
44,584Health diagnosing and treating practitioners and other technical occupations
Top industries in this zip code by the number of employees in 2005:
Health Care and Social Assistance: Offices of Physicians (except Mental Health Specialists) (10-19: 2)
Finance and Insurance: Commercial Banking (5-9: 2)
People in group quarters in 2010:
7 people in group homes intended for adults
People in group quarters in 2000:
6 people in other group homes
Fatal accident statistics in 2013:
Fatal accident count: 1
Vehicles involved in fatal accidents: 1
Fatal accidents caused by drunken drivers: 1
Fatalities: 1
Persons involved in fatal accidents: 1
Pedestrians involved in fatal accidents: 0
Fatal accident statistics in 2012:
Fatal accident count: 1
Vehicles involved in fatal accidents: 1
Fatal accidents caused by drunken drivers: 0
Fatalities: 1
Persons involved in fatal accidents: 1
Pedestrians involved in fatal accidents: 0
2002 - 2018 National Fire Incident Reporting System (NFIRS) incidents
According to the data from the years 2002 - 2018 the average number of fire incidents per year is 16. The highest number of reported fires - 27 took place in 2010, and the least - 8 in 2017. The data has a rising trend.
When looking into fire subcategories, the most incidents belonged to: Outside Fires (40.7%), and Structure Fires (37.5%).
Fire incident types reported to NFIRS in Zip Code 38374

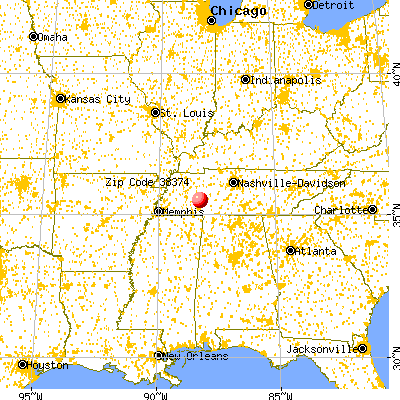


 Nearest zip codes: 38371, 38368, 38370, 38329, 38311, 38328.


 According to the data from the years 2002 - 2018 the average number of fire incidents per year is 16. The highest number of reported fires - 27 took place in 2010, and the least - 8 in 2017. The data has a rising trend.
 When looking into fire subcategories, the most incidents belonged to: Outside Fires (40.7%), and Structure Fires (37.5%).