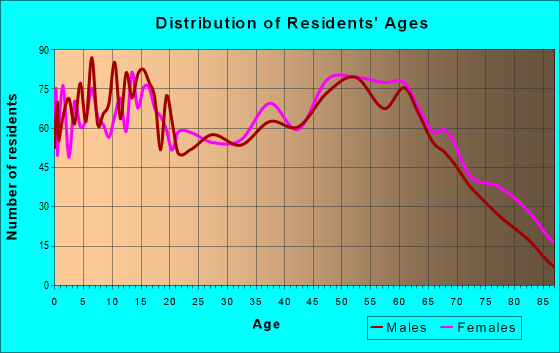
Estimated zip code population in 2022: 10,331 Zip code population in 2010: 10,297 Zip code population in 2000: 9,788
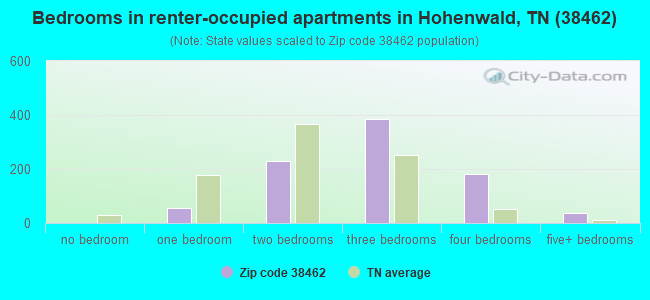
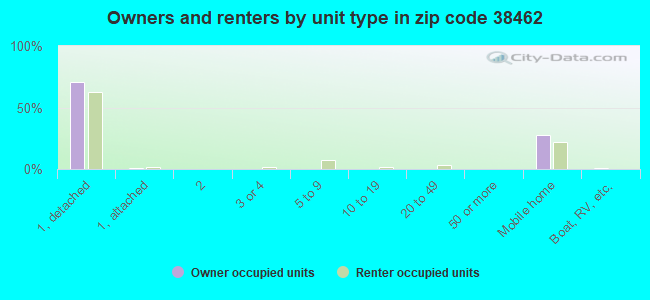
Houses and condos: 4,750 Renter-occupied apartments: 895
% of renters here:
21%
State:
33%
March 2022 cost of living index in zip code 38462: 79.6 (low, U.S. average is 100)
Land area: 198.3 sq. mi. Water area: 0.2 sq. mi.
Population density: 52 people per square mile
(very low).
OSM Map
General Map
Google Map
MSN Map
OSM Map
General Map
Google Map
MSN Map
OSM Map
General Map
Google Map
MSN Map
OSM Map
General Map
Google Map
MSN Map
Please wait while loading the map...
Real estate property taxes paid for housing units in 2022:
This zip code:
0.4% ($710)
Tennessee:
0.5% ($1,376)
Median real estate property taxes paid for housing units with mortgages in 2022: $902 (0.4%) Median real estate property taxes paid for housing units with no mortgage in 2022: $656 (0.5%)
Averages for the 2020 tax year for zip code 38462, filed in 2021:
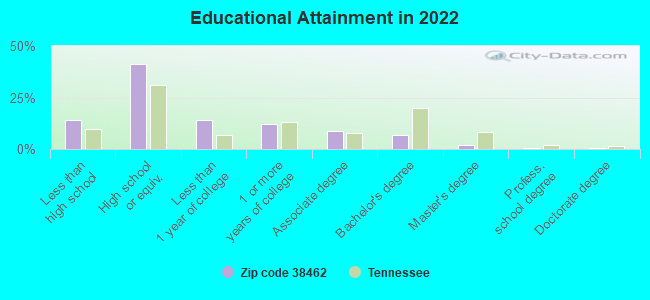
Average Adjusted Gross Income (AGI) in 2020: $50,678 (Individual Income Tax Returns)
Here:
$50,678
State:
$69,014
Salary/wage: $41,415 (reported on 80.8% of returns)
Here:
$41,415
State:
$55,872
(% of AGI for various income ranges: 1093.3% for AGIs below $25k, 3391.5% for AGIs $25k-50k, 6209.0% for AGIs $50k-75k, 8461.5% for AGIs $75k-100k, 15967.1% for AGIs $100k-200k, 47170.0% for AGIs over 200k)
Taxable interest for individuals: $1,046 (reported on 25.5% of returns)
This zip code:
$1,046
Tennessee:
$1,945
(% of AGI for various income ranges: 16.1% for AGIs below $25k, 20.5% for AGIs $25k-50k, 46.9% for AGIs $50k-75k, 20.0% for AGIs $75k-100k, 92.9% for AGIs $100k-200k, 1330.0% for AGIs over 200k)
Ordinary dividends: $2,545 (reported on 6.5% of returns)
Here:
$2,545
State:
$8,105
(% of AGI for various income ranges: 8.9% for AGIs below $25k, 12.0% for AGIs $25k-50k, 19.2% for AGIs $50k-75k, 18.9% for AGIs $75k-100k, 60.5% for AGIs $100k-200k, 1065.0% for AGIs over 200k)
Net capital gain/loss in AGI: +$16,606 (reported on 7.4% of returns)
Here:
+$16,606
State:
+$33,664
(% of AGI for various income ranges: 14.4% for AGIs below $25k, 22.3% for AGIs $25k-50k, 39.6% for AGIs $50k-75k, 194.4% for AGIs $75k-100k, 423.3% for AGIs $100k-200k, 17145.0% for AGIs over 200k)
Profit/loss from business: +$15,838 (reported on 16.3% of returns)
Here:
+$15,838
State:
+$18,991
(% of AGI for various income ranges: 183.0% for AGIs below $25k, 159.6% for AGIs $25k-50k, 320.2% for AGIs $50k-75k, 278.1% for AGIs $75k-100k, 2394.8% for AGIs $100k-200k)
Taxable individual retirement arrangement distribution: $14,577 (reported on 5.8% of returns)
38462:
$14,577
Tennessee:
$20,036
(% of AGI for various income ranges: 41.1% for AGIs below $25k, 53.7% for AGIs $25k-50k, 108.1% for AGIs $50k-75k, 241.1% for AGIs $75k-100k, 693.3% for AGIs $100k-200k)
Total itemized deductions: $44,638 (reported on 1.8% of returns)
Here:
$44,638
State:
$40,136
(% of AGI for various income ranges: 295.8% for AGIs $50k-75k, 480.5% for AGIs $100k-200k, 5120.0% for AGIs over 200k)
Charity contributions: $16,186 (reported on 1.6% of returns)
Here:
$16,186
State:
$19,852
(% of AGI for various income ranges: 191.1% for AGIs $75k-100k, 3085.0% for AGIs over 200k)
Taxes paid: $5,112 (reported on 1.8% of returns)
38462:
$5,112
State:
$6,038
(% of AGI for various income ranges: 24.0% for AGIs $50k-75k, 51.9% for AGIs $100k-200k, 875.0% for AGIs over 200k)
Earned income credit: $2,445 (reported on 23.3% of returns)
Here:
$2,445
State:
$2,391
(% of AGI for various income ranges: 118.9% for AGIs below $25k, 90.7% for AGIs $25k-50k, 2.1% for AGIs $50k-75k)
Percentage of individuals using paid preparers for their 2020 taxes: 94.6%
Here:
95%
State:
93%
(% for various income ranges: 94.1% for AGIs below $25k, 95.5% for AGIs $25k-50k, 92.6% for AGIs $50k-75k, 94.4% for AGIs $75k-100k, 97.1% for AGIs $100k-200k, 100.0% for AGIs over 200k)
Averages for the 2012 tax year for zip code 38462, filed in 2013:
Average Adjusted Gross Income (AGI) in 2012: $35,995 (Individual Income Tax Returns)
Here:
$35,995
State:
$53,767
Salary/wage: $31,729 (reported on 81.4% of returns)
Here:
$31,729
State:
$45,421
(% of AGI for various income ranges: 72.3% for AGIs below $25k, 78.0% for AGIs $25k-50k, 77.8% for AGIs $50k-75k, 75.7% for AGIs $75k-100k, 69.2% for AGIs $100k-200k, 36.4% for AGIs over 200k)
Taxable interest for individuals: $1,115 (reported on 26.7% of returns)
This zip code:
$1,115
Tennessee:
$1,732
(% of AGI for various income ranges: 1.3% for AGIs below $25k, 0.8% for AGIs $25k-50k, 0.8% for AGIs $50k-75k, 0.5% for AGIs $75k-100k, 0.5% for AGIs $100k-200k, 1.0% for AGIs over 200k)
Ordinary dividends: $2,117 (reported on 7.6% of returns)
Here:
$2,117
State:
$6,739
(% of AGI for various income ranges: 0.8% for AGIs below $25k, 0.5% for AGIs $25k-50k, 0.1% for AGIs $50k-75k, 0.3% for AGIs $75k-100k, 0.7% for AGIs $100k-200k)
Net capital gain/loss in AGI: +$4,875 (reported on 7.1% of returns)
Here:
+$4,875
State:
+$19,082
(% of AGI for various income ranges: 0.5% for AGIs below $25k, 0.6% for AGIs $25k-50k, 1.1% for AGIs $50k-75k, 0.4% for AGIs $75k-100k, 3.3% for AGIs $100k-200k)
Profit/loss from business: +$11,329 (reported on 19.1% of returns)
Here:
+$11,329
State:
+$15,240
(% of AGI for various income ranges: 12.3% for AGIs below $25k, 4.2% for AGIs $25k-50k, 1.0% for AGIs $50k-75k, 2.8% for AGIs $75k-100k, 17.1% for AGIs $100k-200k)
Taxable individual retirement arrangement distribution: $11,293 (reported on 6.9% of returns)
38462:
$11,293
Tennessee:
$15,505
(% of AGI for various income ranges: 2.3% for AGIs below $25k, 1.6% for AGIs $25k-50k, 1.7% for AGIs $50k-75k, 2.7% for AGIs $75k-100k, 4.9% for AGIs $100k-200k)
Total itemized deductions: $19,580 (25% of AGI, reported on 13.0% of returns)
Here:
$19,580
State:
$21,976
Here:
24.5% of AGI
State:
17.8% of AGI
(% of AGI for various income ranges: 4.4% for AGIs below $25k, 6.1% for AGIs $25k-50k, 7.4% for AGIs $50k-75k, 8.3% for AGIs $75k-100k, 9.5% for AGIs $100k-200k, 9.1% for AGIs over 200k)
Charity contributions: $5,169 (reported on 9.2% of returns)
Here:
$5,169
State:
$6,709
(% of AGI for various income ranges: 0.5% for AGIs below $25k, 0.9% for AGIs $25k-50k, 1.2% for AGIs $50k-75k, 1.7% for AGIs $75k-100k, 2.2% for AGIs $100k-200k, 2.7% for AGIs over 200k)
Taxes paid: $3,492 (reported on 12.5% of returns)
38462:
$3,492
State:
$4,829
(% of AGI for various income ranges: 0.6% for AGIs below $25k, 0.8% for AGIs $25k-50k, 1.1% for AGIs $50k-75k, 1.4% for AGIs $75k-100k, 1.8% for AGIs $100k-200k, 2.8% for AGIs over 200k)
Earned income credit: $2,405 (reported on 31.8% of returns)
Here:
$2,405
State:
$2,404
(% of AGI for various income ranges: 9.5% for AGIs below $25k, 1.7% for AGIs $25k-50k)
Percentage of individuals using paid preparers for their 2012 taxes: 53.7%
Here:
54%
State:
52%
(% for various income ranges: 51.7% for AGIs below $25k, 52.9% for AGIs $25k-50k, 57.1% for AGIs $50k-75k, 59.1% for AGIs $75k-100k, 64.3% for AGIs $100k-200k, 66.7% for AGIs over 200k)
Averages for the 2004 tax year for zip code 38462, filed in 2005:
Average Adjusted Gross Income (AGI) in 2004: $31,167 (Individual Income Tax Returns)
Here:
$31,167
State:
$44,088
Salary/wage: $28,950 (reported on 85.5% of returns)
Here:
$28,950
State:
$38,825
(% of AGI for various income ranges: 116.2% for AGIs below $10k, 78.9% for AGIs $10k-25k, 84.1% for AGIs $25k-50k, 85.8% for AGIs $50k-75k, 78.5% for AGIs $75k-100k, 49.3% for AGIs over 100k)
Taxable interest for individuals: $1,623 (reported on 27.3% of returns)
This zip code:
$1,623
Tennessee:
$1,802
(% of AGI for various income ranges: 4.5% for AGIs below $10k, 1.9% for AGIs $10k-25k, 1.2% for AGIs $25k-50k, 0.9% for AGIs $50k-75k, 1.4% for AGIs $75k-100k, 1.8% for AGIs over 100k)
Taxable dividends: $1,172 (reported on 10.5% of returns)
Here:
$1,172
State:
$3,727
(% of AGI for various income ranges: 0.9% for AGIs below $10k, 0.6% for AGIs $10k-25k, 0.2% for AGIs $25k-50k, 0.3% for AGIs $50k-75k, 0.6% for AGIs $75k-100k, 0.5% for AGIs over 100k)
Net capital gain/loss: +$6,714 (reported on 9.2% of returns)
Here:
+$6,714
State:
+$15,776
(% of AGI for various income ranges: -0.4% for AGIs below $10k, 0.4% for AGIs $10k-25k, 1.1% for AGIs $25k-50k, 1.8% for AGIs $50k-75k, 3.6% for AGIs $75k-100k, 5.5% for AGIs over 100k)
Profit/loss from business: +$8,730 (reported on 20.4% of returns)
Here:
+$8,730
State:
+$12,882
(% of AGI for various income ranges: -2.3% for AGIs below $10k, 7.2% for AGIs $10k-25k, 3.8% for AGIs $25k-50k, 2.4% for AGIs $50k-75k, 4.2% for AGIs $75k-100k, 18.0% for AGIs over 100k)
IRA payment deduction: $2,946 (reported on 2.4% of returns)
38462:
$2,946
Tennessee:
$2,934
(% of AGI for various income ranges: 0.1% for AGIs $10k-25k, 0.3% for AGIs $25k-50k, 0.2% for AGIs $50k-75k, 0.4% for AGIs $75k-100k)
Total itemized deductions: $15,916 (24% of AGI, reported on 13.1% of returns)
Here:
$15,916
State:
$18,035
Here:
24.4% of AGI
State:
19.9% of AGI
(% of AGI for various income ranges: 5.8% for AGIs below $10k, 4.9% for AGIs $10k-25k, 5.4% for AGIs $25k-50k, 7.3% for AGIs $50k-75k, 8.9% for AGIs $75k-100k, 9.2% for AGIs over 100k)
Charity contributions deductions: $4,765 (7% of AGI, reported on 10.3% of returns)
Here:
$4,765
State:
$5,167
Here:
6.7% of AGI
State:
5.3% of AGI
(% of AGI for various income ranges: 0.8% for AGIs $10k-25k, 0.9% for AGIs $25k-50k, 1.5% for AGIs $50k-75k, 1.9% for AGIs $75k-100k, 4.3% for AGIs over 100k)
Total tax: $3,898 (reported on 68.6% of returns)
38462:
$3,898
State:
$7,482
(% of AGI for various income ranges: 4.1% for AGIs below $10k, 3.9% for AGIs $10k-25k, 5.8% for AGIs $25k-50k, 8.5% for AGIs $50k-75k, 10.9% for AGIs $75k-100k, 20.1% for AGIs over 100k)
Earned income credit: $1,797 (reported on 26.0% of returns)
Here:
$1,797
State:
$1,826
Percentage of individuals using paid preparers for their 2004 taxes: 66.1%
Here:
66%
State:
60%
(% for various income ranges: 61.7% for AGIs below $10k, 69.2% for AGIs $10k-25k, 63.4% for AGIs $25k-50k, 71.2% for AGIs $50k-75k, 65.3% for AGIs $75k-100k, 75.9% for AGIs over 100k)
Household received Food Stamps/SNAP in the past 12 months: 860 Household did not receive Food Stamps/SNAP in the past 12 months: 3,458
Women who had a birth in the past 12 months: 94 (45 now married, 47 unmarried) Women who did not have a birth in the past 12 months: 2,103 (1,079 now married, 1,024 unmarried)
Housing units in zip code 38462 with a mortgage: 1,642 (137 second mortgage, 76 both second mortgage and home equity loan) Houses without a mortgage: 262
Median monthly owner costs for units with a mortgage: $1,132 Median monthly owner costs for units without a mortgage: $388
Residents with income below the poverty level in 2022:
This zip code:
18.6%
Whole state:
13.3%
Residents with income below 50% of the poverty level in 2022:
This zip code:
14.1%
Whole state:
7.1%
Median number of rooms in houses and condos:
Here:
6.4
State:
6.5
Median number of rooms in apartments:
Here:
5.5
State:
4.4
Notable locations in this zip code not listed on our city pages
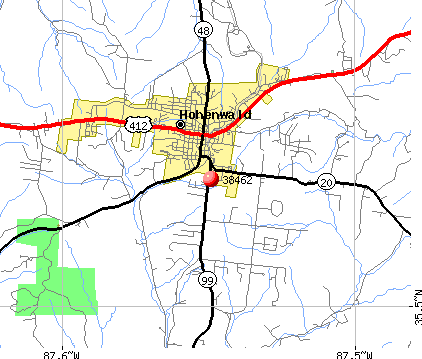
Notable locations in zip code 38462: Swan Valley Overlook (A), Lewis Park (B), Farmers Exchange (C), Lewis County Volunteer Fire Department (D), Hohenwald Fire Department (E), Lewis County Nursing Home (F), Lewis County Library (G), Lewis County Courthouse (H). Display/hide their locations on the map
Churches in zip code 38462 include: Buffalo Valley United Methodist Church (A), Lomax Church of Christ (B), Fairview Church (C), Pineview Church (D), Loveless Church (E), Springer Ridge Church (F), Flat Rock Church (G), Slippery Church (H), Little Swan Church (I). Display/hide their locations on the map
Cemeteries: Johnson Cemetery (1), Voorhies Cemetery (2), Pioneer Cemetery (3), Banks Cemetery (4), Beatty Cemetery (5), Bethel Cemetery (6), Mannie Cemetery (7). Display/hide their locations on the map
Lakes and reservoirs: Slag Pile Pond (A), Dan Maddox Fishing Lake (B), Highland Lake (C), Lake Highland (D), Napier Lake (E), Jackson Lake (F), Napier Diversion Lake (G). Display/hide their locations on the map
Streams, rivers, and creeks: Little Swan Creek (A), Little Buffalo River (B), Keeling Branch (C), Hurricane Branch (D), Hick Hill Branch (E), Hale Branch (F), Eel Branch (G), Durham Branch (H), Cow Hollow Branch (I). Display/hide their locations on the map
In group quarters: 229 (-1 institutionalized population)
Size of family households: 1,418 2-persons, 587 3-persons, 374 4-persons, 194 5-persons, 105 6-persons, 114 7-or-more-persons
Size of nonfamily households: 1,352 1-person, 144 2-persons, 41 3-persons
1,080 married couples with children.
432 single-parent households (432 women).
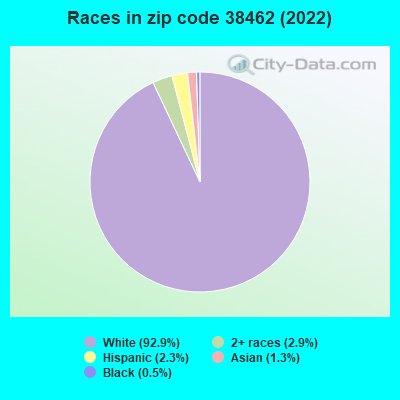
96.8% of residents of 38462 zip code speak English at home.
1.7% of residents speak Spanish at home (89% very well, 11% well).
0.9% of residents speak other Indo-European language at home (79% very well, 21% well).
0.4% of residents speak Asian or Pacific Island language at home (100% very well).
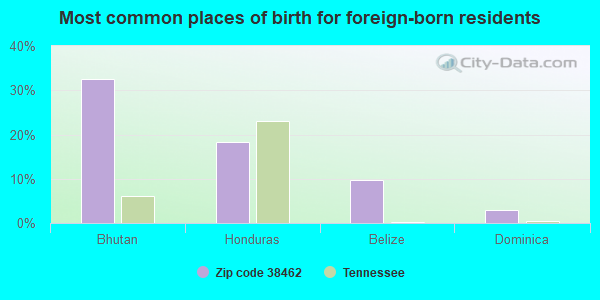
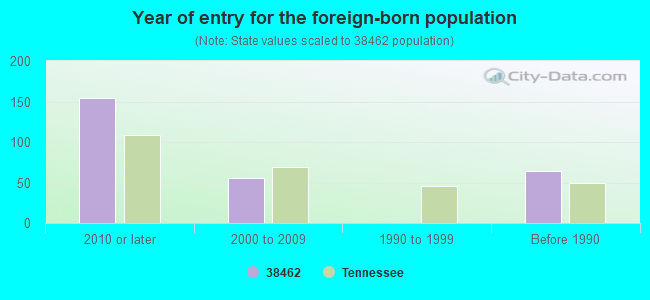
Foreign born population: 175 (1.7%) (36.0% of them are naturalized citizens)
This zip code:
1.7%
Whole state:
5.6%
33%Bhutan
18%Honduras
10%Belize
3%Dominica
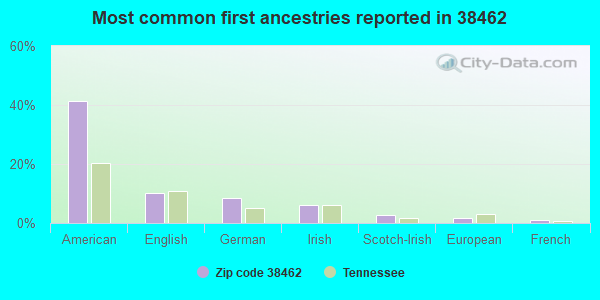
41%American
10%English
8%German
6%Irish
3%Scotch-Irish
2%European
1%French
Year of entry for the foreign-born population
1542010 or later
552000 to 2009
01990 to 1999
64Before 1990
Facilities with environmental interests located in this zip code:
DANA CORPORATION BOSTON WEATHERHEAD DIVISION (609 SWAN AVENUE in HOHENWALD, TN)
AIR MAJOR (AIRS/AFS) - ICIS-04-2005-1783, ENFORCEMENT/COMPLIANCE ACTIVITY CRITERIA AND HAZARDOUS AIR POLLUTANT INVENTORY (Inventory of air pollution sources) HAZARDOUS WASTE BIENNIAL REPORTER (Resource Conservation and Recovery Act (tracking hazardous waste)) Small Quantity Generators, between 100 kg and 1000 kg of hazardous waste/month (Resource Conservation and Recovery Act (tracking hazardous waste)) TSD (Resource Conservation and Recovery Act (tracking hazardous waste)) TRI REPORTER (Tracking of toxic chemicals releasing facilities) Business SIC classification: RUBBER AND PLASTICS HOSE AND BELTING Business NAICS classification: RUBBER AND PLASTICS HOSES AND BELTING MANUFACTURING. Organizations: DICK BOOZ (CONTACT/OPERATOR)
, EATON AEROQUIP INC (CONTACT/OWNER)
Alternative names: BOSTON WEATHERHEAD -DANA CORP., EATON AEROQUIP INC
ANDERSON EDDIE (32 E LINDEN STREET in HOHENWALD, TN)
(Resource Conservation and Recovery Act (tracking hazardous waste))
CERTIFIED INDUSTRIES CORP. (123 CERTIFIED DRIVE in HOHENWALD, TN)
AIR MINOR (AIRS/AFS) Business SIC classification: PLASTICS PRODUCTS
Housing units lacking complete plumbing facilities: 4.8% Housing units lacking complete kitchen facilities: 4.6%
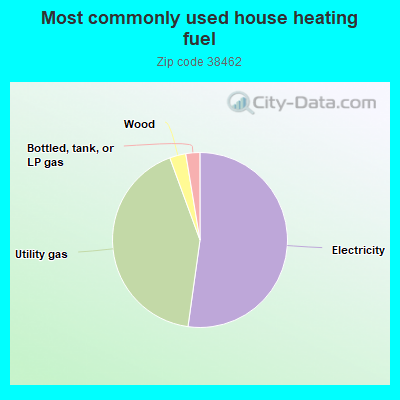
52.2%Electricity
42.2%Utility gas
3.0%Wood
2.6%Bottled, tank, or LP gas
Population in 1990: 8,004. Population change in the 1990s: +1,784 (+22.3%).
Place of birth for U.S.-born residents:
This state: 7,023
Northeast: 434
Midwest: 1,108
South: 1,099
West: 340
58% of the 38462 zip code residents lived in the same house 5 years ago. Out of people who lived in different houses, 58% lived in this county. Out of people who lived in different counties, 50% lived in Tennessee.
91% of the 38462 zip code residents lived in the same house 1 year ago. Out of people who lived in different houses, 35% moved from this county. Out of people who lived in different houses, 50% moved from different county within same state. Out of people who lived in different houses, 12% moved from different state. Out of people who lived in different houses, 5% moved from abroad.
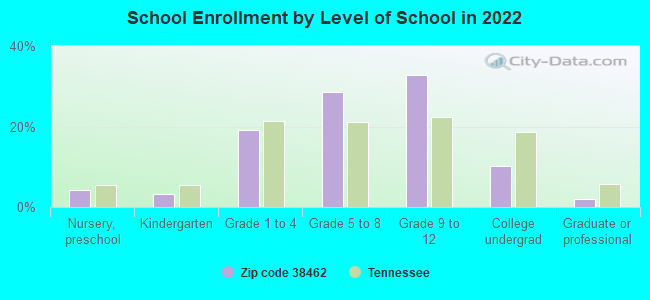
Private vs. public school enrollment:
Students in private schools in grades 1 to 8 (elementary and middle school): 17
Here:
2.1%
Tennessee:
15.0%
Students in private schools in grades 9 to 12 (high school): 49
Here:
8.5%
Tennessee:
16.2%
Students in private undergraduate colleges: 37
Here:
20.6%
Tennessee:
23.5%
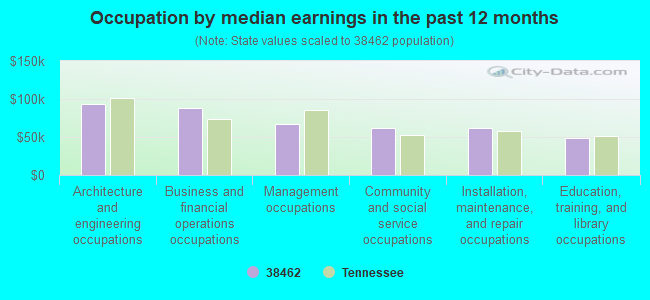
Occupation by median earnings in the past 12 months ($)
93,633Architecture and engineering occupations
88,642Business and financial operations occupations
67,157Management occupations
62,289Community and social service occupations
61,282Installation, maintenance, and repair occupations
48,597Education, training, and library occupations
Companies with federal contracts located in this zip code:
MEMCO LLC (243 FORREST AVE in HOHENWALD, TN; small business) : $544,740 in 9 contractsfrom 2003 to 2006
Contracts for Cable, Cord, and Wire Assemblies: Communications Equipment, Electrical and Electronic assemblies, Boards, Cards, and Associated Hardware by Navy, Army Signed by year:2000: $0; 2001: $0; 2002: $0; 2003: $275,550; 2004: $134,950; 2005: $127,340; 2006: $6,900.
Biggest contracts:
$165,000 with Navy for Cable, Cord, and Wire Assemblies: Communications Equipment. Signed on 2003-12-31. Completion date: 2004-08-20.
$88,000 with Army for Electrical and Electronic assemblies, Boards, Cards, and Associated Hardware. Signed on 2005-04-20. Completion date: 2006-04-30.
$82,000, same as above.Signed on 2004-08-31. Completion date: 2005-05-31.
$82,000, same as above.Signed on 2003-08-15. Completion date: 2004-12-01.
Top industries in this zip code by the number of employees in 2005:
Health Care and Social Assistance: Nursing Care Facilities (100-249 employees: 1 establishment)
Health Care and Social Assistance: Child and Youth Services (50-99: 1, 5-9: 1)
Health Care and Social Assistance: Residential Mental Health and Substance Abuse Facilities (50-99: 1)
People in group quarters in 2010:
124 people in nursing facilities/skilled-nursing facilities
60 people in local jails and other municipal confinement facilities
28 people in residential treatment centers for adults
5 people in group homes intended for adults
People in group quarters in 2000:
130 people in nursing homes
33 people in short-term care, detention or diagnostic centers for delinquent children
32 people in residential treatment centers for emotionally disturbed children
31 people in local jails and other confinement facilities (including police lockups)
7 people in other nonhousehold living situations
Fatal accident statistics in 2010:
Fatal accident count: 5
Vehicles involved in fatal accidents: 5
Fatal accidents caused by drunken drivers: 3
Fatalities: 5
Persons involved in fatal accidents: 5
Pedestrians involved in fatal accidents: 0
2002 - 2018 National Fire Incident Reporting System (NFIRS) incidents
Based on the data from the years 2002 - 2018 the average number of fires per year is 39. The highest number of fire incidents - 55 took place in 2009, and the least - 25 in 2013. The data has a rising trend.
When looking into fire subcategories, the most incidents belonged to: Structure Fires (42.2%), and Outside Fires (35.4%).
Fire incident types reported to NFIRS in Zip Code 38462


 Nearest zip codes: 37033, 38461, 38483, 38464, 38485, 38454.
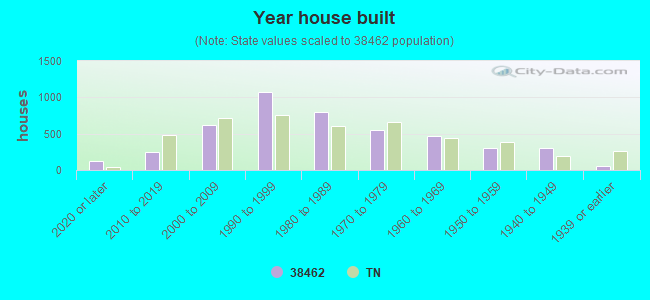


 Based on the data from the years 2002 - 2018 the average number of fires per year is 39. The highest number of fire incidents - 55 took place in 2009, and the least - 25 in 2013. The data has a rising trend.
 When looking into fire subcategories, the most incidents belonged to: Structure Fires (42.2%), and Outside Fires (35.4%).