Estimated zip code population in 2022: 3,512 Zip code population in 2010: 3,404 Zip code population in 2000: 3,329
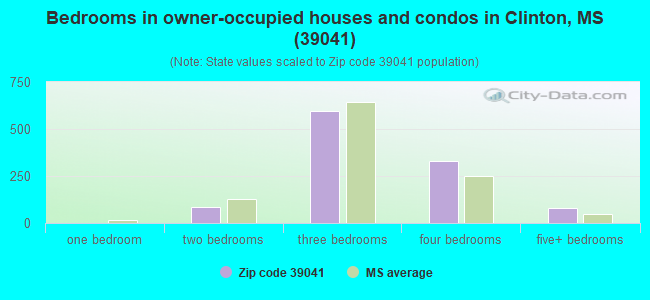
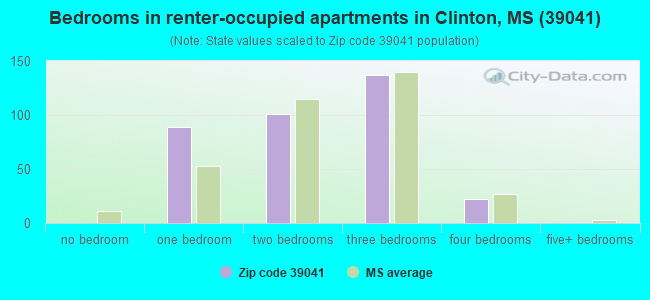
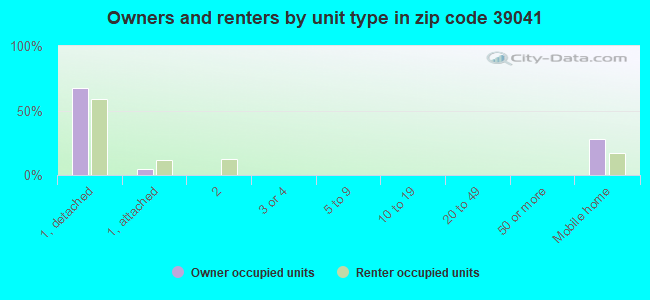
Houses and condos: 1,563 Renter-occupied apartments: 346
% of renters here:
24%
State:
30%
March 2022 cost of living index in zip code 39041: 79.0 (low, U.S. average is 100)
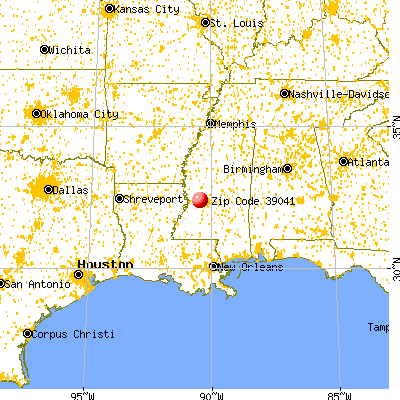
Land area: 128.9 sq. mi. Water area: 1.1 sq. mi.
Population density: 27 people per square mile
(very low).
OSM Map
General Map
Google Map
MSN Map
OSM Map
General Map
Google Map
MSN Map
OSM Map
General Map
Google Map
MSN Map
OSM Map
General Map
Google Map
MSN Map
Please wait while loading the map...
Real estate property taxes paid for housing units in 2022:
This zip code:
0.3% ($532)
Mississippi:
0.7% ($1,161)
Median real estate property taxes paid for housing units with mortgages in 2022: $884 (0.4%) Median real estate property taxes paid for housing units with no mortgage in 2022: $376 (0.2%)
Business Search- 14 Million verified businesses
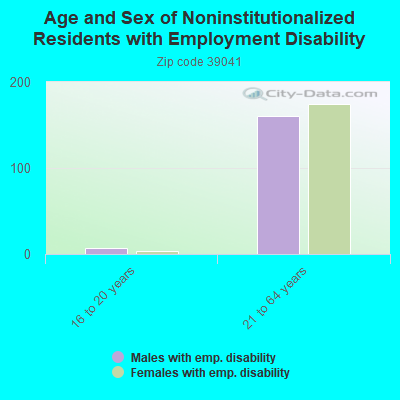
Males: 1,836
(52.3%)
Females: 1,675
(47.7%)
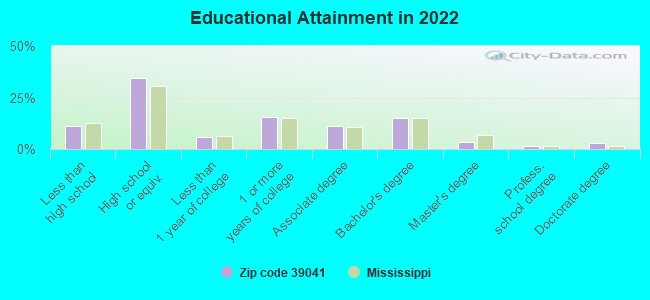
For population 25 years and over in 39041:
High school or higher: 88.5%
Bachelor's degree or higher: 22.1%
Graduate or professional degree: 7.3%
Unemployed: 5.1%
Mean travel time to work (commute): 29.5 minutes
For population 15 years and over in 39041:
Never married: 27.8%
Now married: 44.9%
Separated: 2.9%
Widowed: 14.9%
Divorced: 9.5%
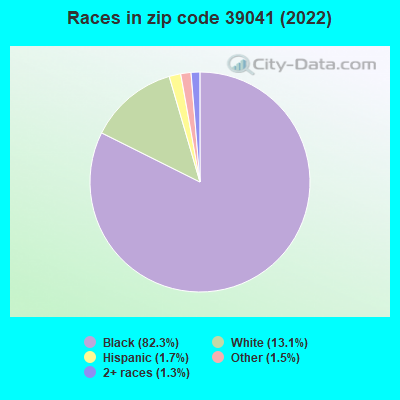
Zip code 39041 compared to state average:
Black race population percentage above state average.
Hispanic race population percentage below state average.
Median age significantly above state average.
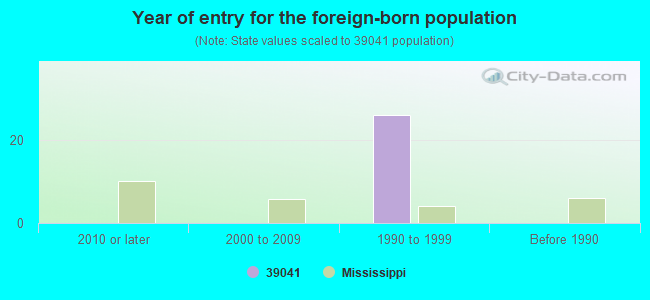
Foreign-born population percentage significantly below state average.
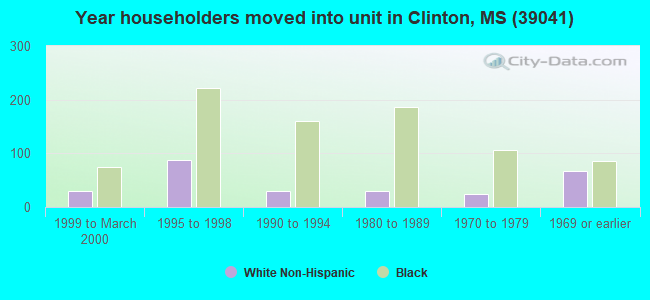
Length of stay since moving in significantly above state average.
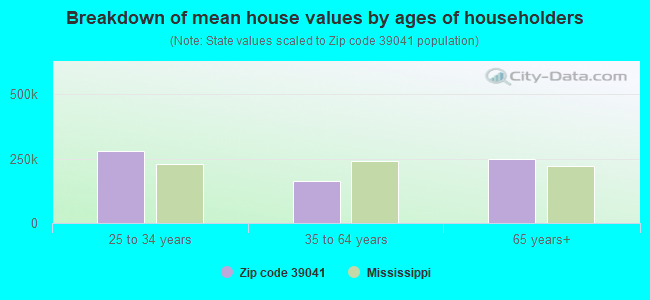
Estimated median house/condo value in 2022: $164,114
39041:
$164,114
Mississippi:
$162,500
According to our research of Mississippi and other state lists, there were 11 registered sex offenders living in 39041 zip code as of April 27, 2024. The ratio of all residents to sex offenders in zip code 39041 is 324 to 1. The ratio of registered sex offenders to all residents in this zip code is near the state average.
Median resident age:
This zip code:
47.1 years
Mississippi median age:
38.9 years
Average household size:
This zip code:
2.5 people
Mississippi:
2.5 people
Averages for the 2020 tax year for zip code 39041, filed in 2021:
Average Adjusted Gross Income (AGI) in 2020: $43,208 (Individual Income Tax Returns)
Here:
$43,208
State:
$54,084
Salary/wage: $36,784 (reported on 82.0% of returns)
Here:
$36,784
State:
$45,187
(% of AGI for various income ranges: 1197.3% for AGIs below $25k, 3512.6% for AGIs $25k-50k, 6970.0% for AGIs $50k-75k, 10170.0% for AGIs $75k-100k, 19354.0% for AGIs $100k-200k)
Taxable interest for individuals: $354 (reported on 14.9% of returns)
This zip code:
$354
Mississippi:
$1,434
(% of AGI for various income ranges: 4.3% for AGIs below $25k, 2.9% for AGIs $25k-50k, 7.1% for AGIs $50k-75k, 20.0% for AGIs $75k-100k, 62.0% for AGIs $100k-200k)
Ordinary dividends: $2,890 (reported on 6.2% of returns)
Here:
$2,890
State:
$6,661
(% of AGI for various income ranges: 8.8% for AGIs $25k-50k, 170.0% for AGIs $75k-100k, 334.0% for AGIs $100k-200k)
Net capital gain/loss in AGI: +$3,725 (reported on 5.0% of returns)
Here:
+$3,725
State:
+$16,833
(% of AGI for various income ranges: 76.4% for AGIs $50k-75k, 406.0% for AGIs $100k-200k)
Profit/loss from business: +$5,357 (reported on 18.6% of returns)
Here:
+$5,357
State:
+$7,724
(% of AGI for various income ranges: 100.8% for AGIs below $25k, 32.9% for AGIs $25k-50k, 190.7% for AGIs $50k-75k, 1376.0% for AGIs $100k-200k)
Taxable individual retirement arrangement distribution: $16,580 (reported on 6.2% of returns)
39041:
$16,580
Mississippi:
$17,717
(% of AGI for various income ranges: 28.4% for AGIs below $25k, 149.3% for AGIs $25k-50k, 1772.0% for AGIs $75k-100k)
Total itemized deductions: $21,638 (reported on 8.1% of returns)
Here:
$21,638
State:
$34,027
(% of AGI for various income ranges: 196.9% for AGIs $25k-50k, 769.3% for AGIs $50k-75k, 1818.0% for AGIs $100k-200k)
Charity contributions: $9,845 (reported on 6.8% of returns)
Here:
$9,845
State:
$14,997
(% of AGI for various income ranges: 61.2% for AGIs $25k-50k, 249.3% for AGIs $50k-75k, 954.0% for AGIs $100k-200k)
Taxes paid: $4,600 (reported on 7.5% of returns)
39041:
$4,600
State:
$6,353
(% of AGI for various income ranges: 24.8% for AGIs $25k-50k, 164.3% for AGIs $50k-75k, 436.0% for AGIs $100k-200k)
Earned income credit: $2,483 (reported on 29.8% of returns)
Here:
$2,483
State:
$2,689
(% of AGI for various income ranges: 153.9% for AGIs below $25k, 96.9% for AGIs $25k-50k)
Percentage of individuals using paid preparers for their 2020 taxes: 91.3%
Here:
91%
State:
94%
(% for various income ranges: 89.4% for AGIs below $25k, 92.3% for AGIs $25k-50k, 95.2% for AGIs $50k-75k, 88.9% for AGIs $75k-100k, 109.1% for AGIs $100k-200k, 0.0% for AGIs over 200k)
Averages for the 2012 tax year for zip code 39041, filed in 2013:
Average Adjusted Gross Income (AGI) in 2012: $36,774 (Individual Income Tax Returns)
Here:
$36,774
State:
$46,197
Salary/wage: $31,579 (reported on 85.4% of returns)
Here:
$31,579
State:
$38,549
(% of AGI for various income ranges: 81.4% for AGIs below $25k, 82.0% for AGIs $25k-50k, 72.7% for AGIs $50k-75k, 74.9% for AGIs $75k-100k, 58.3% for AGIs $100k-200k)
Taxable interest for individuals: $571 (reported on 14.6% of returns)
This zip code:
$571
Mississippi:
$1,482
(% of AGI for various income ranges: 0.4% for AGIs below $25k, 0.2% for AGIs $50k-75k, 0.2% for AGIs $75k-100k, 0.3% for AGIs $100k-200k)
Ordinary dividends: $3,018 (reported on 6.7% of returns)
Here:
$3,018
State:
$5,401
(% of AGI for various income ranges: 0.2% for AGIs below $25k, 0.2% for AGIs $50k-75k, 1.8% for AGIs $100k-200k)
Net capital gain/loss in AGI: +$7,100 (reported on 4.9% of returns)
Here:
+$7,100
State:
+$12,121
(% of AGI for various income ranges: 0.1% for AGIs $50k-75k, 3.5% for AGIs $100k-200k)
Profit/loss from business: +$5,870 (reported on 16.5% of returns)
Here:
+$5,870
State:
+$10,220
(% of AGI for various income ranges: 6.5% for AGIs below $25k, 2.7% for AGIs $25k-50k, 3.2% for AGIs $50k-75k, 0.8% for AGIs $100k-200k)
Taxable individual retirement arrangement distribution: $11,533 (reported on 5.5% of returns)
39041:
$11,533
Mississippi:
$13,665
Total itemized deductions: $19,178 (28% of AGI, reported on 22.6% of returns)
Here:
$19,178
State:
$22,078
Here:
28.0% of AGI
State:
21.8% of AGI
(% of AGI for various income ranges: 6.3% for AGIs below $25k, 11.4% for AGIs $25k-50k, 14.9% for AGIs $50k-75k, 16.6% for AGIs $75k-100k, 12.0% for AGIs $100k-200k)
Charity contributions: $4,831 (reported on 19.5% of returns)
Here:
$4,831
State:
$6,081
(% of AGI for various income ranges: 1.2% for AGIs below $25k, 2.5% for AGIs $25k-50k, 3.6% for AGIs $50k-75k, 2.4% for AGIs $75k-100k, 3.1% for AGIs $100k-200k)
Taxes paid: $3,711 (reported on 22.6% of returns)
39041:
$3,711
State:
$5,794
(% of AGI for various income ranges: 0.6% for AGIs below $25k, 1.6% for AGIs $25k-50k, 2.9% for AGIs $50k-75k, 2.5% for AGIs $75k-100k, 3.7% for AGIs $100k-200k)
Earned income credit: $2,543 (reported on 37.2% of returns)
Here:
$2,543
State:
$2,710
(% of AGI for various income ranges: 11.2% for AGIs below $25k, 1.6% for AGIs $25k-50k)
Percentage of individuals using paid preparers for their 2012 taxes: 56.1%
Here:
56%
State:
60%
(% for various income ranges: 54.2% for AGIs below $25k, 55.3% for AGIs $25k-50k, 53.3% for AGIs $50k-75k, 55.6% for AGIs $75k-100k, 80.0% for AGIs $100k-200k)
Averages for the 2004 tax year for zip code 39041, filed in 2005:
Average Adjusted Gross Income (AGI) in 2004: $29,773 (Individual Income Tax Returns)
Here:
$29,773
State:
$36,110
Salary/wage: $27,259 (reported on 90.9% of returns)
Here:
$27,259
State:
$31,757
(% of AGI for various income ranges: 97.1% for AGIs below $10k, 90.6% for AGIs $10k-25k, 85.2% for AGIs $25k-50k, 83.0% for AGIs $50k-75k, 85.9% for AGIs $75k-100k, 62.5% for AGIs over 100k)
Taxable interest for individuals: $673 (reported on 20.1% of returns)
This zip code:
$673
Mississippi:
$1,649
(% of AGI for various income ranges: 1.2% for AGIs below $10k, 0.3% for AGIs $10k-25k, 0.6% for AGIs $25k-50k, 0.3% for AGIs $50k-75k, 0.5% for AGIs $75k-100k, 0.5% for AGIs over 100k)
Taxable dividends: $962 (reported on 8.1% of returns)
Here:
$962
State:
$3,089
(% of AGI for various income ranges: 0.7% for AGIs below $10k, 0.0% for AGIs $10k-25k, 0.2% for AGIs $25k-50k, 0.1% for AGIs $50k-75k, 0.4% for AGIs $75k-100k, 0.6% for AGIs over 100k)
Net capital gain/loss: +$3,079 (reported on 5.6% of returns)
Here:
+$3,079
State:
+$8,427
(% of AGI for various income ranges: -0.5% for AGIs below $10k, 0.1% for AGIs $25k-50k, -0.1% for AGIs $50k-75k, 0.5% for AGIs $75k-100k, 3.5% for AGIs over 100k)
Profit/loss from business: +$2,662 (reported on 12.2% of returns)
Here:
+$2,662
State:
+$8,818
(% of AGI for various income ranges: 2.0% for AGIs below $10k, 1.4% for AGIs $10k-25k, 1.9% for AGIs $25k-50k, 0.2% for AGIs $50k-75k, 0.4% for AGIs $75k-100k, 0.7% for AGIs over 100k)
IRA payment deduction: $1,467 (reported on 0.9% of returns)
39041:
$1,467
Mississippi:
$3,024
Total itemized deductions: $16,184 (26% of AGI, reported on 20.0% of returns)
Here:
$16,184
State:
$17,896
Here:
26.0% of AGI
State:
22.5% of AGI
(% of AGI for various income ranges: 4.4% for AGIs $10k-25k, 11.6% for AGIs $25k-50k, 15.9% for AGIs $50k-75k, 12.3% for AGIs $75k-100k, 14.3% for AGIs over 100k)
Charity contributions deductions: $4,216 (7% of AGI, reported on 18.2% of returns)
Here:
$4,216
State:
$4,735
Here:
6.6% of AGI
State:
5.7% of AGI
(% of AGI for various income ranges: 0.7% for AGIs $10k-25k, 2.5% for AGIs $25k-50k, 3.9% for AGIs $50k-75k, 3.0% for AGIs $75k-100k, 4.1% for AGIs over 100k)
Total tax: $3,754 (reported on 59.2% of returns)
39041:
$3,754
State:
$5,562
(% of AGI for various income ranges: 2.1% for AGIs below $10k, 2.2% for AGIs $10k-25k, 5.9% for AGIs $25k-50k, 8.6% for AGIs $50k-75k, 10.5% for AGIs $75k-100k, 15.7% for AGIs over 100k)
Earned income credit: $2,130 (reported on 37.7% of returns)
Here:
$2,130
State:
$2,107
Percentage of individuals using paid preparers for their 2004 taxes: 53.1%
Here:
53%
State:
65%
(% for various income ranges: 47.7% for AGIs below $10k, 52.9% for AGIs $10k-25k, 51.5% for AGIs $25k-50k, 58.3% for AGIs $50k-75k, 64.9% for AGIs $75k-100k, 72.9% for AGIs over 100k)
Household received Food Stamps/SNAP in the past 12 months: 148 Household did not receive Food Stamps/SNAP in the past 12 months: 1,278
Women who had a birth in the past 12 months: 23 (23 now married, 0 unmarried) Women who did not have a birth in the past 12 months: 494 (215 now married, 278 unmarried)
Housing units in zip code 39041 with a mortgage: 395 (14 second mortgage, 14 both second mortgage and home equity loan) Median monthly owner costs for units with a mortgage: $1,327 Median monthly owner costs for units without a mortgage: $459
Residents with income below the poverty level in 2022:
This zip code:
12.1%
Whole state:
19.1%
Residents with income below 50% of the poverty level in 2022:
This zip code:
4.9%
Whole state:
10.3%
Median number of rooms in houses and condos:
Here:
5.8
State:
6.3
Median number of rooms in apartments:
Here:
5.1
State:
4.8
Notable locations in this zip code not listed on our city pages
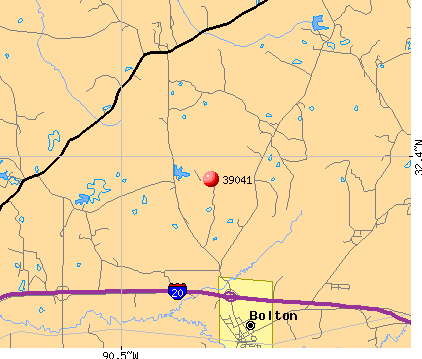
Notable locations in zip code 39041: Coxs Ferry (A), Norrell (B), Brownsville Volunteer Fire Department (C), Bolton Volunteer Fire Department (D). Display/hide their locations on the map
Churches in zip code 39041 include: Orange Hill Church (A), Pleasant Hill Church (B), Rose Hill Church (C), Brownsville Church (D), Tye Walter Church (E), Zion Chapel (F), Gaddis Chapel (G), Good Hope Church (H), Hill of Zion Church (I). Display/hide their locations on the map
Cemeteries: Cox Cemetery (1), Dawson Cemetery (2), Underhill Cemetery (3), Birdsong Cemetery (4), Bolton Cemetery (5). Display/hide their locations on the map
Creeks: Snake Creek (A), Boque Falia Creek (B), Little Bakers Creek (C), Lindsey Creek (D), Fleetwood Creek (E), Cox Creek (F). Display/hide their locations on the map
Size of family households: 418 2-persons, 177 3-persons, 151 4-persons, 34 5-persons, 8 6-persons, 73 7-or-more-persons
Size of nonfamily households: 547 1-person, 18 2-persons
153 married couples with children.
70 single-parent households (5 men, 65 women).
100.0% of residents of 39041 zip code speak English at home.
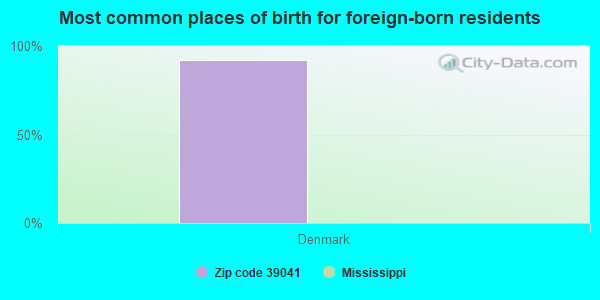
Foreign born population: 25 (0.7%) (0.0% of them are naturalized citizens)
:
0.7%
Whole state:
2.2%
92%Denmark
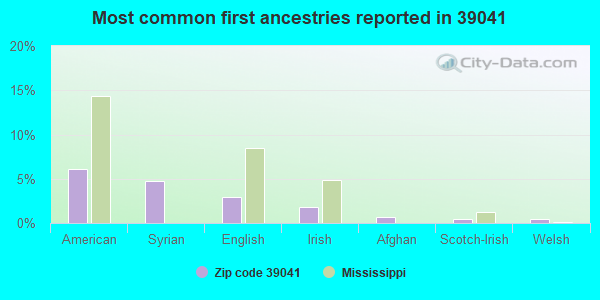
6%American
5%Syrian
3%English
2%Irish
1%Afghan
1%Scotch-Irish
0%Welsh
Year of entry for the foreign-born population
02010 or later
02000 to 2009
261990 to 1999
0Before 1990
Facilities with environmental interests located in this zip code:
DEFOREST WOOD PRESERVING COMPANY INC (1400 INDUSTRIAL DRIVE in BOLTON, MS)
STATE MASTER (Mississippi compliance, permits, activity tracking ) - ENSITE-MSU090010, WASTEWATER FACILITY, ENSITE-MSD985967355, CESQG National Pollutant Discharge Elimination System NON-MAJOR (Tracking pollutant discharge elimination systems) - permit National Pollutant Discharge Elimination System NON-MAJOR (Tracking pollutant discharge elimination systems) - permit Conditionally Exempt Small Quantity Generators, less than 100 kg/month of hazardous waste (Resource Conservation and Recovery Act (tracking hazardous waste)) - notification Business SIC classification: WOOD PRESERVING Organizations: FRANK DEFOREST JAMES III (CONTACT/OWNER)
Alternative names: STONE COUNTY
BOLTON POTW (205 BEN WARREN DRIVE in BOLTON, MS)
STATE MASTER (Mississippi compliance, permits, activity tracking ) - ENSITE-MS0021032, National Pollutant Discharge Elimination System Permit National Pollutant Discharge Elimination System NON-MAJOR (Tracking pollutant discharge elimination systems) - permit Business SIC classification: SEWERAGE SYSTEMS Alternative names: HINDS COUNTY
DENBURY MANAGEMENT INC (FRONTAGE ROAD NORTH INTERSTATE 20 in BOLTON, MS)
AIR MINOR (AIRS/AFS) STATE MASTER (Mississippi compliance, permits, activity tracking ) - ENSITE-04900047, AIR PROGRAM Business SIC classification: CRUDE PETROLEUM AND NATURAL GAS
HAZCLEAN ENVIRONMENTAL CONSULTANTS INC, HINDS COUNTY DISTRICT TWO MAINTENANCE SH (10000 I-20 FRONTAGE ROAD in BOLTON, MS)
STATE MASTER (Mississippi compliance, permits, activity tracking ) - ENSITE-MSG120066, NPDES NON-MAJOR National Pollutant Discharge Elimination System NON-MAJOR (Tracking pollutant discharge elimination systems) - permit Business SIC classification: GASOLINE SERVICE STATIONS
HINDS COUNTY HUMAN RESOURCE AGENCY, SAINT THOMAS HEADSTART (3850 SOUTH NORRELL ROAD in BOLTON, MS)
STATE MASTER (Mississippi compliance, permits, activity tracking ) - ENSITE-MS0042102, National Pollutant Discharge Elimination System Permit National Pollutant Discharge Elimination System NON-MAJOR (Tracking pollutant discharge elimination systems) - permit Business SIC classification: CHILD DAY CARE SERVICES Alternative names: ST THOMAS HEAD START - HINDS, ST THOMAS HEADSTART - HINDS
MOUNT OLIVE WATER ASSOCIATION, WEST VIEW SUBDIVISION (5647 WEST NORTHSIDE DRIVE in BOLTON, MS)
STATE MASTER (Mississippi compliance, permits, activity tracking ) - ENSITE-MS0031453, National Pollutant Discharge Elimination System Permit National Pollutant Discharge Elimination System NON-MAJOR (Tracking pollutant discharge elimination systems) - permit Business SIC classification: LAND SUBDIVIDERS AND DEVELOPERS, EXCEPT CEMETERIES Alternative names: HINDS COUNTY, WEST VIEW SUB DIVISION
BOLTON--EDWARDS ELEMENTARY SCHOOL (9700 I-20 WEST FRONTAGE ROAD in BOLTON, MS)
(National Center for Education Statistics) - STATE ID-2500044 Organizations: HINDS CO SCHOOL DIST (SCHOOL DISTRICT)
AUSTIN PRODUCTION (GADDIS FARMS BOLTON FIELD in BOLTON, MS)
(Integrated Compliance Information System) - ICIS-04-1989-0029, FORMAL ENFORCEMENT ACTION
BOLTON TOWN OF (RAYMOND RD in BOLTON, MS)
(Integrated Compliance Information System) - ICIS-04-1987-0041, FORMAL ENFORCEMENT ACTION Business SIC classification: WATER SUPPLY
ENVIRONMENTAL DREDGING SPECIALISTS, INC. (119 PECAN STREET in BOLTON, MS)
National Pollutant Discharge Elimination System NON-MAJOR (Tracking pollutant discharge elimination systems) - permit Business SIC classification: ELEMENTARY AND SECONDARY SCHOOLS Alternative names: BOLTON EDWARS SCHOOL
HINDS (14000 MISSISSIPPI HIGHWAY 22 in BOLTON, MS)
National Pollutant Discharge Elimination System NON-MAJOR (Tracking pollutant discharge elimination systems) - permit Business SIC classification: RELIGIOUS ORGANIZATIONS
HINDS (SAM HARRING ROAD in BOLTON, MS)
National Pollutant Discharge Elimination System NON-MAJOR (Tracking pollutant discharge elimination systems) - permit Business SIC classification: NATURAL GAS TRANSMISSION Alternative names: CROSSTEX MISSISSIPPI PIPELINE
Housing units lacking complete plumbing facilities: 3.6% Housing units lacking complete kitchen facilities: 3.1%
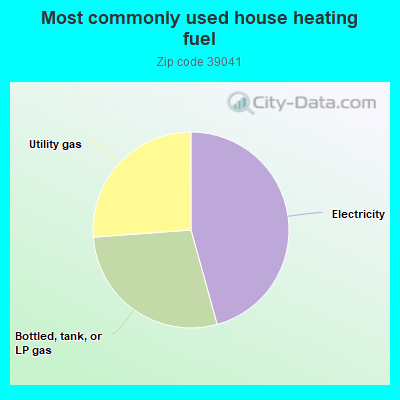
45.8%Electricity
28.2%Bottled, tank, or LP gas
26.2%Utility gas
Population in 1990: 3,484.
Place of birth for U.S.-born residents:
This state: 2,888
Northeast: 29
Midwest: 43
South: 224
West: 316
75% of the 39041 zip code residents lived in the same house 5 years ago. Out of people who lived in different houses, 85% lived in this county. Out of people who lived in different counties, 50% lived in Mississippi.
99% of the 39041 zip code residents lived in the same house 1 year ago. Out of people who lived in different houses, 108% moved from this county.
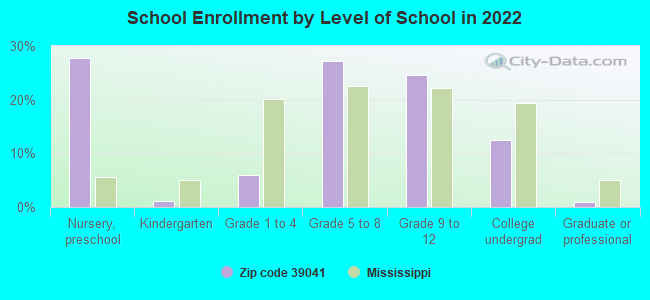
Private vs. public school enrollment:
Students in private schools in grades 1 to 8 (elementary and middle school):
Here:
0.0%
Mississippi:
16.1%
Students in private schools in grades 9 to 12 (high school):
Here:
0.0%
Mississippi:
14.6%
Students in private undergraduate colleges: 18
Here:
20.5%
Mississippi:
12.8%
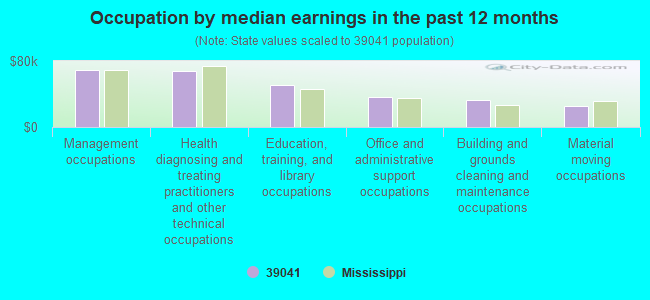
Occupation by median earnings in the past 12 months ($)
69,290Management occupations
68,218Health diagnosing and treating practitioners and other technical occupations
50,549Education, training, and library occupations
36,323Office and administrative support occupations
32,768Building and grounds cleaning and maintenance occupations
26,034Material moving occupations
Companies with federal contracts located in this zip code:
METRO MECHANICAL, INC (1385 INDUSTRIAL DR in BOLTON, MS; small business)
$204,840 with U.S. Army Corps of Engineers - civil program financing only for Construction of Structures and Facilities -- Miscellaneous Buildings. Signed on 2002-02-12. Completion date: 2002-05-31.
Top industries in this zip code by the number of employees in 2005:
Construction: Plumbing, Heating, and Air-Conditioning Contractors (50-99 employees: 1 establishment)
Other Services (except Public Administration): Religious Organizations (5-9: 2, 1-4: 1)
Construction: Masonry Contractors (10-19: 1)
Wholesale Trade: Farm and Garden Machinery and Equipment Merchant Wholesalers (10-19: 1)
Construction: Poured Concrete Foundation and Structure Contractors (5-9: 1)
Fatal accident statistics in 2014:
Fatal accident count: 1
Vehicles involved in fatal accidents: 1
Fatal accidents caused by drunken drivers: 0
Fatalities: 1
Persons involved in fatal accidents: 8
Pedestrians involved in fatal accidents: 0
Fatal accident statistics in 2013:
Fatal accident count: 6
Vehicles involved in fatal accidents: 9
Fatal accidents caused by drunken drivers: 0
Fatalities: 6
Persons involved in fatal accidents: 13
Pedestrians involved in fatal accidents: 1
Home Mortgage Disclosure Act Aggregated Statistics For Year 2009 (Based on 4 partial tracts)
A) FHA, FSA/RHS & VA Home Purchase Loans
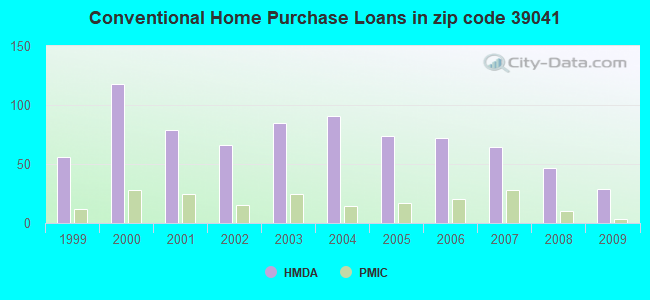
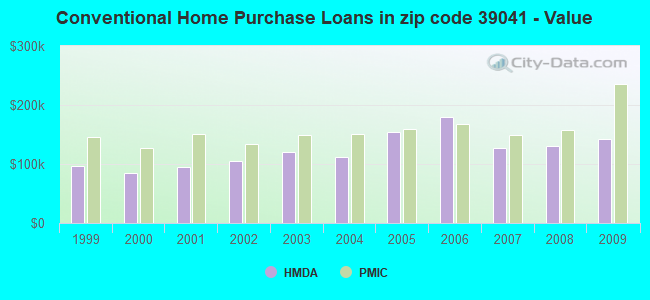
B) Conventional Home Purchase Loans
C) Refinancings
D) Home Improvement Loans
F) Non-occupant Loans on < 5 Family Dwellings (A B C & D)
G) Loans On Manufactured Home Dwelling (A B C & D)
Number
Average Value
Number
Average Value
Number
Average Value
Number
Average Value
Number
Average Value
Number
Average Value
LOANS ORIGINATED
15
$152,385
29
$143,217
115
$165,616
13
$29,268
14
$80,247
14
$59,892
APPLICATIONS APPROVED, NOT ACCEPTED
1
$184,950
4
$203,020
9
$164,801
1
$14,390
0
$0
2
$84,350
APPLICATIONS DENIED
5
$106,584
16
$79,051
45
$174,581
16
$24,511
4
$36,942
13
$57,817
APPLICATIONS WITHDRAWN
0
$0
4
$120,312
22
$147,325
1
$5,090
1
$9,580
1
$15,330
FILES CLOSED FOR INCOMPLETENESS
0
$0
2
$59,260
6
$196,742
1
$12,770
0
$0
2
$65,650
Aggregated Statistics For Year 2008 (Based on 4 partial tracts)
A) FHA, FSA/RHS & VA Home Purchase Loans
B) Conventional Home Purchase Loans
C) Refinancings
D) Home Improvement Loans
F) Non-occupant Loans on < 5 Family Dwellings (A B C & D)
G) Loans On Manufactured Home Dwelling (A B C & D)
Number
Average Value
Number
Average Value
Number
Average Value
Number
Average Value
Number
Average Value
Number
Average Value
LOANS ORIGINATED
9
$121,570
47
$130,071
87
$173,374
25
$30,477
15
$136,317
22
$49,976
APPLICATIONS APPROVED, NOT ACCEPTED
1
$33,020
8
$96,489
15
$136,361
3
$79,297
3
$28,783
8
$41,271
APPLICATIONS DENIED
2
$36,405
20
$84,838
63
$144,640
28
$42,598
2
$118,525
21
$57,515
APPLICATIONS WITHDRAWN
0
$0
2
$109,635
22
$154,645
1
$12,770
3
$138,787
1
$25,540
FILES CLOSED FOR INCOMPLETENESS
1
$286,830
1
$82,120
9
$163,097
2
$116,410
0
$0
1
$42,330
Aggregated Statistics For Year 2007 (Based on 4 partial tracts)
A) FHA, FSA/RHS & VA Home Purchase Loans
B) Conventional Home Purchase Loans
C) Refinancings
D) Home Improvement Loans
E) Loans on Dwellings For 5+ Families
F) Non-occupant Loans on < 5 Family Dwellings (A B C & D)
G) Loans On Manufactured Home Dwelling (A B C & D)
Number
Average Value
Number
Average Value
Number
Average Value
Number
Average Value
Number
Average Value
Number
Average Value
Number
Average Value
LOANS ORIGINATED
10
$117,857
64
$127,887
82
$144,462
26
$31,300
1
$4,138,180
19
$82,797
28
$47,414
APPLICATIONS APPROVED, NOT ACCEPTED
0
$0
18
$78,843
20
$123,276
1
$93,130
0
$0
2
$93,125
10
$52,769
APPLICATIONS DENIED
1
$21,160
36
$78,473
53
$148,472
29
$28,834
0
$0
7
$53,781
20
$48,980
APPLICATIONS WITHDRAWN
0
$0
10
$176,577
23
$134,523
5
$46,268
0
$0
1
$160,850
1
$47,890
FILES CLOSED FOR INCOMPLETENESS
0
$0
3
$169,630
7
$164,921
1
$29,630
0
$0
1
$102,180
0
$0
Aggregated Statistics For Year 2006 (Based on 4 partial tracts)
A) FHA, FSA/RHS & VA Home Purchase Loans
B) Conventional Home Purchase Loans
C) Refinancings
D) Home Improvement Loans
E) Loans on Dwellings For 5+ Families
F) Non-occupant Loans on < 5 Family Dwellings (A B C & D)
G) Loans On Manufactured Home Dwelling (A B C & D)
Number
Average Value
Number
Average Value
Number
Average Value
Number
Average Value
Number
Average Value
Number
Average Value
Number
Average Value
LOANS ORIGINATED
11
$117,342
72
$179,901
115
$115,279
30
$30,021
2
$491,220
16
$88,738
18
$43,444
APPLICATIONS APPROVED, NOT ACCEPTED
2
$91,260
23
$76,248
19
$117,978
2
$64,765
0
$0
6
$63,353
14
$43,096
APPLICATIONS DENIED
3
$99,757
36
$79,030
104
$124,571
33
$20,378
0
$0
9
$55,586
31
$45,626
APPLICATIONS WITHDRAWN
2
$62,225
6
$142,395
27
$113,939
6
$37,718
0
$0
1
$111,750
3
$63,530
FILES CLOSED FOR INCOMPLETENESS
1
$43,420
5
$119,128
18
$142,311
1
$35,560
0
$0
0
$0
0
$0
Aggregated Statistics For Year 2005 (Based on 4 partial tracts)
A) FHA, FSA/RHS & VA Home Purchase Loans
B) Conventional Home Purchase Loans
C) Refinancings
D) Home Improvement Loans
F) Non-occupant Loans on < 5 Family Dwellings (A B C & D)
G) Loans On Manufactured Home Dwelling (A B C & D)
Number
Average Value
Number
Average Value
Number
Average Value
Number
Average Value
Number
Average Value
Number
Average Value
LOANS ORIGINATED
8
$101,478
74
$154,354
132
$123,937
33
$23,638
25
$63,727
21
$50,209
APPLICATIONS APPROVED, NOT ACCEPTED
4
$54,875
21
$82,581
32
$116,155
2
$37,760
3
$143,923
15
$56,141
APPLICATIONS DENIED
2
$60,260
45
$76,164
111
$102,891
35
$26,785
10
$52,490
38
$49,739
APPLICATIONS WITHDRAWN
3
$69,420
20
$111,706
52
$141,909
10
$68,745
1
$28,780
13
$53,876
FILES CLOSED FOR INCOMPLETENESS
0
$0
2
$115,560
24
$133,698
1
$38,100
1
$32,170
2
$56,720
Aggregated Statistics For Year 2004 (Based on 4 partial tracts)
A) FHA, FSA/RHS & VA Home Purchase Loans
B) Conventional Home Purchase Loans
C) Refinancings
D) Home Improvement Loans
E) Loans on Dwellings For 5+ Families
F) Non-occupant Loans on < 5 Family Dwellings (A B C & D)
G) Loans On Manufactured Home Dwelling (A B C & D)
Number
Average Value
Number
Average Value
Number
Average Value
Number
Average Value
Number
Average Value
Number
Average Value
Number
Average Value
LOANS ORIGINATED
6
$89,590
91
$112,319
149
$117,702
28
$31,476
1
$656,960
24
$63,347
32
$41,303
APPLICATIONS APPROVED, NOT ACCEPTED
1
$85,530
21
$86,222
53
$95,703
2
$36,825
0
$0
1
$72,800
9
$29,418
APPLICATIONS DENIED
4
$87,498
43
$69,621
115
$103,571
32
$28,096
1
$33,210
5
$19,932
32
$36,865
APPLICATIONS WITHDRAWN
2
$84,615
9
$87,628
36
$126,378
2
$21,275
0
$0
0
$0
1
$75,270
FILES CLOSED FOR INCOMPLETENESS
1
$121,970
8
$157,779
21
$152,600
0
$0
0
$0
0
$0
1
$98,210
Aggregated Statistics For Year 2003 (Based on 4 partial tracts)
A) FHA, FSA/RHS & VA Home Purchase Loans
B) Conventional Home Purchase Loans
C) Refinancings
D) Home Improvement Loans
E) Loans on Dwellings For 5+ Families
F) Non-occupant Loans on < 5 Family Dwellings (A B C & D)
Number
Average Value
Number
Average Value
Number
Average Value
Number
Average Value
Number
Average Value
Number
Average Value
LOANS ORIGINATED
11
$96,673
85
$119,954
264
$116,391
24
$21,061
1
$373,350
20
$73,751
APPLICATIONS APPROVED, NOT ACCEPTED
0
$0
16
$84,053
53
$110,250
3
$96,383
0
$0
4
$67,950
APPLICATIONS DENIED
2
$118,100
63
$48,556
133
$96,317
22
$15,047
0
$0
8
$40,351
APPLICATIONS WITHDRAWN
1
$80,440
8
$92,534
51
$118,321
1
$37,200
0
$0
1
$126,990
FILES CLOSED FOR INCOMPLETENESS
1
$47,260
2
$48,255
10
$145,196
1
$9,580
0
$0
0
$0
Aggregated Statistics For Year 2002 (Based on 4 partial tracts)
A) FHA, FSA/RHS & VA Home Purchase Loans
B) Conventional Home Purchase Loans
C) Refinancings
D) Home Improvement Loans
E) Loans on Dwellings For 5+ Families
F) Non-occupant Loans on < 5 Family Dwellings (A B C & D)
Number
Average Value
Number
Average Value
Number
Average Value
Number
Average Value
Number
Average Value
Number
Average Value
LOANS ORIGINATED
8
$74,969
66
$105,375
193
$112,523
27
$29,459
0
$0
23
$55,049
APPLICATIONS APPROVED, NOT ACCEPTED
1
$54,920
13
$73,014
34
$104,204
4
$30,488
0
$0
1
$63,710
APPLICATIONS DENIED
1
$96,300
37
$68,711
112
$74,306
31
$16,918
1
$96,510
12
$49,645
APPLICATIONS WITHDRAWN
1
$50,450
4
$70,002
52
$80,502
1
$80,430
0
$0
0
$0
FILES CLOSED FOR INCOMPLETENESS
0
$0
3
$56,197
6
$70,318
1
$12,700
0
$0
0
$0
Aggregated Statistics For Year 2001 (Based on 4 partial tracts)
A) FHA, FSA/RHS & VA Home Purchase Loans
B) Conventional Home Purchase Loans
C) Refinancings
D) Home Improvement Loans
F) Non-occupant Loans on < 5 Family Dwellings (A B C & D)
Number
Average Value
Number
Average Value
Number
Average Value
Number
Average Value
Number
Average Value
LOANS ORIGINATED
11
$85,545
79
$95,396
159
$119,668
36
$19,766
14
$78,329
APPLICATIONS APPROVED, NOT ACCEPTED
0
$0
20
$37,778
25
$68,349
3
$19,730
2
$53,915
APPLICATIONS DENIED
1
$54,180
76
$43,728
130
$67,785
39
$17,125
4
$45,505
APPLICATIONS WITHDRAWN
0
$0
4
$67,835
75
$88,461
7
$22,791
3
$85,507
FILES CLOSED FOR INCOMPLETENESS
0
$0
2
$137,045
15
$70,905
1
$5,080
2
$32,170
Aggregated Statistics For Year 2000 (Based on 4 partial tracts)
A) FHA, FSA/RHS & VA Home Purchase Loans
B) Conventional Home Purchase Loans
C) Refinancings
D) Home Improvement Loans
F) Non-occupant Loans on < 5 Family Dwellings (A B C & D)
Number
Average Value
Number
Average Value
Number
Average Value
Number
Average Value
Number
Average Value
LOANS ORIGINATED
16
$89,661
118
$85,346
67
$81,014
44
$15,131
17
$40,567
APPLICATIONS APPROVED, NOT ACCEPTED
2
$27,940
35
$52,658
33
$60,224
11
$22,220
1
$25,400
APPLICATIONS DENIED
4
$59,545
133
$42,981
101
$56,342
44
$15,469
11
$32,776
APPLICATIONS WITHDRAWN
1
$109,210
11
$53,585
58
$72,397
3
$24,113
2
$51,940
FILES CLOSED FOR INCOMPLETENESS
0
$0
5
$80,232
15
$92,663
1
$26,240
2
$21,165
Aggregated Statistics For Year 1999 (Based on 2 partial tracts)
A) FHA, FSA/RHS & VA Home Purchase Loans
B) Conventional Home Purchase Loans
C) Refinancings
D) Home Improvement Loans
F) Non-occupant Loans on < 5 Family Dwellings (A B C & D)
Detailed PMIC statistics for the following Tracts:0105.00
, 0106.00
2002 - 2018 National Fire Incident Reporting System (NFIRS) incidents
Based on the data from the years 2002 - 2018 the average number of fires per year is 59. The highest number of fire incidents - 104 took place in 2006, and the least - 18 in 2002. The data has a growing trend.
When looking into fire subcategories, the most incidents belonged to: Outside Fires (46.9%), and Structure Fires (30.3%).
Fire incident types reported to NFIRS in Zip Code 39041


 Nearest zip codes: 39056, 39066, 39209, 39154, 39071, 39213.


 Based on the data from the years 2002 - 2018 the average number of fires per year is 59. The highest number of fire incidents - 104 took place in 2006, and the least - 18 in 2002. The data has a growing trend.
 When looking into fire subcategories, the most incidents belonged to: Outside Fires (46.9%), and Structure Fires (30.3%).