Estimated zip code population in 2022: 4,620 Zip code population in 2010: 4,799 Zip code population in 2000: 4,512
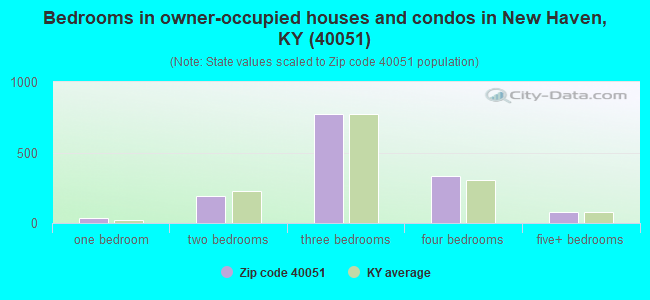
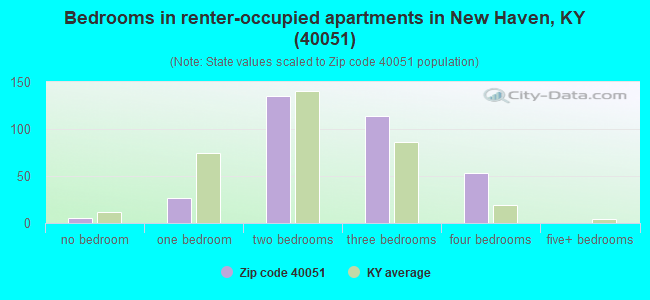
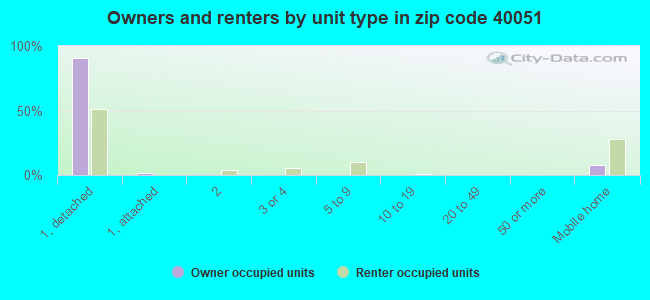
Houses and condos: 2,131 Renter-occupied apartments: 341
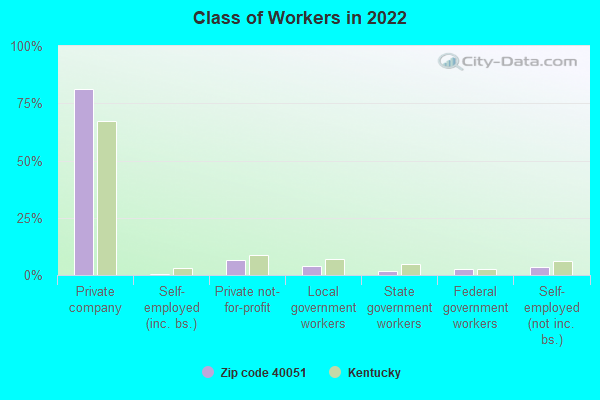
% of renters here:
20%
State:
31%
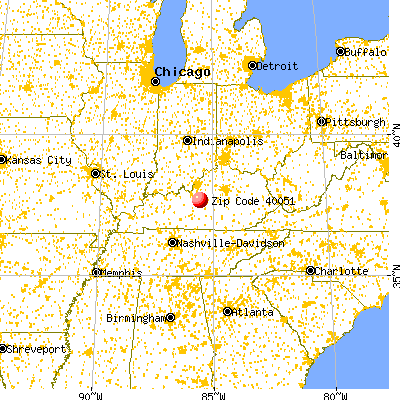
March 2022 cost of living index in zip code 40051: 81.7 (low, U.S. average is 100)
Land area: 94.8 sq. mi. Water area: 1.4 sq. mi.
Population density: 49 people per square mile
(very low).
OSM Map
General Map
Google Map
MSN Map
OSM Map
General Map
Google Map
MSN Map
OSM Map
General Map
Google Map
MSN Map
OSM Map
General Map
Google Map
MSN Map
Please wait while loading the map...
Real estate property taxes paid for housing units in 2022:
This zip code:
0.8% ($1,427)
Kentucky:
0.7% ($1,456)
Median real estate property taxes paid for housing units with mortgages in 2022: $1,453 (0.7%) Median real estate property taxes paid for housing units with no mortgage in 2022: $1,287 (0.7%)
Business Search- 14 Million verified businesses
Males: 2,356
(51.0%)
Females: 2,264
(49.0%)
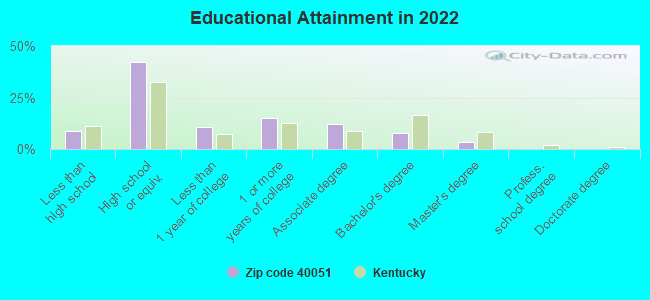
For population 25 years and over in 40051:
High school or higher: 90.1%
Bachelor's degree or higher: 11.1%
Graduate or professional degree: 3.5%
Unemployed: 2.9%
Mean travel time to work (commute): 31.6 minutes
For population 15 years and over in 40051:
Never married: 19.8%
Now married: 55.9%
Separated: 3.3%
Widowed: 5.2%
Divorced: 15.8%
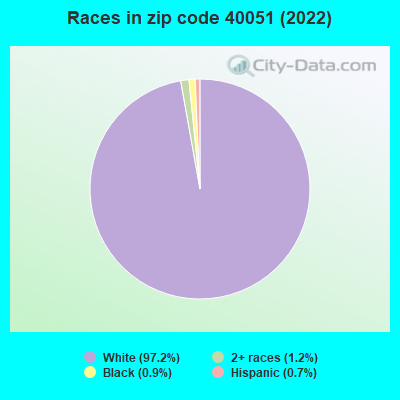
Zip code 40051 compared to state average:
Black race population percentage significantly below state average.
Hispanic race population percentage significantly below state average.
Foreign-born population percentage significantly below state average.
Renting percentage below state average.
Percentage of population with a bachelor's degree or higher significantly below state average.
Estimated median house/condo value in 2022: $186,762
40051:
$186,762
Kentucky:
$196,300
According to our research of Kentucky and other state lists, there were 8 registered sex offenders living in 40051 zip code as of April 26, 2024. The ratio of all residents to sex offenders in zip code 40051 is 539 to 1. The ratio of registered sex offenders to all residents in this zip code is lower than the state average.
Median resident age:
This zip code:
35.9 years
Kentucky median age:
39.4 years
Average household size:
This zip code:
2.6 people
Kentucky:
2.4 people
Averages for the 2020 tax year for zip code 40051, filed in 2021:
Average Adjusted Gross Income (AGI) in 2020: $51,754 (Individual Income Tax Returns)
Here:
$51,754
State:
$61,342
Salary/wage: $46,324 (reported on 81.7% of returns)
Here:
$46,324
State:
$50,827
(% of AGI for various income ranges: 1242.6% for AGIs below $25k, 3830.0% for AGIs $25k-50k, 6464.6% for AGIs $50k-75k, 10035.4% for AGIs $75k-100k, 16190.0% for AGIs $100k-200k)
Taxable interest for individuals: $1,173 (reported on 24.4% of returns)
This zip code:
$1,173
Kentucky:
$1,441
(% of AGI for various income ranges: 22.6% for AGIs below $25k, 27.8% for AGIs $25k-50k, 36.2% for AGIs $50k-75k, 64.6% for AGIs $75k-100k, 64.0% for AGIs $100k-200k)
Ordinary dividends: $4,304 (reported on 13.1% of returns)
Here:
$4,304
State:
$7,388
(% of AGI for various income ranges: 128.9% for AGIs below $25k, 25.8% for AGIs $25k-50k, 54.2% for AGIs $50k-75k, 56.9% for AGIs $75k-100k, 186.0% for AGIs $100k-200k)
Net capital gain/loss in AGI: +$9,261 (reported on 10.8% of returns)
Here:
+$9,261
State:
+$19,475
(% of AGI for various income ranges: 6.6% for AGIs below $25k, 22.9% for AGIs $25k-50k, 50.0% for AGIs $50k-75k, 76.9% for AGIs $75k-100k, 1184.0% for AGIs $100k-200k)
Profit/loss from business: +$6,744 (reported on 11.7% of returns)
Here:
+$6,744
State:
+$11,386
(% of AGI for various income ranges: 140.2% for AGIs below $25k, 68.4% for AGIs $25k-50k, 19.6% for AGIs $50k-75k, 70.0% for AGIs $75k-100k, 387.3% for AGIs $100k-200k)
Taxable individual retirement arrangement distribution: $14,362 (reported on 7.5% of returns)
40051:
$14,362
Kentucky:
$18,941
(% of AGI for various income ranges: 50.0% for AGIs below $25k, 70.7% for AGIs $25k-50k, 195.8% for AGIs $50k-75k, 283.1% for AGIs $75k-100k, 604.7% for AGIs $100k-200k)
Total itemized deductions: $26,300 (reported on 2.8% of returns)
Here:
$26,300
State:
$32,473
(% of AGI for various income ranges: 177.6% for AGIs $25k-50k, 519.3% for AGIs $100k-200k)
Charity contributions: $5,700 (reported on 1.9% of returns)
Here:
$5,700
State:
$13,472
(% of AGI for various income ranges: 95.0% for AGIs $50k-75k)
Taxes paid: $5,217 (reported on 2.8% of returns)
40051:
$5,217
State:
$7,830
(% of AGI for various income ranges: 29.6% for AGIs $25k-50k, 120.0% for AGIs $100k-200k)
Earned income credit: $2,000 (reported on 18.8% of returns)
Here:
$2,000
State:
$2,336
(% of AGI for various income ranges: 107.4% for AGIs below $25k, 65.6% for AGIs $25k-50k)
Percentage of individuals using paid preparers for their 2020 taxes: 96.2%
Here:
96%
State:
94%
(% for various income ranges: 94.7% for AGIs below $25k, 98.3% for AGIs $25k-50k, 96.9% for AGIs $50k-75k, 94.7% for AGIs $75k-100k, 95.8% for AGIs $100k-200k, 100.0% for AGIs over 200k)
Averages for the 2012 tax year for zip code 40051, filed in 2013:
Average Adjusted Gross Income (AGI) in 2012: $39,403 (Individual Income Tax Returns)
Here:
$39,403
State:
$50,814
Salary/wage: $35,705 (reported on 85.4% of returns)
Here:
$35,705
State:
$42,723
(% of AGI for various income ranges: 67.9% for AGIs below $25k, 84.0% for AGIs $25k-50k, 82.1% for AGIs $50k-75k, 84.8% for AGIs $75k-100k, 63.2% for AGIs $100k-200k)
Taxable interest for individuals: $1,122 (reported on 26.8% of returns)
This zip code:
$1,122
Kentucky:
$1,381
(% of AGI for various income ranges: 1.5% for AGIs below $25k, 0.7% for AGIs $25k-50k, 1.0% for AGIs $50k-75k, 0.5% for AGIs $75k-100k, 0.3% for AGIs $100k-200k)
Ordinary dividends: $4,952 (reported on 13.2% of returns)
Here:
$4,952
State:
$6,239
(% of AGI for various income ranges: 7.6% for AGIs below $25k, 0.6% for AGIs $25k-50k, 0.9% for AGIs $50k-75k, 0.7% for AGIs $75k-100k, 0.6% for AGIs $100k-200k)
Net capital gain/loss in AGI: +$3,848 (reported on 11.2% of returns)
Here:
+$3,848
State:
+$11,336
(% of AGI for various income ranges: 1.0% for AGIs $50k-75k, 0.2% for AGIs $75k-100k, 4.2% for AGIs $100k-200k)
Profit/loss from business: +$6,476 (reported on 12.2% of returns)
Here:
+$6,476
State:
+$10,862
(% of AGI for various income ranges: 6.6% for AGIs below $25k, 1.7% for AGIs $25k-50k, 0.8% for AGIs $50k-75k, 1.0% for AGIs $75k-100k, 1.6% for AGIs $100k-200k)
Taxable individual retirement arrangement distribution: $9,814 (reported on 6.8% of returns)
40051:
$9,814
Kentucky:
$14,296
(% of AGI for various income ranges: 1.7% for AGIs below $25k, 1.5% for AGIs $25k-50k, 2.1% for AGIs $50k-75k, 3.3% for AGIs $75k-100k)
Total itemized deductions: $15,122 (22% of AGI, reported on 22.4% of returns)
Here:
$15,122
State:
$21,160
Here:
22.3% of AGI
State:
20.0% of AGI
(% of AGI for various income ranges: 8.3% for AGIs below $25k, 5.8% for AGIs $25k-50k, 8.6% for AGIs $50k-75k, 10.2% for AGIs $75k-100k, 11.0% for AGIs $100k-200k)
Charity contributions: $3,173 (reported on 18.0% of returns)
Here:
$3,173
State:
$4,303
(% of AGI for various income ranges: 3.7% for AGIs below $25k, 0.6% for AGIs $25k-50k, 0.9% for AGIs $50k-75k, 1.3% for AGIs $75k-100k, 1.8% for AGIs $100k-200k)
Taxes paid: $5,170 (reported on 22.4% of returns)
40051:
$5,170
State:
$8,496
(% of AGI for various income ranges: 1.2% for AGIs below $25k, 1.6% for AGIs $25k-50k, 2.9% for AGIs $50k-75k, 4.1% for AGIs $75k-100k, 4.9% for AGIs $100k-200k)
Earned income credit: $2,115 (reported on 23.4% of returns)
Here:
$2,115
State:
$2,273
(% of AGI for various income ranges: 6.7% for AGIs below $25k, 1.3% for AGIs $25k-50k)
Percentage of individuals using paid preparers for their 2012 taxes: 75.6%
Here:
76%
State:
60%
(% for various income ranges: 74.7% for AGIs below $25k, 71.4% for AGIs $25k-50k, 78.1% for AGIs $50k-75k, 81.2% for AGIs $75k-100k, 90.0% for AGIs $100k-200k)
Averages for the 2004 tax year for zip code 40051, filed in 2005:
Average Adjusted Gross Income (AGI) in 2004: $32,737 (Individual Income Tax Returns)
Here:
$32,737
State:
$41,540
Salary/wage: $30,848 (reported on 85.6% of returns)
Here:
$30,848
State:
$36,432
(% of AGI for various income ranges: 110.4% for AGIs below $10k, 74.2% for AGIs $10k-25k, 84.1% for AGIs $25k-50k, 90.2% for AGIs $50k-75k, 84.9% for AGIs $75k-100k, 53.9% for AGIs over 100k)
Taxable interest for individuals: $1,242 (reported on 41.4% of returns)
This zip code:
$1,242
Kentucky:
$1,571
(% of AGI for various income ranges: 7.7% for AGIs below $10k, 2.3% for AGIs $10k-25k, 1.1% for AGIs $25k-50k, 1.3% for AGIs $50k-75k, 0.6% for AGIs $75k-100k, 2.1% for AGIs over 100k)
Taxable dividends: $3,081 (reported on 15.8% of returns)
Here:
$3,081
State:
$3,453
(% of AGI for various income ranges: 3.6% for AGIs below $10k, 7.7% for AGIs $10k-25k, 0.3% for AGIs $25k-50k, 0.4% for AGIs $50k-75k, 0.1% for AGIs $75k-100k, 0.3% for AGIs over 100k)
Net capital gain/loss: +$3,570 (reported on 10.9% of returns)
Here:
+$3,570
State:
+$9,663
(% of AGI for various income ranges: -1.2% for AGIs below $10k, -0.0% for AGIs $10k-25k, 0.6% for AGIs $25k-50k, 0.1% for AGIs $50k-75k, 0.9% for AGIs $75k-100k, 6.5% for AGIs over 100k)
Profit/loss from business: +$7,841 (reported on 15.1% of returns)
Here:
+$7,841
State:
+$9,233
(% of AGI for various income ranges: 11.3% for AGIs below $10k, 6.1% for AGIs $10k-25k, 1.8% for AGIs $25k-50k, 1.6% for AGIs $50k-75k, 10.5% for AGIs over 100k)
IRA payment deduction: $2,500 (reported on 2.1% of returns)
40051:
$2,500
Kentucky:
$2,955
Total itemized deductions: $13,366 (20% of AGI, reported on 19.4% of returns)
Here:
$13,366
State:
$17,474
Here:
20.4% of AGI
State:
21.0% of AGI
(% of AGI for various income ranges: 5.8% for AGIs below $10k, 4.1% for AGIs $10k-25k, 6.2% for AGIs $25k-50k, 10.2% for AGIs $50k-75k, 9.2% for AGIs $75k-100k, 11.0% for AGIs over 100k)
Charity contributions deductions: $1,830 (3% of AGI, reported on 16.2% of returns)
Here:
$1,830
State:
$3,494
Here:
2.6% of AGI
State:
4.0% of AGI
(% of AGI for various income ranges: 0.6% for AGIs $10k-25k, 0.6% for AGIs $25k-50k, 1.1% for AGIs $50k-75k, 1.0% for AGIs $75k-100k, 1.5% for AGIs over 100k)
Total tax: $3,755 (reported on 74.5% of returns)
40051:
$3,755
State:
$6,162
(% of AGI for various income ranges: 3.9% for AGIs below $10k, 4.3% for AGIs $10k-25k, 6.2% for AGIs $25k-50k, 8.1% for AGIs $50k-75k, 9.9% for AGIs $75k-100k, 18.6% for AGIs over 100k)
Earned income credit: $1,640 (reported on 20.2% of returns)
Here:
$1,640
State:
$1,723
Percentage of individuals using paid preparers for their 2004 taxes: 78.0%
Here:
78%
State:
66%
(% for various income ranges: 69.9% for AGIs below $10k, 80.4% for AGIs $10k-25k, 78.9% for AGIs $25k-50k, 80.0% for AGIs $50k-75k, 80.2% for AGIs $75k-100k, 88.7% for AGIs over 100k)
Household received Food Stamps/SNAP in the past 12 months: 230 Household did not receive Food Stamps/SNAP in the past 12 months: 1,511
Women who had a birth in the past 12 months: 29 (25 now married, 3 unmarried) Women who did not have a birth in the past 12 months: 1,046 (515 now married, 532 unmarried)
Housing units in zip code 40051 with a mortgage: 853 (33 second mortgage, 24 both second mortgage and home equity loan) Median monthly owner costs for units with a mortgage: $1,119 Median monthly owner costs for units without a mortgage: $405
Residents with income below the poverty level in 2022:
This zip code:
13.7%
Whole state:
16.5%
Residents with income below 50% of the poverty level in 2022:
This zip code:
9.7%
Whole state:
9.0%
Median number of rooms in houses and condos:
Here:
5.9
State:
6.4
Median number of rooms in apartments:
Here:
5.0
State:
4.4
Notable locations in this zip code not listed on our city pages
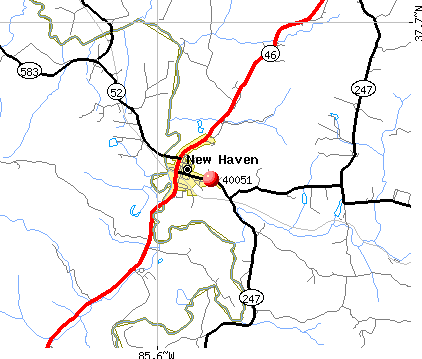
Notable locations in zip code 40051: New Haven Fire Department (A), Rolling Fork Fire Department (B), New Hope Fire Department (C), Rolling Fork Fire Department Substation (D), New Hope Fire Department Station 2 Melody Lake Park (E). Display/hide their locations on the map
Churches in zip code 40051 include: Abbey of Our Lady of Gethsemani (A), Rolling Fork Church (B), Beech Grove Church (C). Display/hide their locations on the map
Cemeteries: Marshall Cemetery (1), Pottinger Cemetery (2), Vernon Cemetery (3), Edlin Cemetery (4), Saint Ann Cemetery (5), Greenwell Cemetery (6). Display/hide their locations on the map
Streams, rivers, and creeks: Davis Run (A), Crady Creek (B), Trace Creek (C), Cane Run (D), Stony Run (E), Lunar Creek (F), Murphy Creek (G), Landing Run (H), Knob Creek (I). Display/hide their locations on the map
In group quarters: 48 (-1 institutionalized population)
Size of family households: 595 2-persons, 216 3-persons, 188 4-persons, 277 5-persons, 2 6-persons, 8 7-or-more-persons
Size of nonfamily households: 322 1-person, 103 2-persons, 18 3-persons
871 married couples with children.
138 single-parent households (44 men, 94 women).
99.1% of residents of 40051 zip code speak English at home.
0.4% of residents speak Spanish at home (100% very well).
0.2% of residents speak other Indo-European language at home (100% very well).
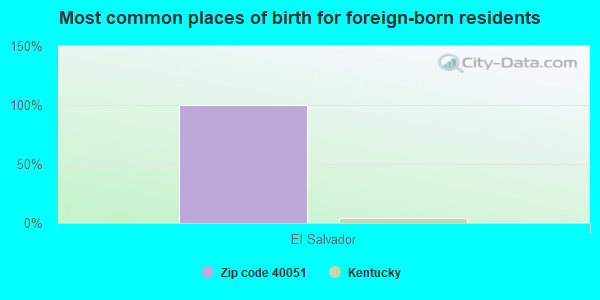
Foreign born population: 5 (0.1%) (0.0% of them are naturalized citizens)
:
0.1%
Whole state:
4.0%
100%El Salvador
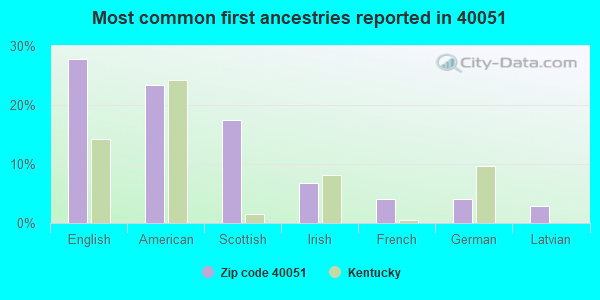
28%English
23%American
18%Scottish
7%Irish
4%French
4%German
3%Latvian
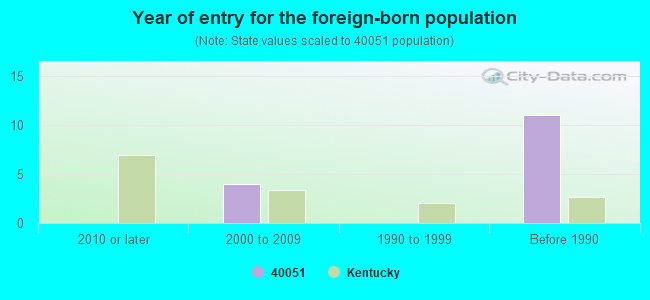
Year of entry for the foreign-born population
02010 or later
42000 to 2009
01990 to 1999
11Before 1990
Facilities with environmental interests located in this zip code:
ABBEY OF GETHSEMANI (3642 MONKS ROAD in TRAPPIST, KY)
National Pollutant Discharge Elimination System NON-MAJOR (Tracking pollutant discharge elimination systems) - permit Conditionally Exempt Small Quantity Generators, less than 100 kg/month of hazardous waste (Resource Conservation and Recovery Act (tracking hazardous waste)) - notification (Resource Conservation and Recovery Act (tracking hazardous waste)) Business SIC classification: RELIGIOUS ORGANIZATIONS Organizations: TRAPPIST MONKS (CONTACT/OWNER)
, GETHSEMANI FARMS INC (CONTACT/OWNER)
Alternative names: GETHSEMANI FARMS INC
NEW HAVEN ELEMENTARY SCHOOL (498 HIGH STREET in NEW HAVEN, KY)
(Resource Conservation and Recovery Act (tracking hazardous waste)) Organizations: NELSON COUNTY BOARD OF EDUCATION (CONTACT/OWNER)
NEW HAVEN STP (N US HWY 31E in NEW HAVEN, KY)
National Pollutant Discharge Elimination System NON-MAJOR (Tracking pollutant discharge elimination systems) - permit Business SIC classification: SEWERAGE SYSTEMS
Housing units lacking complete plumbing facilities: 6.8% Housing units lacking complete kitchen facilities: 4.0%
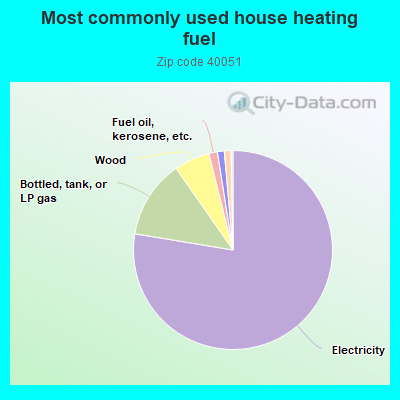
77.7%Electricity
12.7%Bottled, tank, or LP gas
5.8%Wood
1.4%Fuel oil, kerosene, etc.
1.1%Utility gas
1.1%Coal or coke
Population in 1990: 3,698. Population change in the 1990s: +814 (+22.0%).
Place of birth for U.S.-born residents:
This state: 3,574
Northeast: 89
Midwest: 435
South: 453
West: 28
72% of the 40051 zip code residents lived in the same house 5 years ago. Out of people who lived in different houses, 70% lived in this county. Out of people who lived in different counties, 50% lived in Kentucky.
88% of the 40051 zip code residents lived in the same house 1 year ago. Out of people who lived in different houses, 79% moved from this county. Out of people who lived in different houses, 5% moved from different county within same state. Out of people who lived in different houses, 4% moved from different state. Out of people who lived in different houses, 8% moved from abroad.
Private vs. public school enrollment:
Students in private schools in grades 1 to 8 (elementary and middle school): 90
Here:
18.0%
Kentucky:
17.2%
Students in private schools in grades 9 to 12 (high school):
Here:
0.0%
Kentucky:
15.2%
Students in private undergraduate colleges: 1
Here:
2.4%
Kentucky:
19.6%
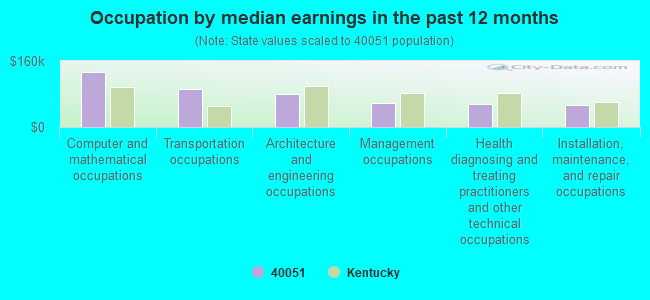
Occupation by median earnings in the past 12 months ($)
133,943Computer and mathematical occupations
92,272Transportation occupations
79,865Architecture and engineering occupations
57,115Management occupations
56,142Health diagnosing and treating practitioners and other technical occupations
53,803Installation, maintenance, and repair occupations
Top industries in this zip code by the number of employees in 2005:
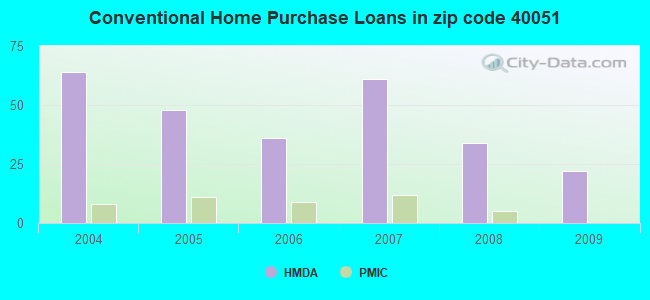
Detailed PMIC statistics for the following Tracts:9907.00
2002 - 2018 National Fire Incident Reporting System (NFIRS) incidents
Based on the data from the years 2002 - 2018 the average number of fire incidents per year is 21. The highest number of reported fire incidents - 33 took place in 2017, and the least - 13 in 2003. The data has a declining trend.
When looking into fire subcategories, the most incidents belonged to: Outside Fires (37.5%), and Structure Fires (27.4%).
Fire incident types reported to NFIRS in Zip Code 40051


 Nearest zip codes: 40107, 40052, 40062, 40037, 40004, 40049.
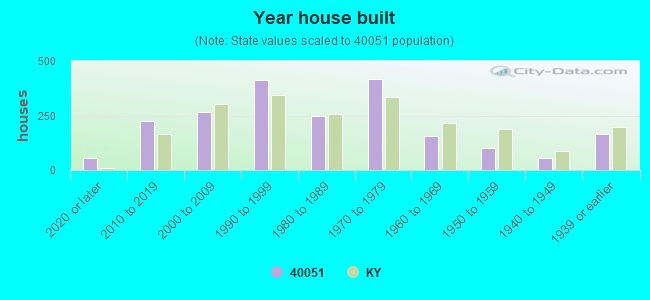


 Based on the data from the years 2002 - 2018 the average number of fire incidents per year is 21. The highest number of reported fire incidents - 33 took place in 2017, and the least - 13 in 2003. The data has a declining trend.
 When looking into fire subcategories, the most incidents belonged to: Outside Fires (37.5%), and Structure Fires (27.4%).