Estimated zip code population in 2022: 38,153 Zip code population in 2010: 32,726 Zip code population in 2000: 26,827
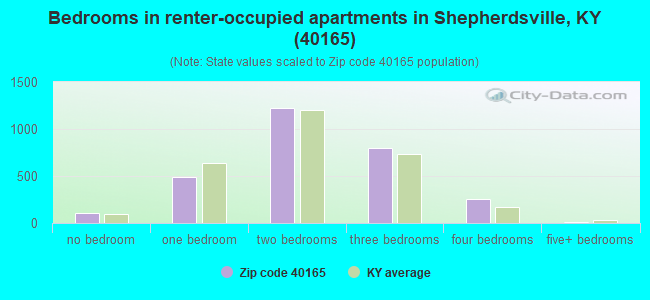
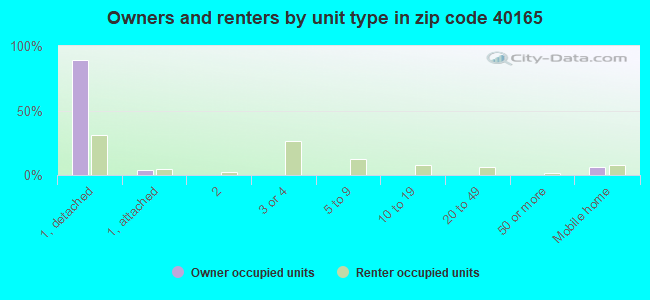
Houses and condos: 15,609 Renter-occupied apartments: 2,898
% of renters here:
20%
State:
31%
March 2022 cost of living index in zip code 40165: 87.7 (less than average, U.S. average is 100)
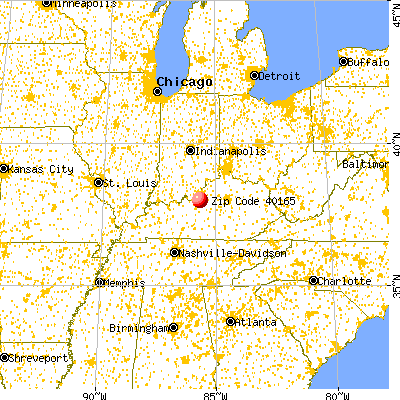
Land area: 144.4 sq. mi. Water area: 1.7 sq. mi.
Population density: 264 people per square mile
(very low).
OSM Map
General Map
Google Map
MSN Map
OSM Map
General Map
Google Map
MSN Map
OSM Map
General Map
Google Map
MSN Map
OSM Map
General Map
Google Map
MSN Map
Please wait while loading the map...
Real estate property taxes paid for housing units in 2022:
This zip code:
0.8% ($1,928)
Kentucky:
0.7% ($1,456)
Median real estate property taxes paid for housing units with mortgages in 2022: $2,031 (0.8%) Median real estate property taxes paid for housing units with no mortgage in 2022: $1,690 (0.8%)
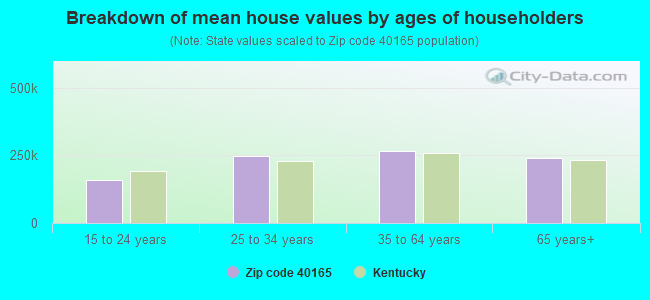
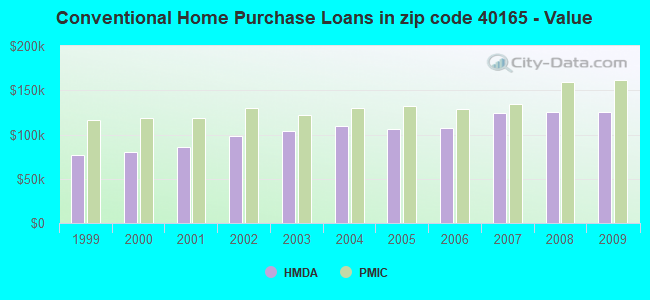
Estimated median house/condo value in 2022: $247,870
40165:
$247,870
Kentucky:
$196,300
According to our research of Kentucky and other state lists, there were 70 registered sex offenders living in 40165 zip code as of April 27, 2024. The ratio of all residents to sex offenders in zip code 40165 is 500 to 1. The ratio of registered sex offenders to all residents in this zip code is near the state average.
Median resident age:
This zip code:
42.4 years
Kentucky median age:
39.4 years
Average household size:
This zip code:
2.6 people
Kentucky:
2.4 people
Averages for the 2020 tax year for zip code 40165, filed in 2021:
Average Adjusted Gross Income (AGI) in 2020: $60,321 (Individual Income Tax Returns)
Here:
$60,321
State:
$61,342
Salary/wage: $52,301 (reported on 85.5% of returns)
Here:
$52,301
State:
$50,827
(% of AGI for various income ranges: 1157.5% for AGIs below $25k, 3408.5% for AGIs $25k-50k, 6270.1% for AGIs $50k-75k, 9235.7% for AGIs $75k-100k, 17047.7% for AGIs $100k-200k, 52770.8% for AGIs over 200k)
Taxable interest for individuals: $1,235 (reported on 22.9% of returns)
This zip code:
$1,235
Kentucky:
$1,441
(% of AGI for various income ranges: 10.8% for AGIs below $25k, 16.6% for AGIs $25k-50k, 34.8% for AGIs $50k-75k, 40.6% for AGIs $75k-100k, 71.6% for AGIs $100k-200k, 1104.6% for AGIs over 200k)
Ordinary dividends: $2,936 (reported on 11.9% of returns)
Here:
$2,936
State:
$7,388
(% of AGI for various income ranges: 10.6% for AGIs below $25k, 16.0% for AGIs $25k-50k, 22.2% for AGIs $50k-75k, 55.4% for AGIs $75k-100k, 124.5% for AGIs $100k-200k, 1393.8% for AGIs over 200k)
Net capital gain/loss in AGI: +$11,691 (reported on 9.9% of returns)
Here:
+$11,691
State:
+$19,475
(% of AGI for various income ranges: 0.9% for AGIs below $25k, 15.9% for AGIs $25k-50k, 55.7% for AGIs $50k-75k, 82.8% for AGIs $75k-100k, 349.6% for AGIs $100k-200k, 8891.5% for AGIs over 200k)
Profit/loss from business: +$12,155 (reported on 11.3% of returns)
Here:
+$12,155
State:
+$11,386
(% of AGI for various income ranges: 63.9% for AGIs below $25k, 81.6% for AGIs $25k-50k, 149.3% for AGIs $50k-75k, 229.6% for AGIs $75k-100k, 315.3% for AGIs $100k-200k, 5325.4% for AGIs over 200k)
Taxable individual retirement arrangement distribution: $16,683 (reported on 7.8% of returns)
40165:
$16,683
Kentucky:
$18,941
(% of AGI for various income ranges: 47.8% for AGIs below $25k, 79.7% for AGIs $25k-50k, 174.6% for AGIs $50k-75k, 230.6% for AGIs $75k-100k, 464.5% for AGIs $100k-200k, 2538.5% for AGIs over 200k)
Total itemized deductions: $26,742 (reported on 5.2% of returns)
Here:
$26,742
State:
$32,473
(% of AGI for various income ranges: 29.7% for AGIs below $25k, 44.1% for AGIs $25k-50k, 194.5% for AGIs $50k-75k, 241.8% for AGIs $75k-100k, 546.9% for AGIs $100k-200k, 3994.6% for AGIs over 200k)
Charity contributions: $8,194 (reported on 4.1% of returns)
Here:
$8,194
State:
$13,472
(% of AGI for various income ranges: 1.7% for AGIs below $25k, 5.3% for AGIs $25k-50k, 25.0% for AGIs $50k-75k, 32.1% for AGIs $75k-100k, 144.7% for AGIs $100k-200k, 1730.8% for AGIs over 200k)
Taxes paid: $7,563 (reported on 5.2% of returns)
40165:
$7,563
State:
$7,830
(% of AGI for various income ranges: 3.9% for AGIs below $25k, 10.3% for AGIs $25k-50k, 49.1% for AGIs $50k-75k, 88.2% for AGIs $75k-100k, 175.5% for AGIs $100k-200k, 946.9% for AGIs over 200k)
Earned income credit: $2,153 (reported on 15.0% of returns)
Here:
$2,153
State:
$2,336
(% of AGI for various income ranges: 82.7% for AGIs below $25k, 59.9% for AGIs $25k-50k, 1.1% for AGIs $50k-75k)
Percentage of individuals using paid preparers for their 2020 taxes: 94.6%
Here:
95%
State:
94%
(% for various income ranges: 93.7% for AGIs below $25k, 95.2% for AGIs $25k-50k, 94.5% for AGIs $50k-75k, 94.3% for AGIs $75k-100k, 95.2% for AGIs $100k-200k, 95.2% for AGIs over 200k)
Averages for the 2012 tax year for zip code 40165, filed in 2013:
Average Adjusted Gross Income (AGI) in 2012: $48,401 (Individual Income Tax Returns)
Here:
$48,401
State:
$50,814
Salary/wage: $42,253 (reported on 88.2% of returns)
Here:
$42,253
State:
$42,723
(% of AGI for various income ranges: 76.6% for AGIs below $25k, 79.0% for AGIs $25k-50k, 79.0% for AGIs $50k-75k, 81.0% for AGIs $75k-100k, 80.4% for AGIs $100k-200k, 43.2% for AGIs over 200k)
Taxable interest for individuals: $1,019 (reported on 28.5% of returns)
This zip code:
$1,019
Kentucky:
$1,381
(% of AGI for various income ranges: 0.9% for AGIs below $25k, 0.6% for AGIs $25k-50k, 0.6% for AGIs $50k-75k, 0.5% for AGIs $75k-100k, 0.5% for AGIs $100k-200k, 0.9% for AGIs over 200k)
Ordinary dividends: $2,522 (reported on 13.3% of returns)
Here:
$2,522
State:
$6,239
(% of AGI for various income ranges: 0.5% for AGIs below $25k, 0.4% for AGIs $25k-50k, 0.4% for AGIs $50k-75k, 0.4% for AGIs $75k-100k, 0.6% for AGIs $100k-200k, 3.4% for AGIs over 200k)
Net capital gain/loss in AGI: +$4,937 (reported on 8.8% of returns)
Here:
+$4,937
State:
+$11,336
(% of AGI for various income ranges: 0.2% for AGIs $25k-50k, 0.3% for AGIs $50k-75k, 0.3% for AGIs $75k-100k, 0.8% for AGIs $100k-200k, 7.5% for AGIs over 200k)
Profit/loss from business: +$9,128 (reported on 12.2% of returns)
Here:
+$9,128
State:
+$10,862
(% of AGI for various income ranges: 5.7% for AGIs below $25k, 2.4% for AGIs $25k-50k, 1.9% for AGIs $50k-75k, 1.5% for AGIs $75k-100k, 1.5% for AGIs $100k-200k, 3.3% for AGIs over 200k)
Taxable individual retirement arrangement distribution: $12,167 (reported on 7.8% of returns)
40165:
$12,167
Kentucky:
$14,296
(% of AGI for various income ranges: 2.0% for AGIs below $25k, 1.9% for AGIs $25k-50k, 1.8% for AGIs $50k-75k, 2.2% for AGIs $75k-100k, 2.4% for AGIs $100k-200k)
Self-employment retirement plans: $13,250 (reported on 0.1% of returns)
40165:
$13,250
Kentucky:
$20,768
Total itemized deductions: $18,410 (22% of AGI, reported on 33.4% of returns)
Here:
$18,410
State:
$21,160
Here:
21.6% of AGI
State:
20.0% of AGI
(% of AGI for various income ranges: 7.2% for AGIs below $25k, 9.7% for AGIs $25k-50k, 12.9% for AGIs $50k-75k, 14.6% for AGIs $75k-100k, 15.3% for AGIs $100k-200k, 13.6% for AGIs over 200k)
Charity contributions: $2,808 (reported on 27.1% of returns)
Here:
$2,808
State:
$4,303
(% of AGI for various income ranges: 0.7% for AGIs below $25k, 1.0% for AGIs $25k-50k, 1.4% for AGIs $50k-75k, 1.6% for AGIs $75k-100k, 2.1% for AGIs $100k-200k, 2.6% for AGIs over 200k)
Taxes paid: $7,158 (reported on 33.3% of returns)
40165:
$7,158
State:
$8,496
(% of AGI for various income ranges: 1.3% for AGIs below $25k, 2.6% for AGIs $25k-50k, 4.4% for AGIs $50k-75k, 6.0% for AGIs $75k-100k, 7.1% for AGIs $100k-200k, 6.6% for AGIs over 200k)
Earned income credit: $2,200 (reported on 19.5% of returns)
Here:
$2,200
State:
$2,273
(% of AGI for various income ranges: 6.6% for AGIs below $25k, 1.2% for AGIs $25k-50k)
Percentage of individuals using paid preparers for their 2012 taxes: 55.3%
Here:
55%
State:
60%
(% for various income ranges: 51.9% for AGIs below $25k, 55.4% for AGIs $25k-50k, 57.2% for AGIs $50k-75k, 58.2% for AGIs $75k-100k, 59.9% for AGIs $100k-200k, 78.6% for AGIs over 200k)
Averages for the 2004 tax year for zip code 40165, filed in 2005:
Average Adjusted Gross Income (AGI) in 2004: $43,527 (Individual Income Tax Returns)
Here:
$43,527
State:
$41,540
Salary/wage: $38,069 (reported on 89.9% of returns)
Here:
$38,069
State:
$36,432
(% of AGI for various income ranges: 96.0% for AGIs below $10k, 78.5% for AGIs $10k-25k, 81.9% for AGIs $25k-50k, 83.0% for AGIs $50k-75k, 85.2% for AGIs $75k-100k, 64.5% for AGIs over 100k)
Taxable interest for individuals: $1,174 (reported on 39.7% of returns)
This zip code:
$1,174
Kentucky:
$1,571
(% of AGI for various income ranges: 2.9% for AGIs below $10k, 2.0% for AGIs $10k-25k, 0.9% for AGIs $25k-50k, 0.7% for AGIs $50k-75k, 0.7% for AGIs $75k-100k, 1.3% for AGIs over 100k)
Taxable dividends: $2,782 (reported on 16.2% of returns)
Here:
$2,782
State:
$3,453
(% of AGI for various income ranges: 0.9% for AGIs below $10k, 0.4% for AGIs $10k-25k, 0.5% for AGIs $25k-50k, 0.5% for AGIs $50k-75k, 0.4% for AGIs $75k-100k, 2.9% for AGIs over 100k)
Net capital gain/loss: +$8,807 (reported on 11.6% of returns)
Here:
+$8,807
State:
+$9,663
(% of AGI for various income ranges: -0.5% for AGIs below $10k, 0.2% for AGIs $10k-25k, 0.5% for AGIs $25k-50k, 0.9% for AGIs $50k-75k, 1.4% for AGIs $75k-100k, 7.4% for AGIs over 100k)
Profit/loss from business: +$7,123 (reported on 13.8% of returns)
Here:
+$7,123
State:
+$9,233
(% of AGI for various income ranges: 1.8% for AGIs below $10k, 4.2% for AGIs $10k-25k, 2.4% for AGIs $25k-50k, 1.9% for AGIs $50k-75k, 1.6% for AGIs $75k-100k, 2.3% for AGIs over 100k)
IRA payment deduction: $2,874 (reported on 2.0% of returns)
40165:
$2,874
Kentucky:
$2,955
(% of AGI for various income ranges: 0.2% for AGIs $10k-25k, 0.2% for AGIs $25k-50k, 0.1% for AGIs $50k-75k, 0.1% for AGIs $75k-100k, 0.1% for AGIs over 100k)
Self-employed pension: $8,415 (reported on 0.3% of returns)
Here:
$8,415
Kentucky:
$14,996
Total itemized deductions: $16,169 (22% of AGI, reported on 39.2% of returns)
Here:
$16,169
State:
$17,474
Here:
22.4% of AGI
State:
21.0% of AGI
(% of AGI for various income ranges: 9.9% for AGIs below $10k, 8.4% for AGIs $10k-25k, 12.6% for AGIs $25k-50k, 16.4% for AGIs $50k-75k, 17.5% for AGIs $75k-100k, 14.8% for AGIs over 100k)
Charity contributions deductions: $2,549 (3% of AGI, reported on 34.5% of returns)
Here:
$2,549
State:
$3,494
Here:
3.4% of AGI
State:
4.0% of AGI
(% of AGI for various income ranges: 0.6% for AGIs below $10k, 1.0% for AGIs $10k-25k, 1.4% for AGIs $25k-50k, 2.1% for AGIs $50k-75k, 2.2% for AGIs $75k-100k, 2.9% for AGIs over 100k)
Total tax: $5,333 (reported on 77.6% of returns)
40165:
$5,333
State:
$6,162
(% of AGI for various income ranges: 2.5% for AGIs below $10k, 4.0% for AGIs $10k-25k, 6.3% for AGIs $25k-50k, 8.2% for AGIs $50k-75k, 9.8% for AGIs $75k-100k, 16.3% for AGIs over 100k)
Earned income credit: $1,669 (reported on 15.9% of returns)
Here:
$1,669
State:
$1,723
Percentage of individuals using paid preparers for their 2004 taxes: 63.1%
Here:
63%
State:
66%
(% for various income ranges: 55.0% for AGIs below $10k, 65.8% for AGIs $10k-25k, 65.6% for AGIs $25k-50k, 63.3% for AGIs $50k-75k, 61.1% for AGIs $75k-100k, 66.5% for AGIs over 100k)
Likely homosexual households (counted as self-reported same-sex unmarried-partner households)
Lesbian couples: 0.3% of all households
Gay men: 0.0% of all households
Household received Food Stamps/SNAP in the past 12 months: 1,404 Household did not receive Food Stamps/SNAP in the past 12 months: 13,371
Women who had a birth in the past 12 months: 347 (249 now married, 96 unmarried) Women who did not have a birth in the past 12 months: 8,042 (3,890 now married, 4,157 unmarried)
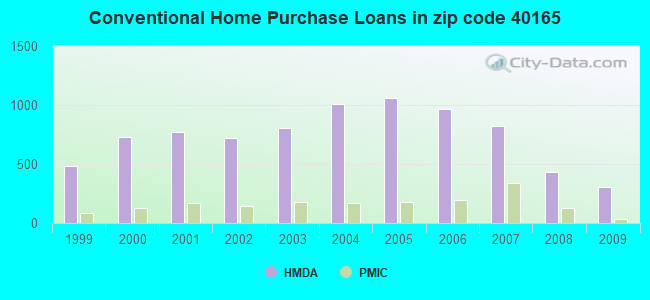
Housing units in zip code 40165 with a mortgage: 7,385 (613 second mortgage, 13 home equity loan, 504 both second mortgage and home equity loan) Houses without a mortgage: 221
Median monthly owner costs for units with a mortgage: $1,447 Median monthly owner costs for units without a mortgage: $502
Residents with income below the poverty level in 2022:
This zip code:
13.8%
Whole state:
16.5%
Residents with income below 50% of the poverty level in 2022:
This zip code:
8.6%
Whole state:
9.0%
Median number of rooms in houses and condos:
Here:
6.4
State:
6.4
Median number of rooms in apartments:
Here:
4.5
State:
4.4
Notable locations in this zip code not listed on our city pages
Notable locations in zip code 40165: Camp Shantituck (A), Hubers Kenlite Station (B), Shepherdsville Wastewater Treatment Plant (C), Nichols Fire District Station 2 (D), Mount Washington Fire Protection District Station 3 (E), Shepherdsville Fire Department Station 1 (F), Southeast Bullitt Fire and Rescue (G), Nichols Fire Department (H), Zoneton Fire Department (I), Southeast Bullitt Fire and Rescue (J), Southeast Bullitt Volunteer Fire and Rescue (K), Shepherdsville Fire Department Station 2 (L), Bullitt County Emergency Medical Services (M). Display/hide their locations on the map
Churches in zip code 40165 include: Hebron Church (A), Mount Carmel Church (B), Mount Elmira Baptist Church (C), Pleasant Grove Baptist Church (D), Pleasant Valley Church (E), Sunnyside Church (F), Salem Church Of Christ (G), Bowmans Valley Church (H), Bullitt Lick Church (I). Display/hide their locations on the map
Cemeteries: Quick Cemetery (1), Jones Cemetery (2), Weathers Cemetery (3), Maraman Cemetery (4), Hall Cemetery (5), Brooks Cemetery (6), Campground Memorial Cemetery (7). Display/hide their locations on the map
Lakes and reservoirs: Froman Lake (A), Lake Nevin (B), Cedar Lakes (C), Bills Lake (D), Bennett Lake (E), Everback Lake (F). Display/hide their locations on the map
Streams, rivers, and creeks: Applegate Run (A), Bluelick Creek (B), Brooks Run (C), West Fork Overalls Creek (D), Curry Branch (E), Cox Creek (F), Clear Run (G), Middle Fork Overalls Creek (H), Cedar Creek (I). Display/hide their locations on the map
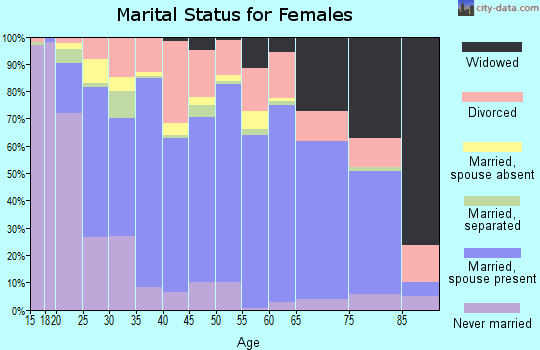
4,664 married couples with children.
2,409 single-parent households (835 men, 1,574 women).
97.5% of residents of 40165 zip code speak English at home.
1.0% of residents speak Spanish at home (77% very well, 20% well, 3% not well).
0.1% of residents speak other Indo-European language at home (100% very well).
0.3% of residents speak Asian or Pacific Island language at home (91% very well, 9% well).
1.1% of residents speak other language at home (46% very well, 54% not well).
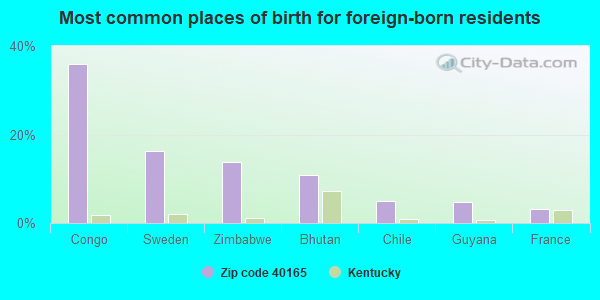
Foreign born population: 744 (2.0%) (51.3% of them are naturalized citizens)
This zip code:
2.0%
Whole state:
4.0%
36%Congo
16%Sweden
14%Zimbabwe
11%Bhutan
5%Chile
5%Guyana
3%France
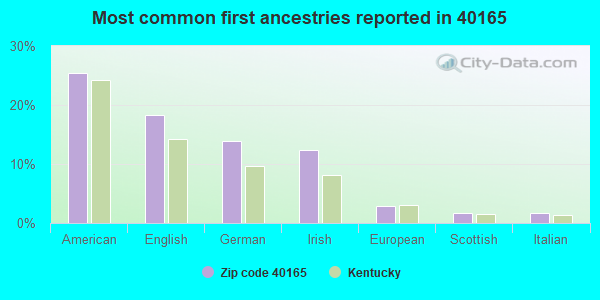
25%American
18%English
14%German
12%Irish
3%European
2%Scottish
2%Italian
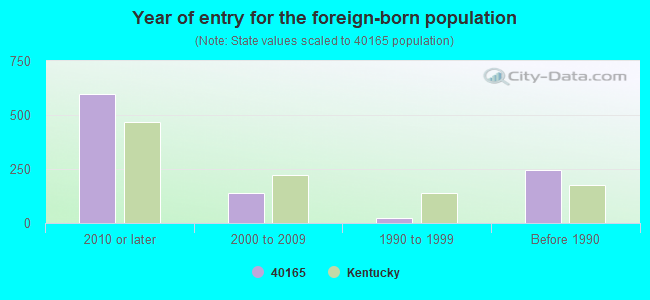
Year of entry for the foreign-born population
5982010 or later
1392000 to 2009
251990 to 1999
246Before 1990
Major facilities with environmental interests located in this zip code:
MAGO CONSTRUCTION CO INC (PRESTON HWY in SHEPHERDSVILLE, KY)
CRITERIA AND HAZARDOUS AIR POLLUTANT INVENTORY (Inventory of air pollution sources) National Pollutant Discharge Elimination System NON-MAJOR (Tracking pollutant discharge elimination systems) - permit (Resource Conservation and Recovery Act (tracking hazardous waste)) Business SIC classification: ASPHALT PAVING MIXTURES AND BLOCKS Organizations: MAGO CONSTRUCTION COMPANY (CONTACT/OWNER)
BULLITT CENTRAL HIGH SCHOOL (1330 HWY 44 E in SHEPHERDSVILLE, KY)
(National Center for Education Statistics) - STATE ID-015071015 Organizations: BULLITT COUNTY (SCHOOL DISTRICT)
FREEDOM ELEMENTARY SCHOOL (4682 NORTH PRESTON HWY. in SHEPHERDSVILLE, KY)
(National Center for Education Statistics) - STATE ID-015071006 Organizations: BULLITT COUNTY (SCHOOL DISTRICT)
BULLITT LICK MIDDLE SCHOOL (555 W BLUE LICK RD in SHEPHERDSVILLE, KY)
(National Center for Education Statistics) - STATE ID-015071018 Organizations: BULLITT COUNTY (SCHOOL DISTRICT)
CEDAR GROVE ELEMENTARY SCHOOL (1900 CEDAR GROVE ROAD in SHEPHERDSVILLE, KY)
(National Center for Education Statistics) - STATE ID-015071020 Organizations: BULLITT COUNTY (SCHOOL DISTRICT)
BERNHEIM MIDDLE SCHOOL (700 AUDUBON DR in SHEPHERDSVILLE, KY)
(National Center for Education Statistics) - STATE ID-015071005 Organizations: BULLITT COUNTY (SCHOOL DISTRICT)
NORTH BULLITT HIGH SCHOOL (3200 E HEBRON LN in SHEPHERDSVILLE, KY)
(National Center for Education Statistics) - STATE ID-015071075 Organizations: BULLITT COUNTY (SCHOOL DISTRICT)
BULLITT COUNTY DAY TREATMENT CTR ALT SCH (381 HIGH SCHOOL DR in SHEPHERDSVILLE, KY)
(National Center for Education Statistics) - STATE ID-015071120
BROOKS ELEMENTARY SCHOOL (1800 E BLUE LICK RD in SHEPHERDSVILLE, KY)
(National Center for Education Statistics) - STATE ID-015071010 Organizations: BULLITT COUNTY (SCHOOL DISTRICT)
ALLTEL (144 SOUTH BUCKMAN STREET in SHEPHERDSVILLE, KY)
(Integrated Compliance Information System) - ICIS-HQ-2000-6004, FORMAL ENFORCEMENT ACTION
MONARCH HARDWARE & MANUFACTURING CO. (805 NORTH BUCKMAN STREET in SHEPHERDSVILLE, KY)
National Pollutant Discharge Elimination System NON-MAJOR (Tracking pollutant discharge elimination systems) - permit Conditionally Exempt Small Quantity Generators, less than 100 kg/month of hazardous waste (Resource Conservation and Recovery Act (tracking hazardous waste)) - notification TRI REPORTER (Tracking of toxic chemicals releasing facilities) Business SIC classification: HARDWARE Business NAICS classification: ORNAMENTAL AND ARCHITECTURAL METAL WORK MANUFACTURING. Organizations: NT MONARCH HARDWARE (CONTACT/OWNER)
, NEWMAN TONKS INC (CONTACT/OWNER)
Alternative names: NT MONARCH HARDWARE
PILOT CORP (2050 E BLUE LICK RD in SHEPHERDSVILLE, KY)
(Integrated Compliance Information System) - ICIS-HQ-1999-0012, FORMAL ENFORCEMENT ACTION Business SIC classification: GASOLINE SERVICE STATIONS; AUTOMOTIVE SERVICES, EXCEPT REPAIR AND CARWASHES
MEDIMMUNE DISTRIBUTION LLC (355 OMICRON COURT in SHEPHERDSVILLE, KY)
Housing units lacking complete plumbing facilities: 2.0% Housing units lacking complete kitchen facilities: 1.9%
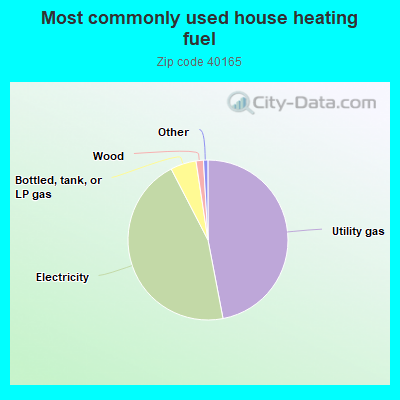
47.0%Utility gas
45.4%Electricity
5.2%Bottled, tank, or LP gas
1.5%Wood
Population in 1990: 18,649. Population change in the 1990s: +8,178 (+43.9%).
Place of birth for U.S.-born residents:
This state: 30,815
Northeast: 748
Midwest: 2,557
South: 2,080
West: 779
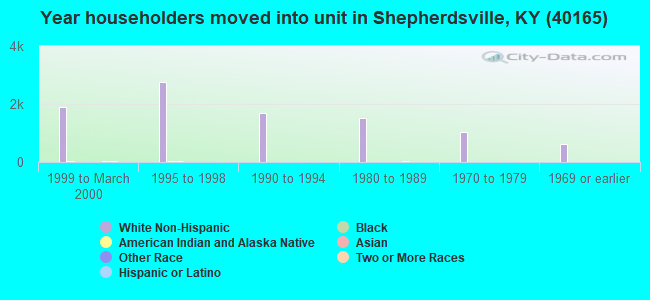
57% of the 40165 zip code residents lived in the same house 5 years ago. Out of people who lived in different houses, 49% lived in this county. Out of people who lived in different counties, 50% lived in Kentucky.
94% of the 40165 zip code residents lived in the same house 1 year ago. Out of people who lived in different houses, 50% moved from this county. Out of people who lived in different houses, 39% moved from different county within same state. Out of people who lived in different houses, 11% moved from different state. Out of people who lived in different houses, 1% moved from abroad.
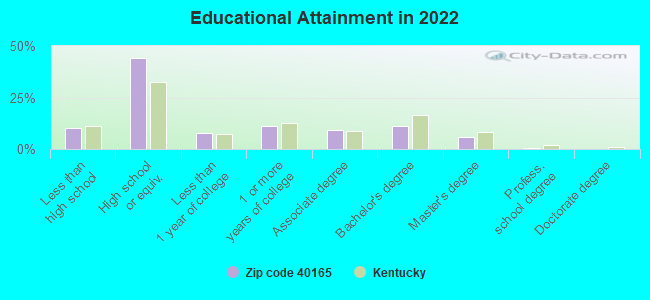
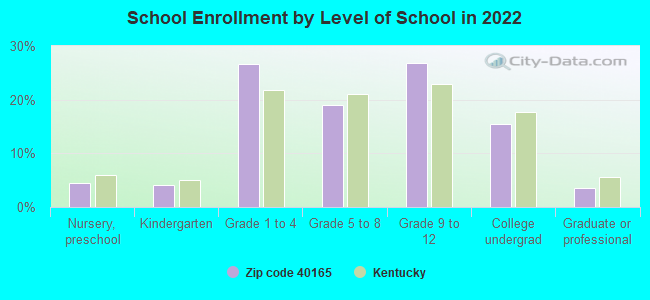
Private vs. public school enrollment:
Students in private schools in grades 1 to 8 (elementary and middle school): 939
Here:
24.7%
Kentucky:
17.2%
Students in private schools in grades 9 to 12 (high school): 320
Here:
14.6%
Kentucky:
15.2%
Students in private undergraduate colleges: 293
Here:
23.1%
Kentucky:
19.6%
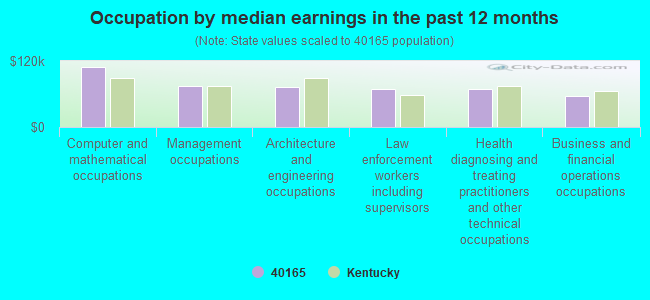
Occupation by median earnings in the past 12 months ($)
109,824Computer and mathematical occupations
74,562Management occupations
72,259Architecture and engineering occupations
69,728Law enforcement workers including supervisors
68,231Health diagnosing and treating practitioners and other technical occupations
56,945Business and financial operations occupations
Companies with federal contracts located in this zip code (SHEPHERDSVILLE, KY):
MEDIMMUNE (355 OMICRON CT)
$12,729,255 with Defense Logistics Agency for Drugs and Biologicals. Taking place in PA. Signed on 2006-06-21. Completion date: 2007-01-01.
AMEN AUTO SALVAGE (1215 W BLUELICK RD; small business) : $112,475 in 3 contractsin 2005
$90,000 with Army for Training Aids. Signed on 2005-01-31. Completion date: 2005-01-08.
$15,000, same as above.Signed on 2005-12-01. Completion date: 2006-11-30.
$7,475 with Army for Vehicular Cab, Body, and Frame Structural Components. Signed on 2005-12-20. Completion date: 2006-02-01.
SUSAN L BUSE, R N (248 WEST PEACEFUL COURT; small business) : $64,140 in 11 contractsfrom 2003 to 2006
Contracts for Nursing Services by Army, U.S. Army Corps of Engineers - civil program financing only Signed by year:2000: $0; 2001: $0; 2002: $0; 2003: $2,484; 2004: $23,712; 2005: $18,678; 2006: $19,266.
Biggest contracts:
$19,266 with Army for Nursing Services. Signed on 2006-02-01. Completion date: 2004-01-31.
$11,856, same as above.Signed on 2004-01-23. Completion date: 2004-01-31.
$11,856 with U.S. Army Corps of Engineers - civil program financing only for Nursing Services. Signed on 2004-01-23. Completion date: 2004-01-31.
$11,499, same as above.Signed on 2005-01-18. Completion date: 2004-01-31.
SUPERIOR TRAILER SALES & RENTA (450 SPARROW DR; small business) : $28,627 in 4 contractsin 2004
$14,750 with Army for Trailers. Signed on 2004-09-30. Completion date: 2004-10-29.
$7,520, same as above.Signed on 2004-09-15. Completion date: 2004-10-01.
$6,157, same as above.Signed on 2004-08-23. Completion date: 2004-10-07.
$200, same as above.Signed on 2004-10-12. Completion date: 2004-10-29.
AMISH MADE, LLC (360 HIGHWAY 44 E; small business) : $14,790 in 6 contractsfrom 2004 to 2006
Contracts for Prefabricated and Portable Buildings by Army Signed by year:2000: $0; 2001: $0; 2002: $0; 2003: $0; 2004: $3,720; 2005: $7,870; 2006: $3,200.
Biggest contracts:
$4,120 with Army for Prefabricated and Portable Buildings. Signed on 2005-09-21. Completion date: 2005-09-10.
$4,005, same as above.Signed on 2005-03-08. Completion date: 2005-03-09.
$3,750, same as above.Signed on 2005-03-22. Completion date: 2005-03-28.
$3,720, same as above.Signed on 2004-08-17. Completion date: 2004-09-10.
REYNOLDS PERFORMANCE MARINE (2880 HWY 44 EAST; small business) : $9,831 in 3 contractsin 2003
$8,489 with U.S. Army Corps of Engineers - civil program financing only for Small Craft. Signed on 2003-09-26. Completion date: 2003-09-30.
$671 with Army for Small Craft. Signed on 2003-12-11. Completion date: 2003-09-30.
$671 with U.S. Army Corps of Engineers - civil program financing only for Small Craft. Signed on 2003-12-11. Completion date: 2003-09-30.
Top industries in this zip code by the number of employees in 2005:
2003 - 2018 National Fire Incident Reporting System (NFIRS) incidents
According to the data from the years 2003 - 2018 the average number of fires per year is 165. The highest number of fire incidents - 334 took place in 2010, and the least - 34 in 2003. The data has a rising trend.
When looking into fire subcategories, the most reports belonged to: Outside Fires (43.3%), and Structure Fires (27.7%).
Fire incident types reported to NFIRS in Zip Code 40165


 Nearest zip codes: 40110, 40150, 40229, 40109, 40047, 40118.


 According to the data from the years 2003 - 2018 the average number of fires per year is 165. The highest number of fire incidents - 334 took place in 2010, and the least - 34 in 2003. The data has a rising trend.
 When looking into fire subcategories, the most reports belonged to: Outside Fires (43.3%), and Structure Fires (27.7%).