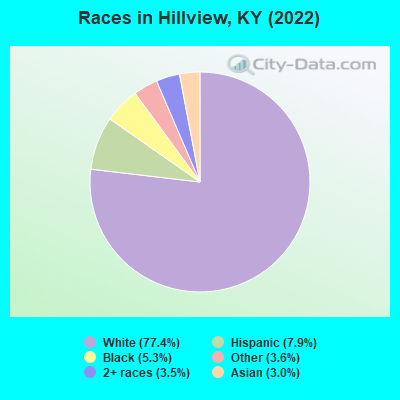
Percentage of residents living in poverty in 2022: 10.3%
(6.6% for White Non-Hispanic residents, 16.7% for Black residents, 46.5% for Hispanic or Latino residents, 35.2% for two or more races residents)
According to our research of Kentucky and other state lists, there was 1 registered sex offender living in Hillview, Kentucky as of April 26, 2024. The ratio of all residents to sex offenders in Hillview is 8,737 to 1. The ratio of registered sex offenders to all residents in this city is much lower than the state average.
Crime rates in Hillview by year
Type
2009
2010
2011
2012
2013
2014
2015
2016
2017
2018
2019
2020
2021
2022
Murders (per 100,000)
0 (0.0)
0 (0.0)
0 (0.0)
0 (0.0)
0 (0.0)
0 (0.0)
0 (0.0)
0 (0.0)
0 (0.0)
0 (0.0)
0 (0.0)
0 (0.0)
0 (0.0)
0 (0.0)
Rapes (per 100,000)
1 (13.1)
1 (12.2)
0 (0.0)
2 (24.2)
1 (10.6)
1 (12.5)
3 (37.0)
5 (61.1)
2 (22.4)
4 (43.7)
2 (21.7)
1 (10.7)
3 (32.3)
2 (22.9)
Robberies (per 100,000)
4 (52.4)
4 (48.9)
5 (60.8)
3 (36.2)
7 (74.0)
4 (50.1)
10 (123.4)
3 (36.7)
3 (33.5)
2 (21.8)
1 (10.8)
0 (0.0)
6 (64.7)
0 (0.0)
Assaults (per 100,000)
8 (104.8)
5 (61.2)
2 (24.3)
3 (36.2)
6 (63.4)
5 (62.7)
2 (24.7)
0 (0.0)
1 (11.2)
3 (32.7)
5 (54.1)
4 (43.0)
3 (32.3)
11 (126.1)
Burglaries (per 100,000)
54 (707.7)
56 (685.3)
92 (1,118)
63 (761.0)
45 (475.4)
51 (639.1)
40 (493.6)
34 (415.8)
27 (301.9)
11 (120.0)
14 (151.6)
24 (257.8)
18 (194.1)
11 (126.1)
Thefts (per 100,000)
150 (1,966)
136 (1,664)
134 (1,629)
145 (1,751)
110 (1,162)
100 (1,253)
97 (1,197)
72 (880.5)
76 (849.9)
74 (807.6)
73 (790.5)
119 (1,278)
114 (1,229)
83 (951.7)
Auto thefts (per 100,000)
16 (209.7)
9 (110.1)
15 (182.3)
7 (84.6)
6 (63.4)
7 (87.7)
15 (185.1)
20 (244.6)
15 (167.7)
17 (185.5)
24 (259.9)
29 (311.5)
36 (388.2)
36 (412.8)
Arson (per 100,000)
2 (26.2)
0 (0.0)
0 (0.0)
0 (0.0)
0 (0.0)
0 (0.0)
0 (0.0)
0 (0.0)
0 (0.0)
0 (0.0)
0 (0.0)
1 (10.7)
0 (0.0)
4 (45.9)
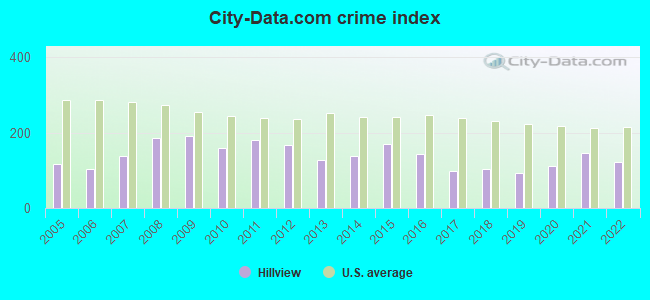
City-Data.com crime index
192.1
160.1
181.1
167.5
128.2
139.5
168.8
143.8
98.7
103.6
94.4
111.3
145.6
123.5
The City-Data.com crime index weighs serious crimes and violent crimes more heavily. Higher means more crime, U.S. average is 246.1. It adjusts for the number of visitors and daily workers commuting into cities.
Latest news from Hillview, KY collected exclusively by city-data.com from local newspapers, TV, and radio stations
Ancestries: American (30.7%), Irish (11.7%), English (8.2%), German (5.6%), Scottish (1.7%), European (1.7%).
Current Local Time: EST time zone
Incorporated on 03/28/1974
Land area: 4.16 square miles.
Population density: 2,106 people per square mile (low).
1,105 residents are foreign born (4.3% Latin America, 4.2% Africa, 3.9% Asia).
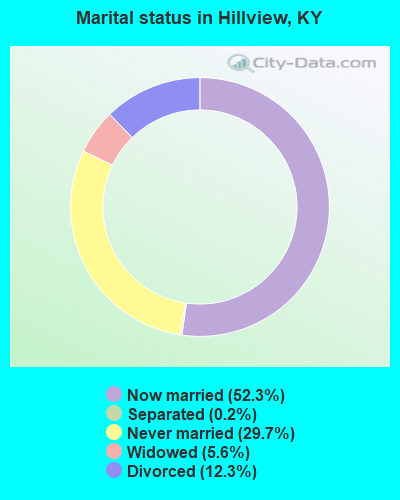
This city:
12.5%
Kentucky:
4.1%
Median real estate property taxes paid for housing units with mortgages in 2022: $1,814 (0.9%) Median real estate property taxes paid for housing units with no mortgage in 2022: $1,217 (0.8%)
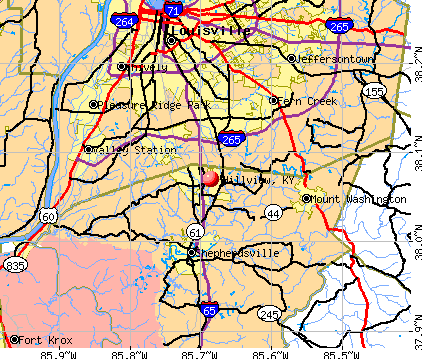
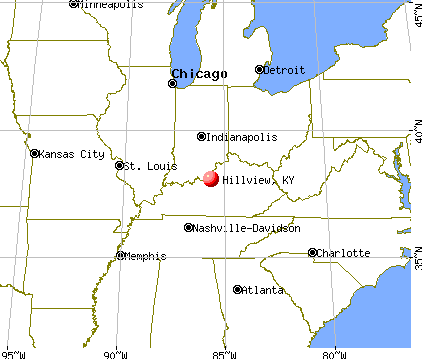
Nearest city with pop. 50,000+: Louisville, KY (11.5 miles , pop. 256,231).
Nearest city with pop. 1,000,000+: Chicago, IL (281.4 miles , pop. 2,896,016).
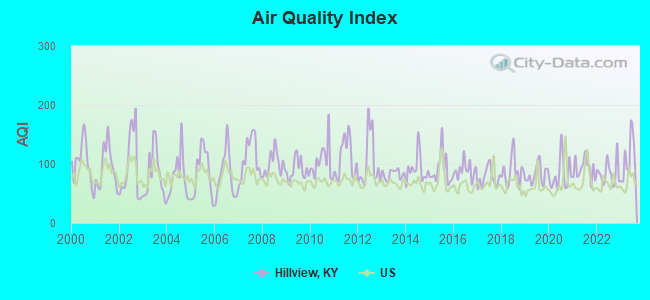
Air Quality Index (AQI) level in 2023 was 109. This is significantly worse than average.
City:
109
U.S.:
73
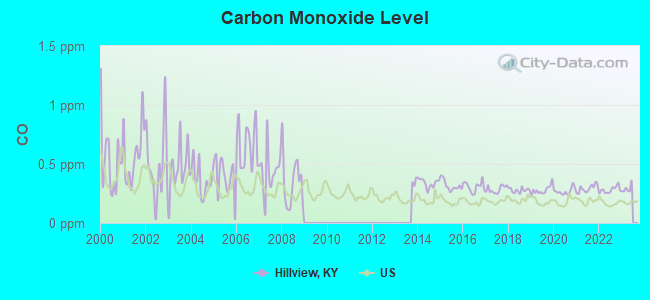
Carbon Monoxide (CO) [ppm] level in 2022 was 0.281. This is about average.Closest monitor was 8.7 miles away from the city center.
City:
0.281
U.S.:
0.251
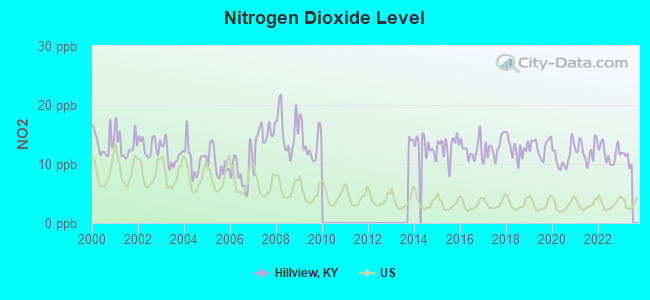
Nitrogen Dioxide (NO2) [ppb] level in 2022 was 11.8. This is significantly worse than average.Closest monitor was 4.7 miles away from the city center.
City:
11.8
U.S.:
5.1
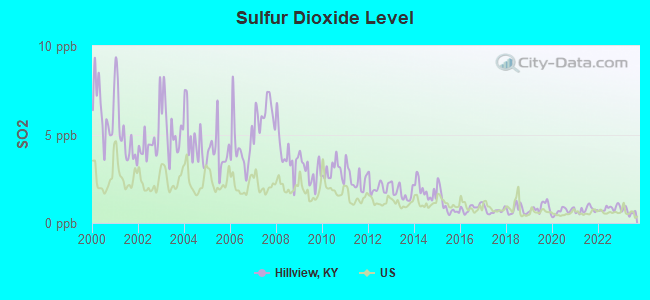
Sulfur Dioxide (SO2) [ppb] level in 2023 was 0.653. This is significantly better than average.Closest monitor was 4.7 miles away from the city center.
City:
0.653
U.S.:
1.515
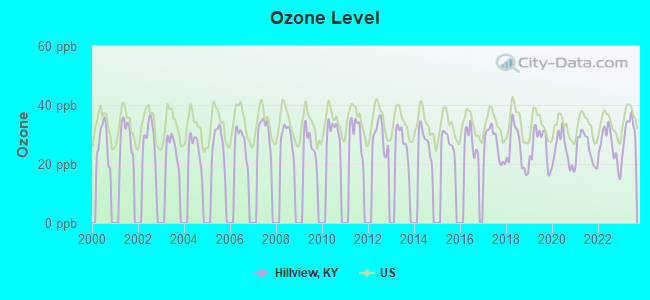
Ozone [ppb] level in 2023 was 31.1. This is about average.Closest monitor was 5.1 miles away from the city center.
City:
31.1
U.S.:
33.3
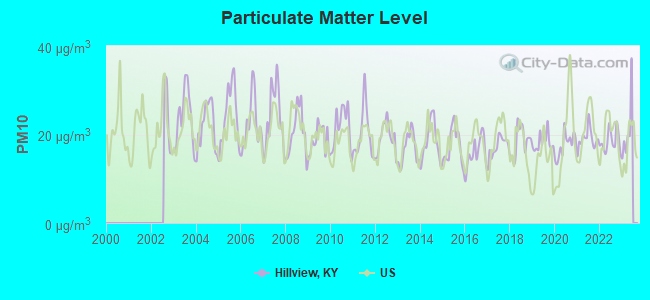
Particulate Matter (PM10) [µg/m3] level in 2022 was 18.5. This is about average.Closest monitor was 5.9 miles away from the city center.
City:
18.5
U.S.:
19.2
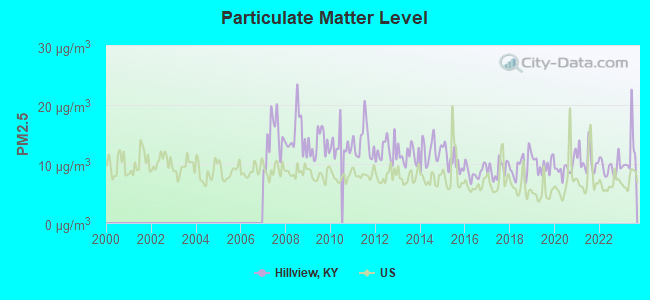
Particulate Matter (PM2.5) [µg/m3] level in 2023 was 11.8. This is significantly worse than average.Closest monitor was 6.0 miles away from the city center.
City:
11.8
U.S.:
8.1
Tornado activity:
Hillview-area historical tornado activity is slightly above Kentucky state average. It is 59% greater than the overall U.S. average.
On 4/3/1974, a category F5 (max. wind speeds 261-318 mph) tornado 22.6 miles away from the Hillview city center killed 31 peopleand injured 270 peopleand causedbetween $500,000 and $5,000,000 in damages.
On 5/28/1996, a category F4 (max. wind speeds 207-260 mph) tornado 6.6 miles away from the city center injured 10 peopleand caused $101 million in damages.
Earthquake activity:
Hillview-area historical earthquake activity is significantly above Kentucky state average. It is 114% greater than the overall U.S. average.
On 4/18/2008 at 09:36:59, a magnitude 5.4 (5.1 MB, 4.8 MS, 5.4 MW, 5.2 MW, Class: Moderate, Intensity: VI - VII) earthquake occurred 122.4 miles away from Hillview center On 7/27/1980 at 18:52:21, a magnitude 5.2 (5.1 MB, 4.7 MS, 5.0 UK, 5.2 UK) earthquake occurred 95.3 miles away from Hillview center On 4/18/2008 at 09:36:59, a magnitude 5.2 (5.2 MW, Depth: 8.9 mi) earthquake occurred 122.4 miles away from the city center On 6/10/1987 at 23:48:54, a magnitude 5.1 (4.9 MB, 4.4 MS, 4.6 MS, 5.1 LG) earthquake occurred 130.0 miles away from the city center On 6/18/2002 at 17:37:15, a magnitude 5.0 (4.3 MB, 4.6 MW, 5.0 LG) earthquake occurred 114.3 miles away from Hillview center On 4/18/2008 at 15:14:16, a magnitude 4.8 (4.5 MB, 4.8 MW, 4.6 MW, Class: Light, Intensity: IV - V) earthquake occurred 120.7 miles away from Hillview center Magnitude types: regional Lg-wave magnitude (LG), body-wave magnitude (MB), surface-wave magnitude (MS), moment magnitude (MW)
Natural disasters:
The number of natural disasters in Bullitt County (18) is near the US average (15). Major Disasters (Presidential) Declared: 14 Emergencies Declared: 2
Causes of natural disasters: Floods: 11, Storms: 10, Tornadoes: 6, Mudslides: 4, Landslides: 3, Winter Storms: 3, Blizzard: 1, Heavy Rain: 1, Hurricane: 1, Snowstorm: 1, Tropical Depression: 1, Wind: 1, Other: 1 (Note: some incidents may be assigned to more than one category).
Hospitals and medical centers near Hillview:
WESLEY MANOR NURSING CENTER (Nursing Home, about 4 miles away; LOUISVILLE, KY)
FILSON CARE HOME (Nursing Home, about 4 miles away; LOUISVILLE, KY)
REGENCY CARE AND REHABILITATION CENTER (Nursing Home, about 4 miles away; LOUISVILLE, KY)
FRANCISCAN HEALTH CARE CENTER (Nursing Home, about 7 miles away; LOUISVILLE, KY)
GREEN MEADOWS HEALTH CARE CENTER 1 (Nursing Home, about 8 miles away; MOUNT WASHINGTON, KY)
MEADOWS ICF/MR (Hospital, about 8 miles away; MOUNT WASHINGTON, KY)
SIGNATURE HEALTHCARE OF SOUTH LOUISVILLE (Nursing Home, about 8 miles away; LOUISVILLE, KY)
Churches in Hillview include: Saint Marys Catholic Church (A), Overdale United Methodist Church (B), Hillview Assembly of God (C). Display/hide their locations on the map
Bullitt County has a predicted average indoor radon screening level greater than 4 pCi/L (pico curies per liter) - Highest Potential
Average household size:
This city:
2.8 people
Kentucky:
2.5 people
Percentage of family households:
This city:
74.9%
Whole state:
66.9%
Percentage of households with unmarried partners:
This city:
9.2%
Whole state:
6.4%
Likely homosexual households (counted as self-reported same-sex unmarried-partner households)
Lesbian couples: 0.4% of all households
Gay men: 0.3% of all households
Banks with branches in Hillview (2011 data):
PBI Bank: North Bullitt Branch at 6980 Preston Highway North, branch established on 1976/12/30. Info updated 2008/03/03: Bank assets: $1,461.9 mil, Deposits: $1,326.3 mil, headquarters in Louisville, KY, negative income in the last year, Commercial Lending Specialization, 19 total offices, Holding Company: Porter Bancorp, Inc.
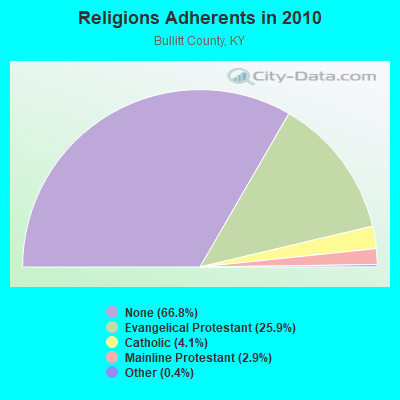
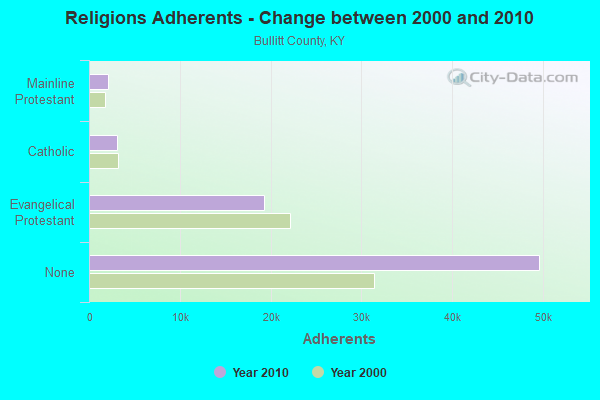
Religion statistics for Hillview, KY (based on Bullitt County data)
Religion
Adherents
Congregations
Evangelical Protestant
19,239
62
Catholic
3,054
3
Mainline Protestant
2,123
10
Other
291
4
None
49,612
-
Source: Clifford Grammich, Kirk Hadaway, Richard Houseal, Dale E.Jones, Alexei Krindatch, Richie Stanley and Richard H.Taylor. 2012. 2010 U.S.Religion Census: Religious Congregations & Membership Study. Association of Statisticians of American Religious Bodies. Jones, Dale E., et al. 2002. Congregations and Membership in the United States 2000. Nashville, TN: Glenmary Research Center. Graphs represent county-level data
1911 Old Preston Highway North (Lat: 38.082500 Lon: -85.686667), Call Sign: WPXR347, Assigned Frequencies: 469.212 MHz, 469.037 MHz, 469.237 MHz, 469.062 MHz, 469.262 MHz, 469.087 MHz, 469.287 MHz, 469.112 MHz, 469.312 MHz, 469.137 MHz... (+21 more), Grant Date: 05/27/2003, Expiration Date: 05/27/2013, Cancellation Date: 07/27/2013, Certifier: Madora B Wilson, Registrant: Panasonic Information Systems Company, 1707 N Randall Road E1-D9, Elgin, IL 60123-7847, Phone: (847) 468-5318, Fax: (847) 468-5331, Email:
FCC Registered Microwave Towers:
1
Blue Lick, Blue Lick (Lat: 38.039361 Lon: -85.703583), Type: Ltower, Structure height: 12.2 m, Call Sign: WRPK736, Assigned Frequencies: 11325.0 MHz, Grant Date: 02/16/2022, Expiration Date: 02/16/2032, Certifier: John Pulliam, Registrant: Keller And Heckman LLP, 1001 G Street Nw, Suite 500 West, Washington, DC 20001, Phone: (202) 434-4100, Fax: (202) 434-4646, Email:
FCC Registered Amateur Radio Licenses:
2
Call Sign: KA4TEU, Licensee ID: L00880953, Grant Date: 06/30/2004, Expiration Date: 12/21/2013, Cancellation Date: 12/22/2015, Certifier: Keith S Benet, Registrant: Keith S Benet, 518 Blossom Rd, Hillview, KY 40229
Call Sign: KF4RFQ, Licensee ID: L00774608, Grant Date: 05/01/2007, Expiration Date: 05/01/2017, Cancellation Date: 05/02/2019, Registrant: Barb R Rogers, Hillview, KY 40129
FAA Registered Aircraft:
1
Aircraft: DIAMOND AIRCRAFT IND INC DA 40 (Category: Land, Seats: 4, Weight: Up to 12,499 Pounds), Engine: LYCOMING IO-360-M1A+ (180 HP) (Reciprocating) N-Number: 504DS, N504DS, N-504DS, Serial Number: 40.204, Year manufactured: 2002, Airworthiness Date: 04/19/2002, Certificate Issue Date: 01/21/2009 Registrant (Individual): George Albert Troychak, Po Box 370, Hillview, KY 40129
Home Mortgage Disclosure Act Aggregated Statistics For Year 2009 (Based on 3 partial tracts)
A) FHA, FSA/RHS & VA Home Purchase Loans
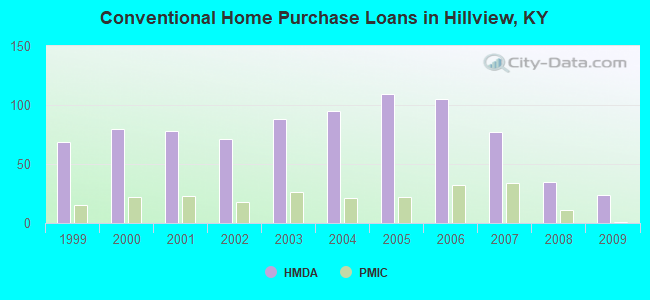
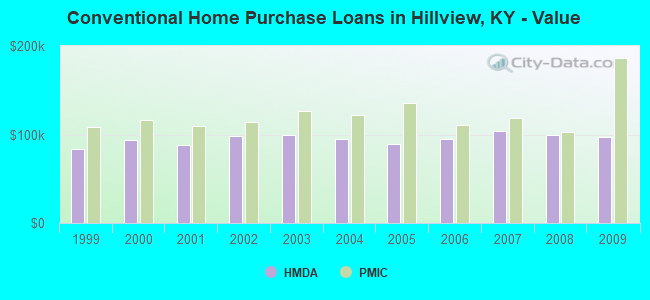
B) Conventional Home Purchase Loans
C) Refinancings
D) Home Improvement Loans
F) Non-occupant Loans on < 5 Family Dwellings (A B C & D)
G) Loans On Manufactured Home Dwelling (A B C & D)
Number
Average Value
Number
Average Value
Number
Average Value
Number
Average Value
Number
Average Value
Number
Average Value
LOANS ORIGINATED
26
$108,471
24
$97,475
143
$115,249
13
$34,632
12
$66,678
2
$17,210
APPLICATIONS APPROVED, NOT ACCEPTED
1
$71,590
1
$120,630
9
$137,186
2
$11,140
0
$0
1
$13,870
APPLICATIONS DENIED
6
$127,633
6
$102,463
60
$124,901
9
$29,233
2
$87,120
2
$35,195
APPLICATIONS WITHDRAWN
3
$147,493
0
$0
41
$123,657
1
$122,760
1
$61,240
0
$0
FILES CLOSED FOR INCOMPLETENESS
1
$127,960
1
$139,690
11
$115,305
3
$56,820
0
$0
0
$0
Aggregated Statistics For Year 2008 (Based on 3 partial tracts)
A) FHA, FSA/RHS & VA Home Purchase Loans
B) Conventional Home Purchase Loans
C) Refinancings
D) Home Improvement Loans
E) Loans on Dwellings For 5+ Families
F) Non-occupant Loans on < 5 Family Dwellings (A B C & D)
G) Loans On Manufactured Home Dwelling (A B C & D)
Number
Average Value
Number
Average Value
Number
Average Value
Number
Average Value
Number
Average Value
Number
Average Value
Number
Average Value
LOANS ORIGINATED
33
$114,109
35
$99,311
116
$99,250
9
$32,611
1
$4,207,260
21
$85,023
1
$52,150
APPLICATIONS APPROVED, NOT ACCEPTED
2
$119,980
4
$91,970
14
$112,381
5
$25,308
0
$0
2
$55,865
2
$18,550
APPLICATIONS DENIED
9
$104,530
9
$91,138
87
$114,040
11
$63,194
0
$0
8
$94,731
4
$36,058
APPLICATIONS WITHDRAWN
4
$101,590
4
$94,978
35
$128,610
1
$89,390
0
$0
1
$139,950
0
$0
FILES CLOSED FOR INCOMPLETENESS
2
$134,280
3
$92,253
6
$132,225
0
$0
0
$0
0
$0
0
$0
Aggregated Statistics For Year 2007 (Based on 3 partial tracts)
A) FHA, FSA/RHS & VA Home Purchase Loans
B) Conventional Home Purchase Loans
C) Refinancings
D) Home Improvement Loans
F) Non-occupant Loans on < 5 Family Dwellings (A B C & D)
G) Loans On Manufactured Home Dwelling (A B C & D)
Number
Average Value
Number
Average Value
Number
Average Value
Number
Average Value
Number
Average Value
Number
Average Value
LOANS ORIGINATED
15
$120,788
77
$103,825
126
$91,874
25
$38,298
20
$85,518
3
$38,290
APPLICATIONS APPROVED, NOT ACCEPTED
1
$108,490
7
$103,187
24
$106,116
5
$30,714
2
$71,740
1
$53,740
APPLICATIONS DENIED
10
$125,738
18
$94,094
101
$101,645
18
$20,271
6
$85,298
5
$32,022
APPLICATIONS WITHDRAWN
1
$59,860
5
$95,976
50
$118,060
4
$61,275
1
$71,960
0
$0
FILES CLOSED FOR INCOMPLETENESS
0
$0
2
$91,970
14
$117,304
2
$12,425
0
$0
0
$0
Aggregated Statistics For Year 2006 (Based on 3 partial tracts)
A) FHA, FSA/RHS & VA Home Purchase Loans
B) Conventional Home Purchase Loans
C) Refinancings
D) Home Improvement Loans
F) Non-occupant Loans on < 5 Family Dwellings (A B C & D)
G) Loans On Manufactured Home Dwelling (A B C & D)
Number
Average Value
Number
Average Value
Number
Average Value
Number
Average Value
Number
Average Value
Number
Average Value
LOANS ORIGINATED
23
$120,962
105
$95,283
137
$83,706
31
$20,495
24
$80,139
3
$42,840
APPLICATIONS APPROVED, NOT ACCEPTED
1
$123,180
9
$91,277
24
$82,891
3
$38,493
3
$73,020
2
$50,315
APPLICATIONS DENIED
3
$145,827
20
$65,786
115
$92,049
28
$36,060
6
$57,747
5
$32,400
APPLICATIONS WITHDRAWN
1
$68,580
10
$99,022
54
$102,012
3
$44,110
3
$89,767
0
$0
FILES CLOSED FOR INCOMPLETENESS
1
$101,870
3
$138,927
20
$95,766
0
$0
0
$0
0
$0
Aggregated Statistics For Year 2005 (Based on 3 partial tracts)
A) FHA, FSA/RHS & VA Home Purchase Loans
B) Conventional Home Purchase Loans
C) Refinancings
D) Home Improvement Loans
F) Non-occupant Loans on < 5 Family Dwellings (A B C & D)
G) Loans On Manufactured Home Dwelling (A B C & D)
Number
Average Value
Number
Average Value
Number
Average Value
Number
Average Value
Number
Average Value
Number
Average Value
LOANS ORIGINATED
32
$126,381
109
$89,450
176
$86,874
23
$43,930
23
$72,325
2
$18,450
APPLICATIONS APPROVED, NOT ACCEPTED
0
$0
14
$89,598
29
$81,201
3
$31,187
0
$0
2
$45,705
APPLICATIONS DENIED
5
$77,326
32
$78,904
126
$101,026
30
$35,235
2
$99,075
6
$38,463
APPLICATIONS WITHDRAWN
3
$116,807
9
$112,536
56
$101,218
10
$172,452
1
$111,090
1
$14,910
FILES CLOSED FOR INCOMPLETENESS
0
$0
6
$115,860
12
$108,350
1
$44,030
0
$0
0
$0
Aggregated Statistics For Year 2004 (Based on 3 partial tracts)
A) FHA, FSA/RHS & VA Home Purchase Loans
B) Conventional Home Purchase Loans
C) Refinancings
D) Home Improvement Loans
F) Non-occupant Loans on < 5 Family Dwellings (A B C & D)
G) Loans On Manufactured Home Dwelling (A B C & D)
Number
Average Value
Number
Average Value
Number
Average Value
Number
Average Value
Number
Average Value
Number
Average Value
LOANS ORIGINATED
35
$108,365
95
$95,092
243
$84,975
30
$33,927
24
$74,030
1
$31,010
APPLICATIONS APPROVED, NOT ACCEPTED
0
$0
12
$95,576
49
$85,138
8
$35,009
2
$56,155
1
$23,610
APPLICATIONS DENIED
4
$92,690
25
$81,890
127
$95,819
25
$26,446
3
$68,453
10
$50,377
APPLICATIONS WITHDRAWN
3
$100,267
9
$115,252
82
$98,477
4
$50,695
3
$102,887
0
$0
FILES CLOSED FOR INCOMPLETENESS
1
$91,100
5
$116,732
11
$88,740
1
$28,380
0
$0
0
$0
Aggregated Statistics For Year 2003 (Based on 3 partial tracts)
A) FHA, FSA/RHS & VA Home Purchase Loans
B) Conventional Home Purchase Loans
C) Refinancings
D) Home Improvement Loans
F) Non-occupant Loans on < 5 Family Dwellings (A B C & D)
Number
Average Value
Number
Average Value
Number
Average Value
Number
Average Value
Number
Average Value
LOANS ORIGINATED
40
$108,930
88
$99,335
438
$88,420
24
$25,608
23
$92,633
APPLICATIONS APPROVED, NOT ACCEPTED
4
$98,962
11
$95,493
56
$81,531
4
$29,212
1
$100,370
APPLICATIONS DENIED
4
$85,940
27
$75,655
116
$87,514
15
$26,739
4
$62,910
APPLICATIONS WITHDRAWN
4
$98,940
7
$126,569
79
$96,833
4
$47,665
2
$109,370
FILES CLOSED FOR INCOMPLETENESS
2
$84,475
6
$118,808
19
$95,697
0
$0
1
$99,000
Aggregated Statistics For Year 2002 (Based on 3 partial tracts)
A) FHA, FSA/RHS & VA Home Purchase Loans
B) Conventional Home Purchase Loans
C) Refinancings
D) Home Improvement Loans
F) Non-occupant Loans on < 5 Family Dwellings (A B C & D)
Number
Average Value
Number
Average Value
Number
Average Value
Number
Average Value
Number
Average Value
LOANS ORIGINATED
33
$108,560
71
$98,015
315
$84,899
24
$20,822
19
$70,141
APPLICATIONS APPROVED, NOT ACCEPTED
3
$103,600
13
$76,293
50
$89,892
4
$26,765
2
$64,925
APPLICATIONS DENIED
6
$107,168
18
$55,959
101
$84,298
20
$13,678
5
$78,358
APPLICATIONS WITHDRAWN
3
$78,937
10
$104,133
54
$89,541
3
$26,510
1
$77,890
FILES CLOSED FOR INCOMPLETENESS
1
$87,380
3
$99,447
17
$103,023
0
$0
1
$89,600
Aggregated Statistics For Year 2001 (Based on 3 partial tracts)
A) FHA, FSA/RHS & VA Home Purchase Loans
B) Conventional Home Purchase Loans
C) Refinancings
D) Home Improvement Loans
F) Non-occupant Loans on < 5 Family Dwellings (A B C & D)
Number
Average Value
Number
Average Value
Number
Average Value
Number
Average Value
Number
Average Value
LOANS ORIGINATED
57
$96,263
78
$88,212
308
$76,232
47
$19,454
26
$71,446
APPLICATIONS APPROVED, NOT ACCEPTED
1
$86,130
8
$74,106
44
$65,459
10
$20,352
2
$46,630
APPLICATIONS DENIED
1
$118,620
27
$42,558
92
$59,146
27
$13,141
2
$64,315
APPLICATIONS WITHDRAWN
2
$101,600
7
$110,687
46
$84,828
3
$38,130
2
$74,745
FILES CLOSED FOR INCOMPLETENESS
1
$167,050
2
$101,170
10
$74,661
0
$0
1
$132,510
Aggregated Statistics For Year 2000 (Based on 3 partial tracts)
A) FHA, FSA/RHS & VA Home Purchase Loans
B) Conventional Home Purchase Loans
C) Refinancings
D) Home Improvement Loans
E) Loans on Dwellings For 5+ Families
F) Non-occupant Loans on < 5 Family Dwellings (A B C & D)
Number
Average Value
Number
Average Value
Number
Average Value
Number
Average Value
Number
Average Value
Number
Average Value
LOANS ORIGINATED
55
$104,821
80
$94,251
119
$62,992
45
$17,740
1
$119,160
9
$68,020
APPLICATIONS APPROVED, NOT ACCEPTED
3
$135,060
11
$94,796
34
$61,864
16
$21,987
0
$0
1
$58,310
APPLICATIONS DENIED
5
$99,014
25
$45,480
75
$61,831
28
$23,735
0
$0
4
$43,158
APPLICATIONS WITHDRAWN
3
$90,283
7
$79,690
39
$65,573
5
$26,316
0
$0
0
$0
FILES CLOSED FOR INCOMPLETENESS
0
$0
2
$72,630
9
$71,691
0
$0
0
$0
0
$0
Aggregated Statistics For Year 1999 (Based on 3 partial tracts)
A) FHA, FSA/RHS & VA Home Purchase Loans
B) Conventional Home Purchase Loans
C) Refinancings
D) Home Improvement Loans
E) Loans on Dwellings For 5+ Families
F) Non-occupant Loans on < 5 Family Dwellings (A B C & D)
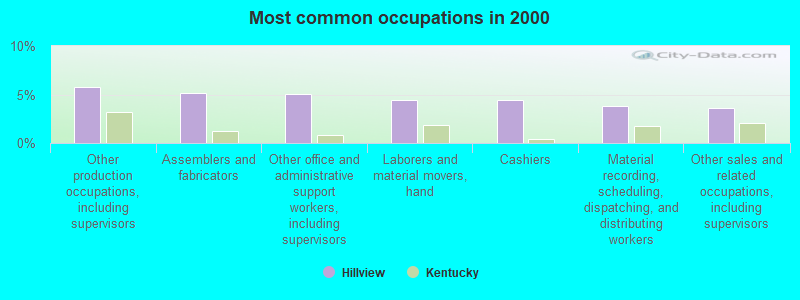
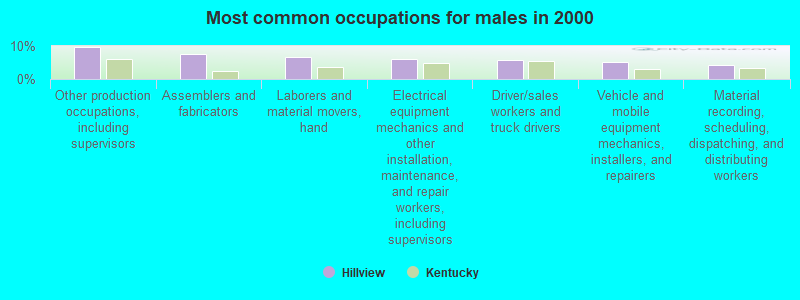
#15 on the list of "Top 101 cities with largest percentage of males in occupations: material moving occupations (population 5,000+)"
#30 on the list of "Top 101 cities with the highest percentage of English-only speaking households, population 5,000+"
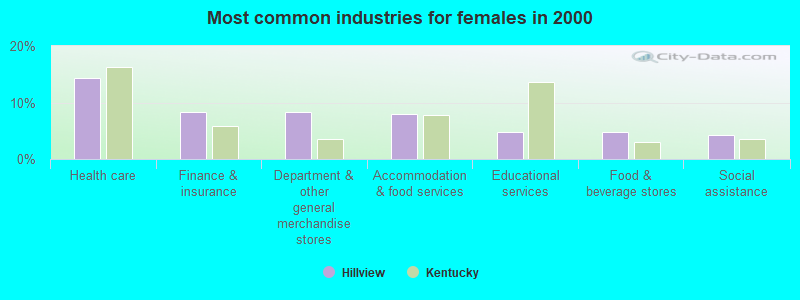
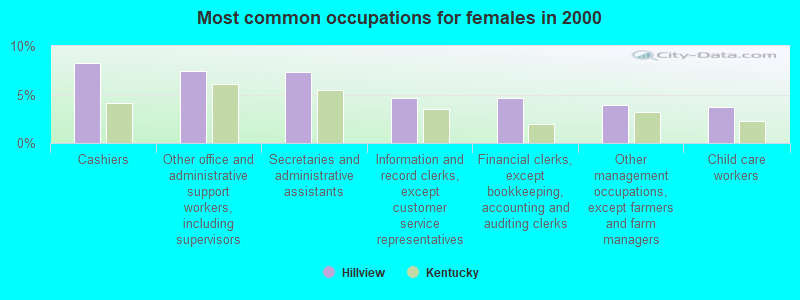
#50 on the list of "Top 101 cities with largest percentage of females in occupations: office and administrative support occupations (population 5,000+)"
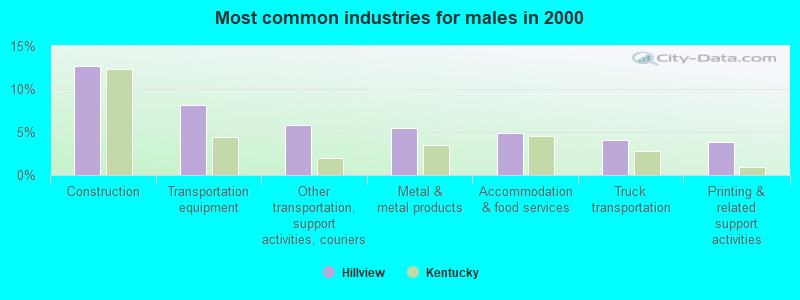
#101 on the list of "Top 101 cities with largest percentage of males in industries: transportation and warehousing (population 5,000+)"
#15 on the list of "Top 101 counties with the smallest number of people without health insurance coverage in 2000 (pop. 50,000+)"
#20 on the list of "Top 101 counties with the largest increase in the number of deaths per 1000 residents 2000-2006 to 2007-2013 (pop. 50,000+)"
There is 1 pilot and no other airmen in this city.


 Recent articles from our blog. Our writers, many of them Ph.D. graduates or candidates, create easy-to-read articles on a wide variety of topics.

 (11.5 miles