Estimated zip code population in 2022: 24,941 Zip code population in 2010: 23,678 Zip code population in 2000: 24,170
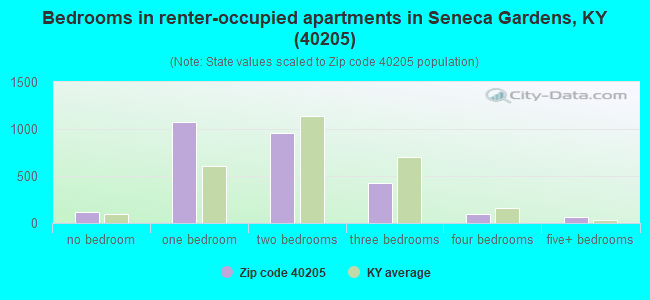
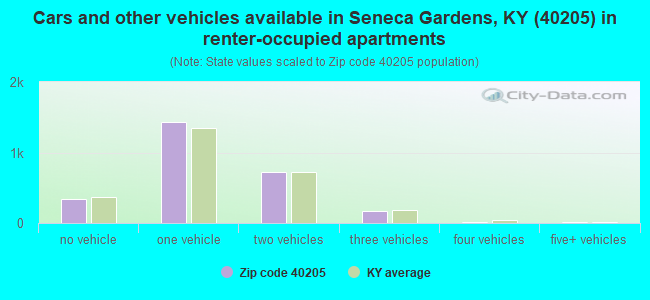
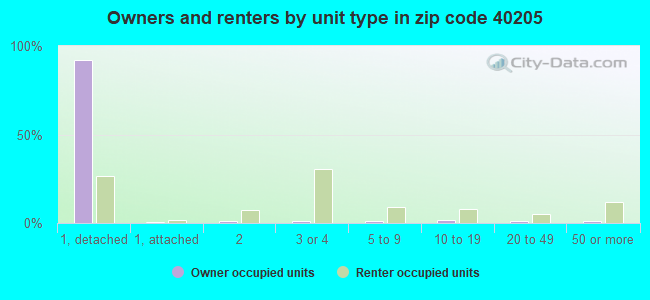
Houses and condos: 11,227 Renter-occupied apartments: 2,678
% of renters here:
25%
State:
31%
March 2022 cost of living index in zip code 40205: 89.1 (less than average, U.S. average is 100)
Land area: 7.0 sq. mi. Water area: 0.0 sq. mi.
Population density: 3,573 people per square mile
(average).
OSM Map
General Map
Google Map
MSN Map
OSM Map
General Map
Google Map
MSN Map
OSM Map
General Map
Google Map
MSN Map
OSM Map
General Map
Google Map
MSN Map
Please wait while loading the map...
Real estate property taxes paid for housing units in 2022:
This zip code:
0.9% ($3,234)
Kentucky:
0.7% ($1,456)
Median real estate property taxes paid for housing units with mortgages in 2022: $3,292 (0.8%) Median real estate property taxes paid for housing units with no mortgage in 2022: $3,118 (0.9%)
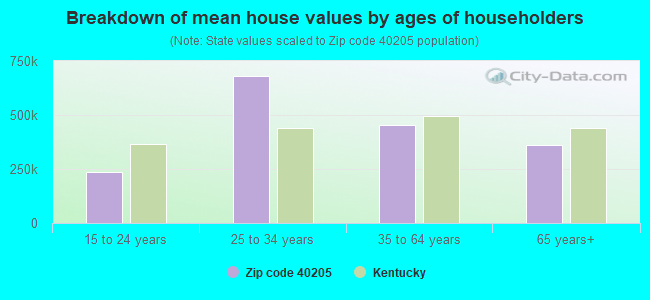
Estimated median house/condo value in 2022: $379,292
40205:
$379,292
Kentucky:
$196,300
According to our research of Kentucky and other state lists, there were 9 registered sex offenders living in 40205 zip code as of April 27, 2024. The ratio of all residents to sex offenders in zip code 40205 is 2,743 to 1. The ratio of registered sex offenders to all residents in this zip code is much lower than the state average.
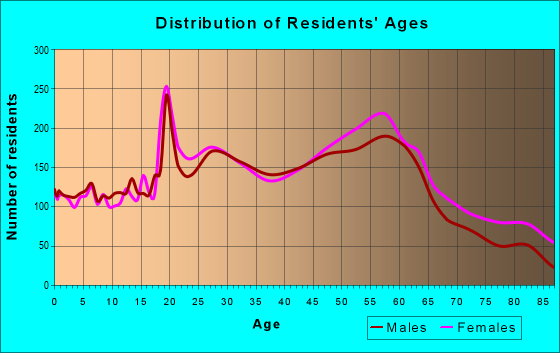
Median resident age:
This zip code:
42.3 years
Kentucky median age:
39.4 years
Average household size:
This zip code:
2.1 people
Kentucky:
2.4 people
Averages for the 2020 tax year for zip code 40205, filed in 2021:
Average Adjusted Gross Income (AGI) in 2020: $110,134 (Individual Income Tax Returns)
Here:
$110,134
State:
$61,342
Salary/wage: $86,119 (reported on 78.2% of returns)
Here:
$86,119
State:
$50,827
(% of AGI for various income ranges: 1152.7% for AGIs below $25k, 3621.6% for AGIs $25k-50k, 6151.9% for AGIs $50k-75k, 9172.3% for AGIs $75k-100k, 19131.0% for AGIs $100k-200k, 90262.6% for AGIs over 200k)
Taxable interest for individuals: $1,955 (reported on 43.7% of returns)
This zip code:
$1,955
Kentucky:
$1,441
(% of AGI for various income ranges: 29.9% for AGIs below $25k, 43.6% for AGIs $25k-50k, 55.9% for AGIs $50k-75k, 84.0% for AGIs $75k-100k, 171.9% for AGIs $100k-200k, 1441.1% for AGIs over 200k)
Ordinary dividends: $10,644 (reported on 38.6% of returns)
Here:
$10,644
State:
$7,388
(% of AGI for various income ranges: 78.4% for AGIs below $25k, 116.4% for AGIs $25k-50k, 238.3% for AGIs $50k-75k, 516.7% for AGIs $75k-100k, 763.3% for AGIs $100k-200k, 7687.1% for AGIs over 200k)
Net capital gain/loss in AGI: +$29,574 (reported on 33.7% of returns)
Here:
+$29,574
State:
+$19,475
(% of AGI for various income ranges: 43.1% for AGIs below $25k, 95.2% for AGIs $25k-50k, 167.7% for AGIs $50k-75k, 425.6% for AGIs $75k-100k, 1076.8% for AGIs $100k-200k, 25450.0% for AGIs over 200k)
Profit/loss from business: +$19,319 (reported on 19.1% of returns)
Here:
+$19,319
State:
+$11,386
(% of AGI for various income ranges: 122.6% for AGIs below $25k, 234.9% for AGIs $25k-50k, 296.5% for AGIs $50k-75k, 527.7% for AGIs $75k-100k, 1134.7% for AGIs $100k-200k, 4310.0% for AGIs over 200k)
Taxable individual retirement arrangement distribution: $25,539 (reported on 14.4% of returns)
40205:
$25,539
Kentucky:
$18,941
(% of AGI for various income ranges: 106.8% for AGIs below $25k, 185.8% for AGIs $25k-50k, 385.5% for AGIs $50k-75k, 688.6% for AGIs $75k-100k, 1143.5% for AGIs $100k-200k, 3909.2% for AGIs over 200k)
Self-employed (Keogh) retirement plans: $21,954 (reported on 2.0% of returns)
40205:
$21,954
Kentucky:
$23,933
(% of AGI for various income ranges: 9.2% for AGIs below $25k, 25.6% for AGIs $50k-75k, 97.3% for AGIs $100k-200k, 949.2% for AGIs over 200k)
Total itemized deductions: $34,893 (reported on 15.0% of returns)
Here:
$34,893
State:
$32,473
(% of AGI for various income ranges: 97.1% for AGIs below $25k, 188.6% for AGIs $25k-50k, 440.3% for AGIs $50k-75k, 788.2% for AGIs $75k-100k, 1135.8% for AGIs $100k-200k, 8514.7% for AGIs over 200k)
Charity contributions: $13,650 (reported on 12.9% of returns)
Here:
$13,650
State:
$13,472
(% of AGI for various income ranges: 7.1% for AGIs below $25k, 21.4% for AGIs $25k-50k, 53.1% for AGIs $50k-75k, 121.8% for AGIs $75k-100k, 275.7% for AGIs $100k-200k, 4042.4% for AGIs over 200k)
Taxes paid: $8,502 (reported on 15.0% of returns)
40205:
$8,502
State:
$7,830
(% of AGI for various income ranges: 14.7% for AGIs below $25k, 38.3% for AGIs $25k-50k, 124.7% for AGIs $50k-75k, 269.7% for AGIs $75k-100k, 386.8% for AGIs $100k-200k, 1560.3% for AGIs over 200k)
Earned income credit: $1,389 (reported on 6.1% of returns)
Here:
$1,389
State:
$2,336
(% of AGI for various income ranges: 36.9% for AGIs below $25k, 23.4% for AGIs $25k-50k)
Percentage of individuals using paid preparers for their 2020 taxes: 91.6%
Here:
92%
State:
94%
(% for various income ranges: 88.7% for AGIs below $25k, 91.7% for AGIs $25k-50k, 92.0% for AGIs $50k-75k, 91.1% for AGIs $75k-100k, 92.5% for AGIs $100k-200k, 95.7% for AGIs over 200k)
Averages for the 2012 tax year for zip code 40205, filed in 2013:
Average Adjusted Gross Income (AGI) in 2012: $90,862 (Individual Income Tax Returns)
Here:
$90,862
State:
$50,814
Salary/wage: $66,975 (reported on 81.5% of returns)
Here:
$66,975
State:
$42,723
(% of AGI for various income ranges: 72.1% for AGIs below $25k, 75.7% for AGIs $25k-50k, 70.5% for AGIs $50k-75k, 68.8% for AGIs $75k-100k, 72.3% for AGIs $100k-200k, 43.3% for AGIs over 200k)
Taxable interest for individuals: $2,542 (reported on 46.0% of returns)
This zip code:
$2,542
Kentucky:
$1,381
(% of AGI for various income ranges: 2.1% for AGIs below $25k, 1.0% for AGIs $25k-50k, 1.0% for AGIs $50k-75k, 0.9% for AGIs $75k-100k, 0.8% for AGIs $100k-200k, 1.7% for AGIs over 200k)
Ordinary dividends: $10,501 (reported on 37.8% of returns)
Here:
$10,501
State:
$6,239
(% of AGI for various income ranges: 4.2% for AGIs below $25k, 2.4% for AGIs $25k-50k, 3.1% for AGIs $50k-75k, 2.9% for AGIs $75k-100k, 3.1% for AGIs $100k-200k, 6.2% for AGIs over 200k)
Net capital gain/loss in AGI: +$15,312 (reported on 29.0% of returns)
Here:
+$15,312
State:
+$11,336
(% of AGI for various income ranges: 0.4% for AGIs $25k-50k, 0.7% for AGIs $50k-75k, 1.1% for AGIs $75k-100k, 1.7% for AGIs $100k-200k, 10.3% for AGIs over 200k)
Profit/loss from business: +$20,101 (reported on 18.8% of returns)
Here:
+$20,101
State:
+$10,862
(% of AGI for various income ranges: 7.7% for AGIs below $25k, 4.1% for AGIs $25k-50k, 4.0% for AGIs $50k-75k, 4.4% for AGIs $75k-100k, 4.0% for AGIs $100k-200k, 3.9% for AGIs over 200k)
Taxable individual retirement arrangement distribution: $21,731 (reported on 14.2% of returns)
40205:
$21,731
Kentucky:
$14,296
(% of AGI for various income ranges: 5.3% for AGIs below $25k, 2.9% for AGIs $25k-50k, 3.0% for AGIs $50k-75k, 3.7% for AGIs $75k-100k, 3.3% for AGIs $100k-200k, 3.4% for AGIs over 200k)
Self-employment retirement plans: $20,860 (reported on 2.1% of returns)
40205:
$20,860
Kentucky:
$20,768
(% of AGI for various income ranges: 0.4% for AGIs $50k-75k, 0.5% for AGIs $100k-200k, 0.7% for AGIs over 200k)
Total itemized deductions: $25,728 (17% of AGI, reported on 50.1% of returns)
Here:
$25,728
State:
$21,160
Here:
17.2% of AGI
State:
20.0% of AGI
(% of AGI for various income ranges: 15.4% for AGIs below $25k, 13.1% for AGIs $25k-50k, 15.8% for AGIs $50k-75k, 16.5% for AGIs $75k-100k, 16.1% for AGIs $100k-200k, 12.1% for AGIs over 200k)
Charity contributions: $4,620 (reported on 44.6% of returns)
Here:
$4,620
State:
$4,303
(% of AGI for various income ranges: 1.4% for AGIs below $25k, 1.5% for AGIs $25k-50k, 1.7% for AGIs $50k-75k, 2.0% for AGIs $75k-100k, 2.5% for AGIs $100k-200k, 2.6% for AGIs over 200k)
Taxes paid: $12,433 (reported on 49.9% of returns)
40205:
$12,433
State:
$8,496
(% of AGI for various income ranges: 3.0% for AGIs below $25k, 3.9% for AGIs $25k-50k, 6.1% for AGIs $50k-75k, 7.0% for AGIs $75k-100k, 8.2% for AGIs $100k-200k, 7.0% for AGIs over 200k)
Earned income credit: $1,264 (reported on 7.6% of returns)
Here:
$1,264
State:
$2,273
(% of AGI for various income ranges: 2.1% for AGIs below $25k, 0.3% for AGIs $25k-50k)
Percentage of individuals using paid preparers for their 2012 taxes: 51.2%
Here:
51%
State:
60%
(% for various income ranges: 42.7% for AGIs below $25k, 43.5% for AGIs $25k-50k, 52.0% for AGIs $50k-75k, 55.7% for AGIs $75k-100k, 60.7% for AGIs $100k-200k, 77.0% for AGIs over 200k)
Averages for the 2004 tax year for zip code 40205, filed in 2005:
Average Adjusted Gross Income (AGI) in 2004: $65,758 (Individual Income Tax Returns)
Here:
$65,758
State:
$41,540
Salary/wage: $53,705 (reported on 80.6% of returns)
Here:
$53,705
State:
$36,432
(% of AGI for various income ranges: 650.3% for AGIs below $10k, 70.0% for AGIs $10k-25k, 73.3% for AGIs $25k-50k, 74.3% for AGIs $50k-75k, 74.8% for AGIs $75k-100k, 57.9% for AGIs over 100k)
Taxable interest for individuals: $2,440 (reported on 58.5% of returns)
This zip code:
$2,440
Kentucky:
$1,571
(% of AGI for various income ranges: 70.6% for AGIs below $10k, 4.0% for AGIs $10k-25k, 2.6% for AGIs $25k-50k, 2.1% for AGIs $50k-75k, 1.8% for AGIs $75k-100k, 1.8% for AGIs over 100k)
Taxable dividends: $5,065 (reported on 43.3% of returns)
Here:
$5,065
State:
$3,453
(% of AGI for various income ranges: 73.8% for AGIs below $10k, 3.8% for AGIs $10k-25k, 3.1% for AGIs $25k-50k, 2.7% for AGIs $50k-75k, 2.3% for AGIs $75k-100k, 3.5% for AGIs over 100k)
Net capital gain/loss: +$12,055 (reported on 34.7% of returns)
Here:
+$12,055
State:
+$9,663
(% of AGI for various income ranges: 10.1% for AGIs below $10k, 1.1% for AGIs $10k-25k, 1.5% for AGIs $25k-50k, 1.4% for AGIs $50k-75k, 1.8% for AGIs $75k-100k, 10.1% for AGIs over 100k)
Profit/loss from business: +$18,296 (reported on 18.0% of returns)
Here:
+$18,296
State:
+$9,233
(% of AGI for various income ranges: 59.6% for AGIs below $10k, 5.2% for AGIs $10k-25k, 3.5% for AGIs $25k-50k, 4.5% for AGIs $50k-75k, 4.7% for AGIs $75k-100k, 5.4% for AGIs over 100k)
IRA payment deduction: $3,270 (reported on 3.2% of returns)
40205:
$3,270
Kentucky:
$2,955
(% of AGI for various income ranges: 0.3% for AGIs $10k-25k, 0.4% for AGIs $25k-50k, 0.2% for AGIs $50k-75k, 0.2% for AGIs $75k-100k, 0.1% for AGIs over 100k)
Self-employed pension: $15,373 (reported on 2.6% of returns)
Here:
$15,373
Kentucky:
$14,996
(% of AGI for various income ranges: 3.0% for AGIs below $10k, 0.1% for AGIs $25k-50k, 0.2% for AGIs $50k-75k, 0.3% for AGIs $75k-100k, 0.9% for AGIs over 100k)
Total itemized deductions: $20,599 (19% of AGI, reported on 51.7% of returns)
Here:
$20,599
State:
$17,474
Here:
19.3% of AGI
State:
21.0% of AGI
(% of AGI for various income ranges: 159.6% for AGIs below $10k, 15.7% for AGIs $10k-25k, 16.0% for AGIs $25k-50k, 19.2% for AGIs $50k-75k, 19.0% for AGIs $75k-100k, 14.5% for AGIs over 100k)
Charity contributions deductions: $3,926 (4% of AGI, reported on 48.2% of returns)
Here:
$3,926
State:
$3,494
Here:
3.5% of AGI
State:
4.0% of AGI
(% of AGI for various income ranges: 10.8% for AGIs below $10k, 2.0% for AGIs $10k-25k, 2.3% for AGIs $25k-50k, 2.7% for AGIs $50k-75k, 3.0% for AGIs $75k-100k, 3.1% for AGIs over 100k)
Total tax: $11,961 (reported on 83.5% of returns)
40205:
$11,961
State:
$6,162
(% of AGI for various income ranges: 22.4% for AGIs below $10k, 5.1% for AGIs $10k-25k, 8.3% for AGIs $25k-50k, 10.2% for AGIs $50k-75k, 11.0% for AGIs $75k-100k, 19.7% for AGIs over 100k)
Earned income credit: $1,058 (reported on 6.0% of returns)
Here:
$1,058
State:
$1,723
Percentage of individuals using paid preparers for their 2004 taxes: 54.9%
Here:
55%
State:
66%
(% for various income ranges: 48.3% for AGIs below $10k, 49.4% for AGIs $10k-25k, 53.1% for AGIs $25k-50k, 57.9% for AGIs $50k-75k, 56.6% for AGIs $75k-100k, 67.0% for AGIs over 100k)
Likely homosexual households (counted as self-reported same-sex unmarried-partner households)
Lesbian couples: 0.3% of all households
Gay men: 0.3% of all households
Household received Food Stamps/SNAP in the past 12 months: 286 Household did not receive Food Stamps/SNAP in the past 12 months: 10,573
Women who had a birth in the past 12 months: 215 (209 now married, 1 unmarried) Women who did not have a birth in the past 12 months: 5,508 (2,474 now married, 3,033 unmarried)
Housing units in zip code 40205 with a mortgage: 5,344 (729 second mortgage, 10 home equity loan, 673 both second mortgage and home equity loan) Houses without a mortgage: 367
Median monthly owner costs for units with a mortgage: $1,924 Median monthly owner costs for units without a mortgage: $718
Residents with income below the poverty level in 2022:
This zip code:
6.2%
Whole state:
16.5%
Residents with income below 50% of the poverty level in 2022:
This zip code:
1.9%
Whole state:
9.0%
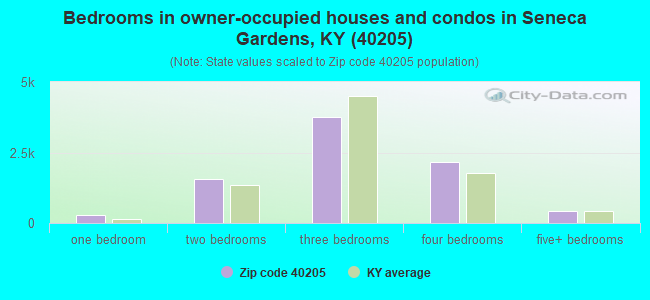
Median number of rooms in houses and condos:
Here:
7.2
State:
6.4
Median number of rooms in apartments:
Here:
4.4
State:
4.4
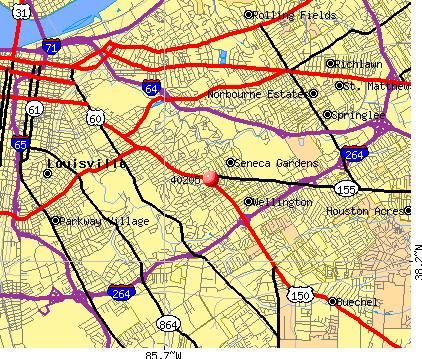
Notable locations in this zip code not listed on our city pages
Notable locations in zip code 40205: Big Spring Country Club (A), Louisville Fire Department Quint 10 (B), Louisville Fire Department Engine 20 (C), Sullivan College Library (D). Display/hide their locations on the map
Churches in zip code 40205 include: Louisville First Seventh Day Adventist Church (A), Strathmoor Presbyterian Church (B), Sisters of Charity of Nazareth (C), Saint Raphaels Church (D), Saint Paul United Methodist Church (E), Saint Francis of Assisi Church (F), Saint Agnes Church (G), Redeemer Church (H), Vineyard Christian Church (I). Display/hide their locations on the map
4,025 married couples with children.
740 single-parent households (93 men, 647 women).
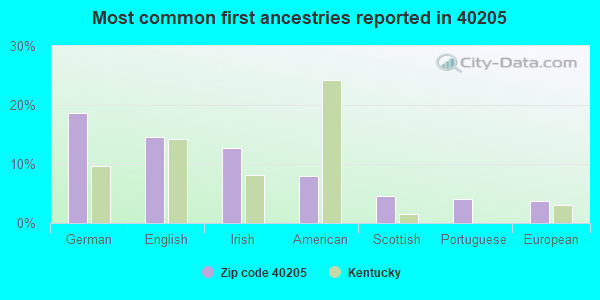
97.1% of residents of 40205 zip code speak English at home.
0.6% of residents speak Spanish at home (67% very well, 24% well, 7% not well, 1% not at all).
1.8% of residents speak other Indo-European language at home (67% very well, 9% well, 10% not well, 14% not at all).
0.5% of residents speak Asian or Pacific Island language at home (78% very well, 20% well, 2% not well).
0.1% of residents speak other language at home (41% very well, 59% not at all).
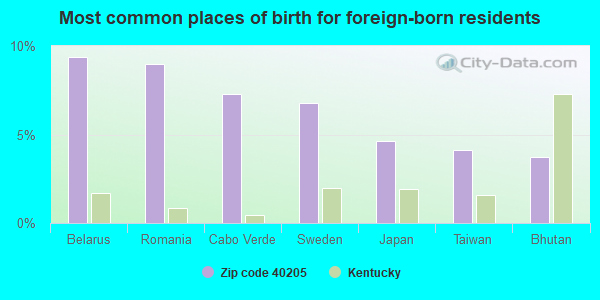
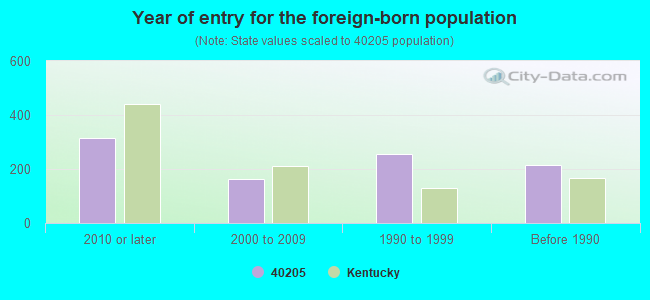
Foreign born population: 767 (3.1%) (67.3% of them are naturalized citizens)
Major facilities with environmental interests located in this zip code:
CARITAS PEACE ACADEMY SCHOOL (2020 NEWBURG RD in LOUISVILLE, KY)
(National Center for Education Statistics) - STATE ID-056275784 (Resource Conservation and Recovery Act (tracking hazardous waste)) Organizations: CARITAS HEALTH SERVICES INC (CONTACT/OWNER)
, JEFFERSON COUNTY (SCHOOL DISTRICT)
Alternative names: CARITAS PEACE CENTER
ATHERTON HIGH SCHOOL (3000 DUNDEE ROAD in LOUISVILLE, KY)
(Geographic Names Information System) (National Center for Education Statistics) - STATE ID-056275018 Organizations: JEFFERSON COUNTY (SCHOOL DISTRICT)
ADATH JESHURUN SYNAGOGUE (2401 WOODBOURNE AVE in LOUISVILLE, KY)
(Integrated Compliance Information System) - ICIS-04-1986-0064, FORMAL ENFORCEMENT ACTION Business SIC classification: CHILD DAY CARE SERVICES
CHRISTIAN ACAD OF LOUISVILLE (700 ENGLISH STATION ROAD in LOUISVILLE, KY)
COMPLIANCE ACTIVITY (Tracking inspections of insecticide, fungicide, and rodenticide, and toxic substances) National Pollutant Discharge Elimination System NON-MAJOR (Tracking pollutant discharge elimination systems) - permit Business SIC classification: MANAGEMENT SERVICES
CITY OF LOUISVILLE (601 WEST JEFFERSON STREET in LOUISVILLE, KY)
National Pollutant Discharge Elimination System NON-MAJOR (Tracking pollutant discharge elimination systems) - permit Business SIC classification: REPAIR SHOPS AND RELATED SERVICES
A S F #73 (HANGAR #7 BOWMAN FIELD in LOUISVILLE, KY)
BOWMAN FIELD REGIONAL AIRPORT (2815 TAYLORSVILLE RD ADM BLDG in LOUISVILLE, KY)
National Pollutant Discharge Elimination System NON-MAJOR (Tracking pollutant discharge elimination systems) - permit Business SIC classification: AIRPORTS, FLYING FIELDS, AND AIRPORT TERMINAL SERVICES
BP OIL COMPANY (1735 NEWBURG ROAD in LOUISVILLE, KY)
(Resource Conservation and Recovery Act (tracking hazardous waste)) Organizations: KIEL BROS. OIL COMPANY (CONTACT/OWNER)
OLD FAIRGROUND WOODS SECTION 3 (5400 FERN BROOK LN in LOUISVILLE, KY)
National Pollutant Discharge Elimination System NON-MAJOR (Tracking pollutant discharge elimination systems) - permit Business SIC classification: HIGHWAY AND STREET CONSTRUCTION, EXCEPT ELEVATED HIGHWAYS
FIRST DISTRICT POLICE DEPT. (2301 DOUGLASS BLVD. in LOUISVILLE, KY)
(Resource Conservation and Recovery Act (tracking hazardous waste)) Organizations: CITY OF LOUISVILLE (CONTACT/OWNER)
LOUISVILLE MENNONITE FELLOWSHIP (1767 BARDSTOWN ROAD in LOUISVILLE, KY)
(Resource Conservation and Recovery Act (tracking hazardous waste))
LOUISVILLE SEMINARY, THE (1044 ALTA VISTA RD in LOUISVILLE, KY)
(Resource Conservation and Recovery Act (tracking hazardous waste))
COATS ENGRAVING CO., INC. (2214 DUNDEE ROAD in LOUISVILLE, KY)
Conditionally Exempt Small Quantity Generators, less than 100 kg/month of hazardous waste (Resource Conservation and Recovery Act (tracking hazardous waste)) - notification Organizations: GREGORY B. COATS (CONTACT/OWNER)
Housing units lacking complete plumbing facilities: 0.6% Housing units lacking complete kitchen facilities: 0.5%
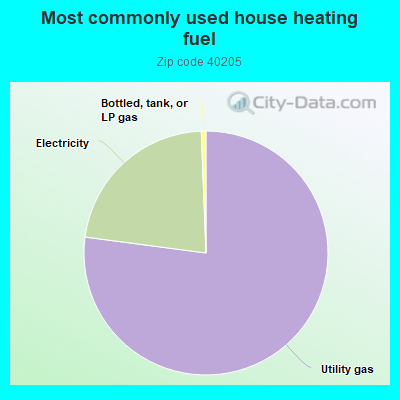
76.4%Utility gas
22.1%Electricity
0.6%Bottled, tank, or LP gas
Population in 1990: 24,979.
Place of birth for U.S.-born residents:
This state: 15,295
Northeast: 1,264
Midwest: 4,406
South: 2,228
West: 882
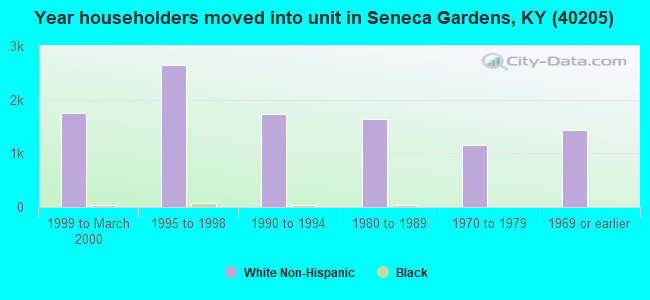
60% of the 40205 zip code residents lived in the same house 5 years ago. Out of people who lived in different houses, 64% lived in this county. Out of people who lived in different counties, 50% lived in Kentucky.
90% of the 40205 zip code residents lived in the same house 1 year ago. Out of people who lived in different houses, 64% moved from this county. Out of people who lived in different houses, 8% moved from different county within same state. Out of people who lived in different houses, 27% moved from different state. Out of people who lived in different houses, 1% moved from abroad.
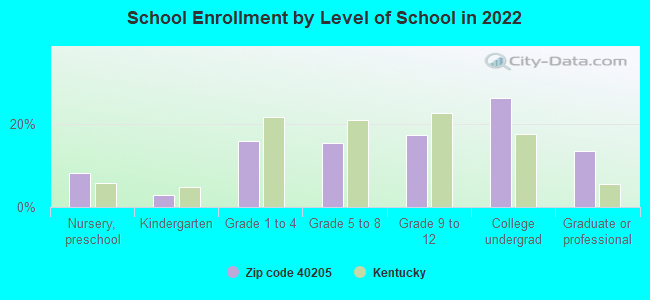
Private vs. public school enrollment:
Students in private schools in grades 1 to 8 (elementary and middle school): 1,041
Here:
46.3%
Kentucky:
17.2%
Students in private schools in grades 9 to 12 (high school): 389
Here:
32.6%
Kentucky:
15.2%
Students in private undergraduate colleges: 1,022
Here:
56.5%
Kentucky:
19.6%
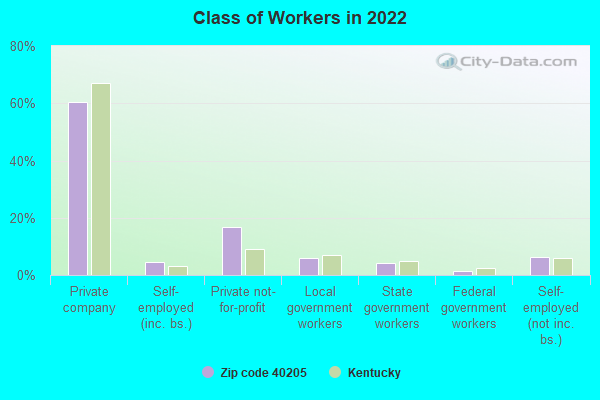
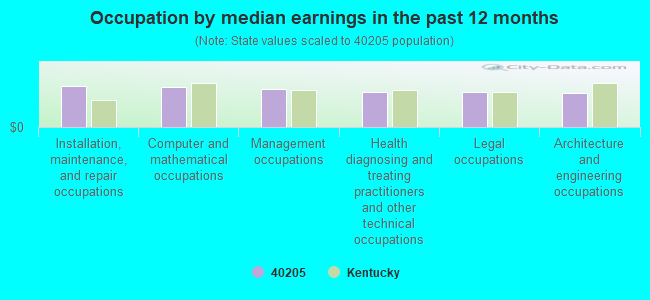
Occupation by median earnings in the past 12 months ($)
99,941Installation, maintenance, and repair occupations
98,404Computer and mathematical occupations
93,357Management occupations
85,211Health diagnosing and treating practitioners and other technical occupations
84,211Legal occupations
83,110Architecture and engineering occupations
Companies with federal contracts located in this zip code (LOUISVILLE, KY):
LOUISVILLE RELOCATION SERVICE, (2525 BARDSTOWN RD, STE-202; small business)
$397,120 with Army for Miscellaneous Items. Signed on 2003-02-06. Completion date: 2004-02-05.
SPALDING COMPANIES (1554 BARDSTOWN RD; small business) : $218,689 in 15 contractsfrom 2000 to 2006
Contracts for Miscellaneous Items, Clothing, Special Purpose, Signs, Advertising Displays, and Identification Plates, Outerwear, Men's, and moreby Army Signed by year:2000: $111,565; 2001: $0; 2002: $10,900; 2003: $0; 2004: $16,037; 2005: $52,141; 2006: $28,046.
Biggest contracts:
$71,565 with Army for Miscellaneous Items. Signed on 2000-09-28. Completion date: 2000-11-30.
$40,000, same as above.Signed on 2000-05-02. Completion date: 2000-07-28.
$26,516 with Army for Clothing, Special Purpose. Signed on 2006-03-15. Completion date: 2006-04-30.
$23,496 with Army for Signs, Advertising Displays, and Identification Plates. Signed on 2005-03-24. Completion date: 2005-05-20.
AIRGO INDUSTRIES, INC (2221 HAWTHORNE AVE; small business) : $218,490 in 5 contractsfrom 2003 to 2005
Contracts for Specialized Shipping and Storage Containers, Material Handling Equipment, Nonself-Propelled by Defense Logistics Agency, Army Signed by year:2000: $0; 2001: $0; 2002: $0; 2003: $2,800; 2004: $0; 2005: $215,690; 2006: $0.
Biggest contracts:
$99,950 with Defense Logistics Agency for Specialized Shipping and Storage Containers. Signed on 2005-10-20. Completion date: 2005-12-20.
$99,840, same as above.Signed on 2005-10-20. Completion date: 2005-12-20.
$7,950, same as above.Signed on 2005-03-29. Completion date: 2005-05-29.
$7,950, same as above.Signed on 2005-06-15. Completion date: 2005-08-15.
BELLARMINE UNIVERSITY (2001 NEWBURG ROAD) : $91,870 in 4 contractsfrom 2002 to 2005
$38,640 with Air Force for Tuition, Registration, and Membership Fees. Signed on 2003-06-03. Completion date: 2003-06-03.
$38,230, same as above.Signed on 2002-01-24. Completion date: 2002-09-30.
$7,500, same as above.Signed on 2005-08-25. Completion date: 2004-09-30.
$7,500, same as above.Signed on 2004-12-08. Completion date: 2005-09-30.
THE TALENT GROUP INC (1813 TYLER LANE; small business) : $51,860 in 2 contractsin 2001
$46,725 with Army for Other Professional Services. Taking place in VA. Signed on 2001-06-22. Completion date: 2002-06-21.
$5,135 with Army for Personal Services Contracts. Signed on 2001-12-12. Completion date: 2002-09-30.
JEWISH COMMUNITY CENTER OF LOU (3600 DUTCHMANS LANE) : $32,108 in 3 contractsfrom 2004 to 2005
$17,160 with Army for Recreational Services. Signed on 2005-12-28. Completion date: 2006-12-31.
$13,520, same as above.Signed on 2004-12-10. Completion date: 2005-12-14.
$1,428, same as above.Signed on 2005-03-08. Completion date: 2005-12-14.
CHABAD OF KENTUCKY INC (3700 DUTCHMANS LN) : $15,600 in 9 contractsfrom 2002 to 2004
Contracts for Chaplain Services by Army Signed by year:2000: $0; 2001: $0; 2002: $14,240; 2003: $4,160; 2004: -$2,800; 2005: $0; 2006: $0.
Biggest contracts:
$6,160 with Army for Chaplain Services. Signed on 2003-10-14. Completion date: 2004-09-30.
$5,760, same as above.Signed on 2002-10-03. Completion date: 2003-09-30.
$5,760, same as above.Signed on 2002-10-03. Completion date: 2003-09-30.
$5,760, same as above.Signed on 2002-01-10. Completion date: 2002-09-30.
DREXLER, TOM PLUMBING, INC (2232 BARDSTOWN RD; small business)
$6,625 with Army for Facilities Operations Support Services. Signed on 2003-07-28. Completion date: 2003-07-31.
SULLIVAN COLLEGES SYSTEM, INC (3101 BARDSTOWN RD) : $4,830 in 2 contractsfrom 2002 to 2003
$5,465 with Army for Educational Services. Signed on 2002-06-21. Completion date: 2003-03-31.
-$635, same as above.Signed on 2003-02-11. Completion date: 2003-03-31.
COM 1 CELLULAR & PAGING (1556 BARSTOWN RD; small business) : $180 in 4 contractsfrom 2002 to 2003
$360 with Public Buildings Service for Miscellaneous Communication Equipment. Signed on 2002-10-15. Completion date: 2003-09-15.
$0, same as above.Signed on 2003-03-15. Completion date: 2003-09-15.
-$60 with Public Buildings Service for Telephone and/or Communications Services (includes Telegraph, Telex, and Cablevision Services). Signed on 2003-06-15. Completion date: 2003-09-15.
-$120 with Public Buildings Service for Miscellaneous Communication Equipment. Signed on 2003-03-15. Completion date: 2003-09-15.
Top industries in this zip code by the number of employees in 2005:
Health Care and Social Assistance: Offices of Physicians (except Mental Health Specialists) (100-249: 1, 50-99: 1, 20-49: 4, 10-19: 5, 5-9: 6, 1-4: 10)
Health Care and Social Assistance: Home Health Care Services (250-499: 1, 10-19: 1, 5-9: 2)
2002 - 2018 National Fire Incident Reporting System (NFIRS) incidents
According to the data from the years 2002 - 2018 the average number of fire incidents per year is 46. The highest number of reported fires - 73 took place in 2010, and the least - 11 in 2002. The data has an increasing trend.
When looking into fire subcategories, the most reports belonged to: Outside Fires (38.1%), and Structure Fires (30.7%).
Fire incident types reported to NFIRS in Zip Code 40205
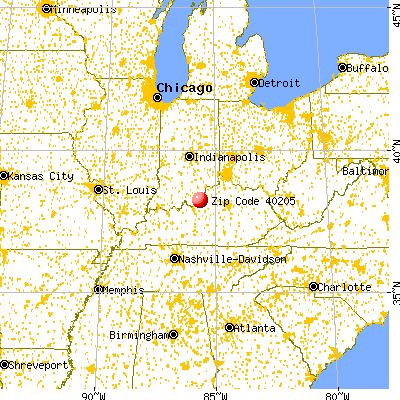


 Nearest zip codes: 40280, 40231, 40041, 40204, 40206, 40218.


 According to the data from the years 2002 - 2018 the average number of fire incidents per year is 46. The highest number of reported fires - 73 took place in 2010, and the least - 11 in 2002. The data has an increasing trend.
 When looking into fire subcategories, the most reports belonged to: Outside Fires (38.1%), and Structure Fires (30.7%).