Estimated zip code population in 2022: 33,548 Zip code population in 2010: 31,658 Zip code population in 2000: 29,094
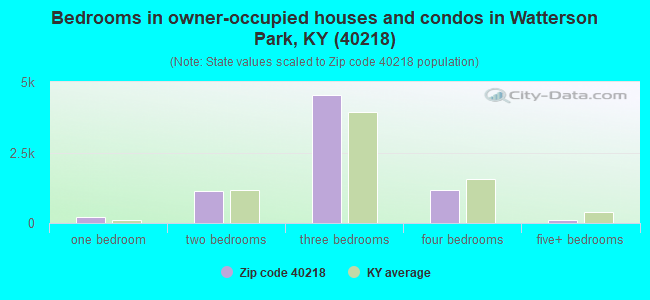
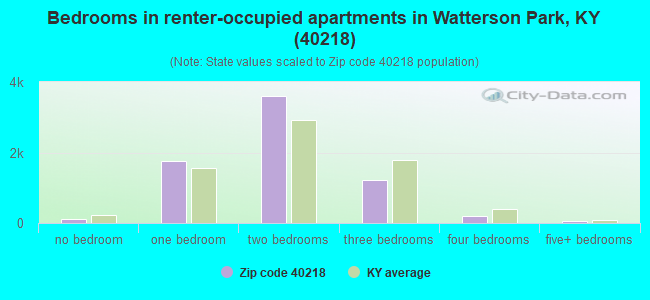
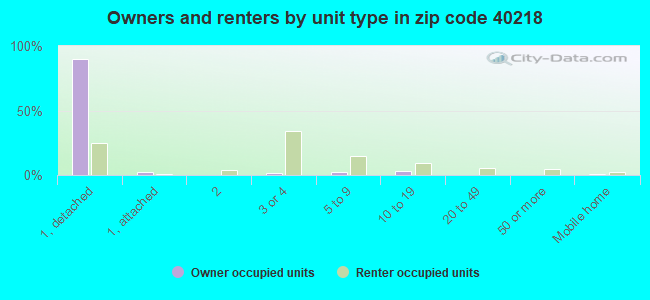
Houses and condos: 14,776 Renter-occupied apartments: 6,905
% of renters here:
49%
State:
31%
March 2022 cost of living index in zip code 40218: 88.4 (less than average, U.S. average is 100)
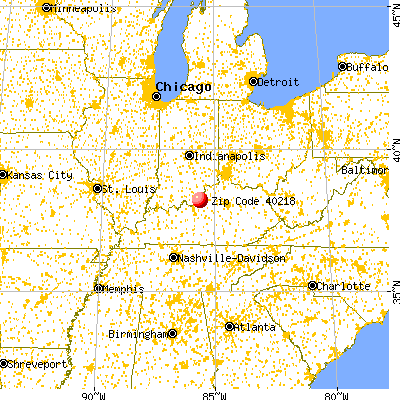
Land area: 9.7 sq. mi. Water area: 0.1 sq. mi.
Population density: 3,447 people per square mile
(average).
OSM Map
General Map
Google Map
MSN Map
OSM Map
General Map
Google Map
MSN Map
OSM Map
General Map
Google Map
MSN Map
OSM Map
General Map
Google Map
MSN Map
Please wait while loading the map...
Real estate property taxes paid for housing units in 2022:
This zip code:
0.8% ($1,598)
Kentucky:
0.7% ($1,456)
Median real estate property taxes paid for housing units with mortgages in 2022: $1,635 (0.8%) Median real estate property taxes paid for housing units with no mortgage in 2022: $1,464 (0.8%)
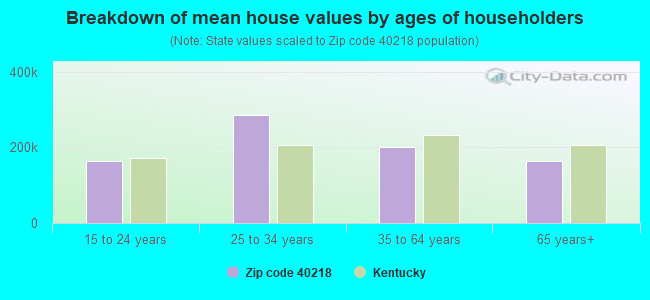
Estimated median house/condo value in 2022: $194,193
40218:
$194,193
Kentucky:
$196,300
According to our research of Kentucky and other state lists, there were 52 registered sex offenders living in 40218 zip code as of April 27, 2024. The ratio of all residents to sex offenders in zip code 40218 is 618 to 1. The ratio of registered sex offenders to all residents in this zip code is lower than the state average.
Median resident age:
This zip code:
35.0 years
Kentucky median age:
39.4 years
Average household size:
This zip code:
2.3 people
Kentucky:
2.4 people
Averages for the 2020 tax year for zip code 40218, filed in 2021:
Average Adjusted Gross Income (AGI) in 2020: $39,759 (Individual Income Tax Returns)
Here:
$39,759
State:
$61,342
Salary/wage: $36,520 (reported on 86.3% of returns)
Here:
$36,520
State:
$50,827
(% of AGI for various income ranges: 1251.2% for AGIs below $25k, 3740.1% for AGIs $25k-50k, 6740.0% for AGIs $50k-75k, 9722.0% for AGIs $75k-100k, 16773.8% for AGIs $100k-200k)
Taxable interest for individuals: $603 (reported on 12.5% of returns)
This zip code:
$603
Kentucky:
$1,441
(% of AGI for various income ranges: 3.9% for AGIs below $25k, 5.0% for AGIs $25k-50k, 13.7% for AGIs $50k-75k, 21.5% for AGIs $75k-100k, 59.2% for AGIs $100k-200k)
Ordinary dividends: $3,124 (reported on 8.2% of returns)
Here:
$3,124
State:
$7,388
(% of AGI for various income ranges: 9.5% for AGIs below $25k, 12.0% for AGIs $25k-50k, 52.3% for AGIs $50k-75k, 105.6% for AGIs $75k-100k, 195.8% for AGIs $100k-200k)
Net capital gain/loss in AGI: +$5,123 (reported on 6.9% of returns)
Here:
+$5,123
State:
+$19,475
(% of AGI for various income ranges: 3.2% for AGIs below $25k, 10.1% for AGIs $25k-50k, 42.3% for AGIs $50k-75k, 73.2% for AGIs $75k-100k, 440.2% for AGIs $100k-200k)
Profit/loss from business: +$5,828 (reported on 15.6% of returns)
Here:
+$5,828
State:
+$11,386
(% of AGI for various income ranges: 78.2% for AGIs below $25k, 93.9% for AGIs $25k-50k, 162.2% for AGIs $50k-75k, 276.4% for AGIs $75k-100k, 375.6% for AGIs $100k-200k)
Taxable individual retirement arrangement distribution: $12,649 (reported on 4.5% of returns)
40218:
$12,649
Kentucky:
$18,941
(% of AGI for various income ranges: 25.1% for AGIs below $25k, 38.6% for AGIs $25k-50k, 92.0% for AGIs $50k-75k, 193.9% for AGIs $75k-100k, 642.0% for AGIs $100k-200k)
Total itemized deductions: $22,973 (reported on 4.5% of returns)
Here:
$22,973
State:
$32,473
(% of AGI for various income ranges: 19.6% for AGIs below $25k, 83.3% for AGIs $25k-50k, 247.0% for AGIs $50k-75k, 397.4% for AGIs $75k-100k, 797.2% for AGIs $100k-200k)
Charity contributions: $7,988 (reported on 3.3% of returns)
Here:
$7,988
State:
$13,472
(% of AGI for various income ranges: 19.9% for AGIs $25k-50k, 57.0% for AGIs $50k-75k, 99.1% for AGIs $75k-100k, 247.8% for AGIs $100k-200k)
Taxes paid: $6,109 (reported on 4.4% of returns)
40218:
$6,109
State:
$7,830
(% of AGI for various income ranges: 2.4% for AGIs below $25k, 13.9% for AGIs $25k-50k, 65.3% for AGIs $50k-75k, 137.4% for AGIs $75k-100k, 265.6% for AGIs $100k-200k)
Earned income credit: $2,348 (reported on 25.5% of returns)
Here:
$2,348
State:
$2,336
(% of AGI for various income ranges: 120.8% for AGIs below $25k, 79.3% for AGIs $25k-50k, 1.7% for AGIs $50k-75k)
Percentage of individuals using paid preparers for their 2020 taxes: 94.3%
Here:
94%
State:
94%
(% for various income ranges: 94.0% for AGIs below $25k, 95.0% for AGIs $25k-50k, 94.7% for AGIs $50k-75k, 93.7% for AGIs $75k-100k, 93.0% for AGIs $100k-200k, 85.7% for AGIs over 200k)
Averages for the 2012 tax year for zip code 40218, filed in 2013:
Average Adjusted Gross Income (AGI) in 2012: $34,395 (Individual Income Tax Returns)
Here:
$34,395
State:
$50,814
Salary/wage: $30,892 (reported on 88.3% of returns)
Here:
$30,892
State:
$42,723
(% of AGI for various income ranges: 81.0% for AGIs below $25k, 84.9% for AGIs $25k-50k, 78.8% for AGIs $50k-75k, 79.6% for AGIs $75k-100k, 77.0% for AGIs $100k-200k, 35.1% for AGIs over 200k)
Taxable interest for individuals: $939 (reported on 16.9% of returns)
This zip code:
$939
Kentucky:
$1,381
(% of AGI for various income ranges: 0.5% for AGIs below $25k, 0.3% for AGIs $25k-50k, 0.5% for AGIs $50k-75k, 0.5% for AGIs $75k-100k, 0.6% for AGIs $100k-200k, 0.3% for AGIs over 200k)
Ordinary dividends: $2,895 (reported on 10.1% of returns)
Here:
$2,895
State:
$6,239
(% of AGI for various income ranges: 0.8% for AGIs below $25k, 0.5% for AGIs $25k-50k, 1.0% for AGIs $50k-75k, 0.8% for AGIs $75k-100k, 1.7% for AGIs $100k-200k)
Net capital gain/loss in AGI: +$2,397 (reported on 6.3% of returns)
Here:
+$2,397
State:
+$11,336
(% of AGI for various income ranges: 0.4% for AGIs $50k-75k, 0.7% for AGIs $75k-100k, 1.8% for AGIs $100k-200k)
Profit/loss from business: +$7,142 (reported on 11.1% of returns)
Here:
+$7,142
State:
+$10,862
(% of AGI for various income ranges: 5.1% for AGIs below $25k, 1.8% for AGIs $25k-50k, 1.4% for AGIs $50k-75k, 1.4% for AGIs $75k-100k, 2.3% for AGIs $100k-200k)
Taxable individual retirement arrangement distribution: $10,492 (reported on 6.4% of returns)
40218:
$10,492
Kentucky:
$14,296
(% of AGI for various income ranges: 1.6% for AGIs below $25k, 1.5% for AGIs $25k-50k, 1.9% for AGIs $50k-75k, 2.5% for AGIs $75k-100k, 3.5% for AGIs $100k-200k)
Total itemized deductions: $15,514 (24% of AGI, reported on 24.6% of returns)
Here:
$15,514
State:
$21,160
Here:
24.0% of AGI
State:
20.0% of AGI
(% of AGI for various income ranges: 5.7% for AGIs below $25k, 9.4% for AGIs $25k-50k, 14.1% for AGIs $50k-75k, 14.3% for AGIs $75k-100k, 15.6% for AGIs $100k-200k, 7.9% for AGIs over 200k)
Charity contributions: $3,097 (reported on 20.1% of returns)
Here:
$3,097
State:
$4,303
(% of AGI for various income ranges: 0.8% for AGIs below $25k, 1.5% for AGIs $25k-50k, 2.1% for AGIs $50k-75k, 2.4% for AGIs $75k-100k, 3.0% for AGIs $100k-200k, 1.4% for AGIs over 200k)
Taxes paid: $5,750 (reported on 24.5% of returns)
40218:
$5,750
State:
$8,496
(% of AGI for various income ranges: 1.2% for AGIs below $25k, 2.8% for AGIs $25k-50k, 5.0% for AGIs $50k-75k, 6.2% for AGIs $75k-100k, 7.3% for AGIs $100k-200k, 5.3% for AGIs over 200k)
Earned income credit: $2,325 (reported on 28.3% of returns)
Here:
$2,325
State:
$2,273
(% of AGI for various income ranges: 8.1% for AGIs below $25k, 1.3% for AGIs $25k-50k)
Percentage of individuals using paid preparers for their 2012 taxes: 49.4%
Here:
49%
State:
60%
(% for various income ranges: 49.5% for AGIs below $25k, 47.7% for AGIs $25k-50k, 50.6% for AGIs $50k-75k, 50.6% for AGIs $75k-100k, 53.3% for AGIs $100k-200k, 75.0% for AGIs over 200k)
Averages for the 2004 tax year for zip code 40218, filed in 2005:
Average Adjusted Gross Income (AGI) in 2004: $31,463 (Individual Income Tax Returns)
Here:
$31,463
State:
$41,540
Salary/wage: $28,711 (reported on 87.9% of returns)
Here:
$28,711
State:
$36,432
(% of AGI for various income ranges: 93.9% for AGIs below $10k, 81.6% for AGIs $10k-25k, 83.4% for AGIs $25k-50k, 81.9% for AGIs $50k-75k, 83.2% for AGIs $75k-100k, 60.9% for AGIs over 100k)
Taxable interest for individuals: $1,465 (reported on 28.3% of returns)
This zip code:
$1,465
Kentucky:
$1,571
(% of AGI for various income ranges: 3.5% for AGIs below $10k, 1.6% for AGIs $10k-25k, 1.1% for AGIs $25k-50k, 1.1% for AGIs $50k-75k, 0.8% for AGIs $75k-100k, 1.9% for AGIs over 100k)
Taxable dividends: $2,171 (reported on 14.8% of returns)
Here:
$2,171
State:
$3,453
(% of AGI for various income ranges: 1.7% for AGIs below $10k, 0.9% for AGIs $10k-25k, 0.7% for AGIs $25k-50k, 1.0% for AGIs $50k-75k, 0.9% for AGIs $75k-100k, 1.8% for AGIs over 100k)
Net capital gain/loss: +$3,014 (reported on 10.2% of returns)
Here:
+$3,014
State:
+$9,663
(% of AGI for various income ranges: -1.1% for AGIs below $10k, 0.2% for AGIs $10k-25k, 0.3% for AGIs $25k-50k, 0.6% for AGIs $50k-75k, 1.2% for AGIs $75k-100k, 4.9% for AGIs over 100k)
Profit/loss from business: +$5,618 (reported on 9.2% of returns)
Here:
+$5,618
State:
+$9,233
(% of AGI for various income ranges: 2.2% for AGIs below $10k, 2.6% for AGIs $10k-25k, 1.2% for AGIs $25k-50k, 1.6% for AGIs $50k-75k, 1.4% for AGIs $75k-100k, 1.5% for AGIs over 100k)
IRA payment deduction: $2,324 (reported on 1.6% of returns)
40218:
$2,324
Kentucky:
$2,955
(% of AGI for various income ranges: 0.1% for AGIs $10k-25k, 0.1% for AGIs $25k-50k, 0.1% for AGIs $50k-75k, 0.1% for AGIs $75k-100k, 0.1% for AGIs over 100k)
Self-employed pension: $5,556 (reported on 0.1% of returns)
Here:
$5,556
Kentucky:
$14,996
Total itemized deductions: $14,083 (25% of AGI, reported on 30.1% of returns)
Here:
$14,083
State:
$17,474
Here:
25.1% of AGI
State:
21.0% of AGI
(% of AGI for various income ranges: 7.9% for AGIs below $10k, 6.6% for AGIs $10k-25k, 12.7% for AGIs $25k-50k, 17.2% for AGIs $50k-75k, 17.8% for AGIs $75k-100k, 15.9% for AGIs over 100k)
Charity contributions deductions: $2,707 (5% of AGI, reported on 27.0% of returns)
Here:
$2,707
State:
$3,494
Here:
4.7% of AGI
State:
4.0% of AGI
(% of AGI for various income ranges: 0.9% for AGIs below $10k, 1.0% for AGIs $10k-25k, 2.1% for AGIs $25k-50k, 3.0% for AGIs $50k-75k, 3.2% for AGIs $75k-100k, 3.2% for AGIs over 100k)
Total tax: $3,639 (reported on 69.5% of returns)
40218:
$3,639
State:
$6,162
(% of AGI for various income ranges: 1.9% for AGIs below $10k, 3.5% for AGIs $10k-25k, 6.8% for AGIs $25k-50k, 9.0% for AGIs $50k-75k, 10.2% for AGIs $75k-100k, 15.6% for AGIs over 100k)
Earned income credit: $1,826 (reported on 24.6% of returns)
Here:
$1,826
State:
$1,723
Percentage of individuals using paid preparers for their 2004 taxes: 56.6%
Here:
57%
State:
66%
(% for various income ranges: 53.1% for AGIs below $10k, 59.6% for AGIs $10k-25k, 55.6% for AGIs $25k-50k, 57.1% for AGIs $50k-75k, 53.7% for AGIs $75k-100k, 59.1% for AGIs over 100k)
Likely homosexual households (counted as self-reported same-sex unmarried-partner households)
Lesbian couples: 0.1% of all households
Gay men: 0.1% of all households
Household received Food Stamps/SNAP in the past 12 months: 1,396 Household did not receive Food Stamps/SNAP in the past 12 months: 12,728
Women who had a birth in the past 12 months: 624 (189 now married, 449 unmarried) Women who did not have a birth in the past 12 months: 7,805 (2,932 now married, 4,859 unmarried)
Housing units in zip code 40218 with a mortgage: 5,015 (377 second mortgage, 260 both second mortgage and home equity loan) Houses without a mortgage: 64
Median monthly owner costs for units with a mortgage: $1,235 Median monthly owner costs for units without a mortgage: $491
Residents with income below the poverty level in 2022:
This zip code:
17.0%
Whole state:
16.5%
Residents with income below 50% of the poverty level in 2022:
This zip code:
10.7%
Whole state:
9.0%
Median number of rooms in houses and condos:
Here:
6.0
State:
6.4
Median number of rooms in apartments:
Here:
4.2
State:
4.4
Notable locations in this zip code not listed on our city pages
Notable locations in zip code 40218: Woodhaven Country Club (A), Camp Taylor Fire Department Station 2 (B), Brooklawn Childrens Home (C), Canaan Family Life Center (D), Louisville Fire Department Engine 8 (E), Buechel Fire Department (F), Saint Pius X Community Center (G), Van Hoose Education Center (H). Display/hide their locations on the map
Churches in zip code 40218 include: First Alliance Church (A), Grace Church (B), Watson Memorial Church (C), Korea Saehan Church of Louisville (D), Kingdom Hall of Jehovahs Witnesses (E), Star Hope Baptist Church (F), Salem United Church (G), Saint Bartholomew Church (H), Powerhouse Louisville Church of God (I). Display/hide their locations on the map
Tourist attractions (not listed on the city page) : Automatic Electronic Games Inc (Amusement & Theme Parks; 3918 Bardstown Road), Imperial Investment CO (Amusement & Theme Parks; 3704 Klondike Lane), All Points Travel of Kentucky Inc (Tours & Charters; 1930 Bishop Lane Suite 112), Visitours Inc (Tours & Charters; 1939 Goldsmith Lane Suite 100).
In group quarters: 479 (-1 institutionalized population)
Size of family households: 3,673 2-persons, 2,347 3-persons, 1,626 4-persons, 633 5-persons, 177 6-persons, 46 7-or-more-persons
Size of nonfamily households: 4,836 1-person, 832 2-persons, 5 3-persons
3,656 married couples with children.
3,971 single-parent households (530 men, 3,441 women).
79.0% of residents of 40218 zip code speak English at home.
11.3% of residents speak Spanish at home (23% very well, 44% well, 12% not well, 22% not at all).
4.8% of residents speak other Indo-European language at home (43% very well, 43% well, 10% not well, 4% not at all).
1.5% of residents speak Asian or Pacific Island language at home (34% very well, 31% well, 35% not well).
4.2% of residents speak other language at home (45% very well, 22% well, 33% not well).
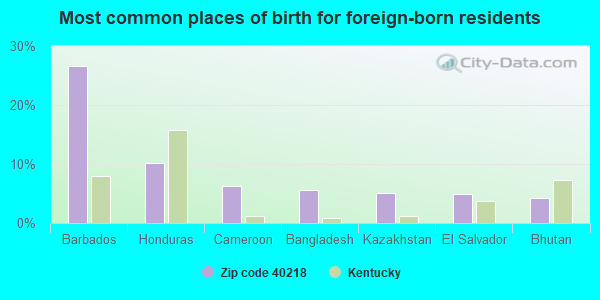
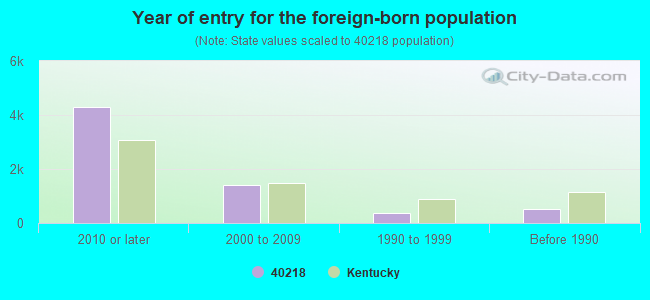
Foreign born population: 6,039 (18.0%) (40.1% of them are naturalized citizens)
Major facilities with environmental interests located in this zip code:
PREMIUM FOIL PRODUCTS INCORPORATED (4500 BISHOP LANE in LOUISVILLE, KY)
AIR SYNTHETIC MINOR (AIRS/AFS) CRITERIA AND HAZARDOUS AIR POLLUTANT INVENTORY (Inventory of air pollution sources) National Pollutant Discharge Elimination System NON-MAJOR (Tracking pollutant discharge elimination systems) - permit HAZARDOUS WASTE BIENNIAL REPORTER (Resource Conservation and Recovery Act (tracking hazardous waste)) (Resource Conservation and Recovery Act (tracking hazardous waste)) Business SIC classification: METAL CANS; METAL STAMPINGS; METAL FOIL AND LEAF Business NAICS classification: ALL OTHER MISCELLANEOUS FABRICATED METAL PRODUCT MANUFACTURING. Organizations: PREMIUM FOIL PRODUCTS CO INC (CONTACT/OWNER)
, PREMIUM FOIL PRODUCTS INC. (CONTACT/OWNER)
LOUISVILLE GAS & ELECTRIC SOU SERV CTR (4664 JENNINGS LANE in LOUISVILLE, KY)
(Integrated Compliance Information System) - ICIS-04-2000-0223, FORMAL ENFORCEMENT ACTION COMPLIANCE ACTIVITY (Tracking inspections of insecticide, fungicide, and rodenticide, and toxic substances) Conditionally Exempt Small Quantity Generators, less than 100 kg/month of hazardous waste (Resource Conservation and Recovery Act (tracking hazardous waste)) - notification TRANSPORTER (Resource Conservation and Recovery Act (tracking hazardous waste)) - notification Business SIC classification: MANAGEMENT SERVICES Organizations: LOUISVILLE GAS AND ELECTRIC CO. (CONTACT/OWNER)
Alternative names: LOUISVILLE GAS & ELECTRIC CO, LOUISVILLE GAS & ELECTRIC SOUTH SERV CTR
BOISE CASCADE CORP (4400 PROGRESS BLVD in LOUISVILLE, KY)
AIR MINOR (AIRS/AFS) COMPLIANCE ACTIVITY (Tracking inspections of insecticide, fungicide, and rodenticide, and toxic substances) (Resource Conservation and Recovery Act (tracking hazardous waste)) Business SIC classification: CORRUGATED AND SOLID FIBER BOXES Business NAICS classification: CORRUGATED AND SOLID FIBER BOX MANUFACTURING. Organizations: WEYERHAEUSER (CONTACT/OWNER)
Alternative names: WILIAMETTE INDUSTRIES, WILLAMETTE INDUSTRIES INC.
LAMINATING SERVICES (4700 ROBARDS LANE in LOUISVILLE, KY)
AIR MINOR (AIRS/AFS) CRITERIA AND HAZARDOUS AIR POLLUTANT INVENTORY (Inventory of air pollution sources) (Resource Conservation and Recovery Act (tracking hazardous waste)) Business SIC classification: PACKAGING PAPER AND PLASTICS FILM, COATED AND LAMINATED Alternative names: LSI WALLCOVERING
BOYS HAVEN ALTERNATIVE SCHOOL (2301 GOLDSMITH LN in LOUISVILLE, KY)
(National Center for Education Statistics) - STATE ID-056275028 Organizations: JEFFERSON COUNTY (SCHOOL DISTRICT)
MYERS MIDDLE SCHOOL (3741 PULLIAM in LOUISVILLE, KY)
(National Center for Education Statistics) - STATE ID-056275159 Organizations: JEFFERSON COUNTY (SCHOOL DISTRICT)
KLONDIKE LANE ELEMENTARY SCHOOL (3807 KLONDIKE LANE in LOUISVILLE, KY)
(National Center for Education Statistics) - STATE ID-056275134 Organizations: JEFFERSON COUNTY (SCHOOL DISTRICT)
BROOKLAWN YOUTH SERVICES ALTERNATIVE SCH (2125 GOLDSMITH LN in LOUISVILLE, KY)
(National Center for Education Statistics) - STATE ID-056275025 Organizations: JEFFERSON COUNTY (SCHOOL DISTRICT)
NEWBURG MIDDLE SCHOOL (4901 EXETER AV. in LOUISVILLE, KY)
(National Center for Education Statistics) - STATE ID-056275041 Organizations: JEFFERSON COUNTY (SCHOOL DISTRICT)
BUECHEL METROPOLITAN HIGH SCHOOL (1960 BASHFORD MANOR LN in LOUISVILLE, KY)
(National Center for Education Statistics) - STATE ID-056275467 Organizations: JEFFERSON COUNTY (SCHOOL DISTRICT)
LAKESHORE PROPERTIES (4500 MASON DIXON LANE in LOUISVILLE, KY)
(Integrated Compliance Information System) - ICIS-04-1998-0424, FORMAL ENFORCEMENT ACTION Business SIC classification: TRUCKING, EXCEPT LOCAL
MO MOORMAN DISTRUBUTOR, INC. (4401 PRODUCE RD in LOUISVILLE, KY)
(Integrated Compliance Information System) - ICIS-04-1998-0182, FORMAL ENFORCEMENT ACTION Business SIC classification: BEER AND ALE
NATIONAL PRINTING INK COMPANY (4825 JENNINGS LANE in LOUISVILLE, KY)
National Pollutant Discharge Elimination System NON-MAJOR (Tracking pollutant discharge elimination systems) - permit Conditionally Exempt Small Quantity Generators, less than 100 kg/month of hazardous waste (Resource Conservation and Recovery Act (tracking hazardous waste)) - notification Business SIC classification: PRINTING INK Organizations: HOSTMANN STEINBERG INC (CONTACT/OWNER)
, MICHAEL HUBER MUNCHEN (CONTACT/OWNER)
Alternative names: HOSTMANN STEINBERG INC
Housing units lacking complete plumbing facilities: 0.1% Housing units lacking complete kitchen facilities: 0.8%
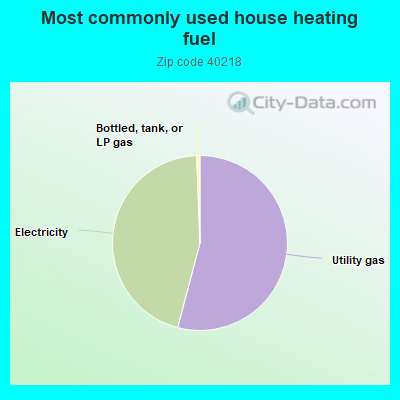
53.7%Utility gas
44.9%Electricity
0.6%Bottled, tank, or LP gas
Population in 1990: 31,434.
Place of birth for U.S.-born residents:
This state: 19,910
Northeast: 822
Midwest: 3,253
South: 2,510
West: 597
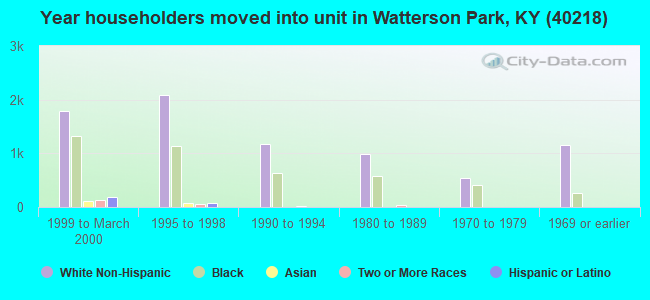
50% of the 40218 zip code residents lived in the same house 5 years ago. Out of people who lived in different houses, 71% lived in this county. Out of people who lived in different counties, 50% lived in Kentucky.
85% of the 40218 zip code residents lived in the same house 1 year ago. Out of people who lived in different houses, 65% moved from this county. Out of people who lived in different houses, 6% moved from different county within same state. Out of people who lived in different houses, 20% moved from different state. Out of people who lived in different houses, 7% moved from abroad.
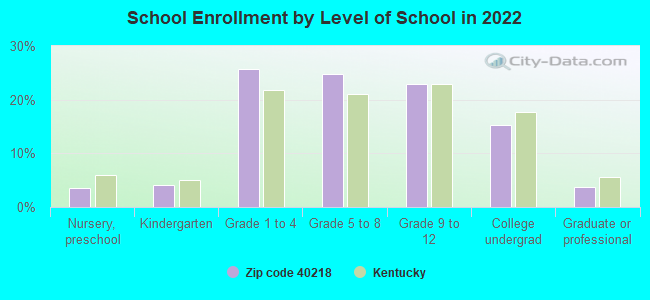
Private vs. public school enrollment:
Students in private schools in grades 1 to 8 (elementary and middle school): 625
Here:
16.3%
Kentucky:
17.2%
Students in private schools in grades 9 to 12 (high school): 432
Here:
24.7%
Kentucky:
15.2%
Students in private undergraduate colleges: 306
Here:
26.4%
Kentucky:
19.6%
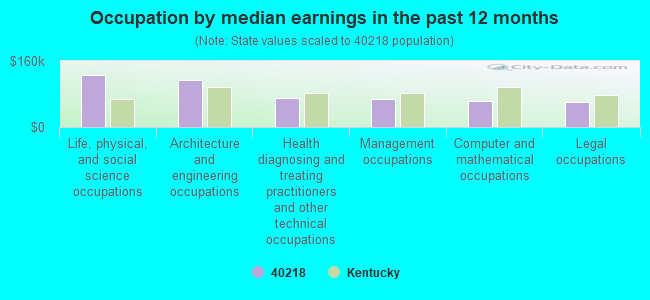
Occupation by median earnings in the past 12 months ($)
127,204Life, physical, and social science occupations
114,304Architecture and engineering occupations
70,986Health diagnosing and treating practitioners and other technical occupations
68,342Management occupations
62,597Computer and mathematical occupations
60,221Legal occupations
Companies with biggest federal contracts located in this zip code (LOUISVILLE, KY):
TJC ENGINEERING, INC (5001 CROWN MANOR PL STE 20; small business) : $94,052,997 in 861 contractsfrom 1999 to 2006
Contracts for Construction of Structures and Facilities -- Miscellaneous Buildings, Maintenance, Repair or Alteration of Real Property -- Miscellaneous Buildings, Maintenance, Repair or Alteration of Real Property -- Family Housing Facilities, Maintenance, Repair or Alteration of Real Property -- Other Non-Building Facilities, and moreby Army, Navy, U.S. Army Corps of Engineers - civil program financing only Signed by year:2000: $5,288,751; 2001: $9,373,269; 2002: $7,012,730; 2003: $30,539,846; 2004: $1,991,189; 2005: $30,308,364; 2006: $9,509,185.
Biggest contracts:
$8,022,674 with Army for Construction of Structures and Facilities -- Miscellaneous Buildings. Signed on 2001-03-28. Completion date: 2000-12-25.
$7,422,170, same as above.Signed on 2006-02-13. Completion date: 2007-03-07.
$5,000,000 with Navy for Maintenance, Repair or Alteration of Real Property -- Miscellaneous Buildings. Taking place in MS. Signed on 2005-09-04. Completion date: 2006-09-30.
$2,700,575 with Army for Maintenance, Repair or Alteration of Real Property -- Family Housing Facilities. Signed on 2000-02-07. Completion date: 2001-09-30.
INTEC BUILDING SERVICES, INC (3812 BARDSTOWN RD; small business) : $15,574,411 in 104 contractsfrom 1999 to 2006
Contracts for Custodial Janitorial Services, Fire Protection Services, Landscaping/Groundskeeping Services, Snow Removal/Salt Service (also spreading aggregate or other snow melting material) by Army, U.S. Army Corps of Engineers - civil program financing only, Public Buildings Service, Navy, and others Signed by year:2000: $2,114,214; 2001: $3,564,797; 2002: $1,545,282; 2003: $2,866,706; 2004: $2,530,321; 2005: $2,111,751; 2006: $781,340.
Biggest contracts:
$1,486,683 with Army for Custodial Janitorial Services. Signed on 2004-01-22. Completion date: 2004-01-31.
$1,369,194, same as above.Signed on 2003-01-30. Completion date: 2004-01-31.
$1,336,021, same as above.Signed on 2004-01-30. Completion date: 2004-01-31.
$1,218,358, same as above.Signed on 2003-01-30. Completion date: 2004-01-31.
NORTHVIEW ENTERPRISES, INC & T (5001 CROWN MANOR PL #204; small business) : $6,432,558 in 17 contractsfrom 2005 to 2006
Contracts for Construction of Structures and Facilities -- Heating and Cooling Plants by Army Signed by year:2000: $0; 2001: $0; 2002: $0; 2003: $0; 2004: $0; 2005: $6,387,245; 2006: $45,313.
Biggest contracts:
$2,277,576 with Army for Construction of Structures and Facilities -- Heating and Cooling Plants. Taking place in IL. Signed on 2005-06-30. Completion date: 2005-05-09.
$2,127,152, same as above.Signed on 2005-06-30. Completion date: 2006-06-30.
$1,136,452, same as above.Signed on 2005-08-31. Completion date: 2005-05-09.
$766,944, same as above.Signed on 2005-08-31. Completion date: 2006-06-30.
SKEES ENGINEERING, INC. (4229 BARDSTOWN RD.SUITE 31; small business) : $3,981,081 in 62 contractsfrom 1999 to 2005
Contracts for Other Architect and Engineering Services, Architect - Engineer Services (including landscaping, interior layout, and designing), Other Environmental Services, Studies, and Analytical Support by U.S. Army Corps of Engineers - civil program financing only, Army Signed by year:2000: $1,185,842; 2001: $955,690; 2002: $891,548; 2003: $834,565; 2004: $0; 2005: $105,474; 2006: $0.
Biggest contracts:
$399,707 with U.S. Army Corps of Engineers - civil program financing only for Other Architect and Engineering Services. Signed on 2003-04-18. Completion date: 2003-09-30.
$350,330, same as above.Signed on 2002-04-25. Completion date: 2002-09-30.
$272,074, same as above.Signed on 2001-03-02. Completion date: 2001-11-24.
$209,923, same as above.Signed on 2001-04-13. Completion date: 2001-09-30.
T E M ELECTRIC COMPANY INC & R (3730 HIKES AVENUE STE 100; small business)
$777,661 with Navy for Maintenance, Repair or Alteration of Real Property -- Fuel Supply Facilities. Taking place in FL. Signed on 2006-05-26. Completion date: 2006-11-27.
ENTERPRISE RENT-A-CAR COMPANY (3718 BARDSTOWN RD; small business) : $748,420 in 88 contractsfrom 2000 to 2006
Contracts for Motor Passenger Services, Lease or Rental of Equipment -- Vehicular Equipment Components, Other Transportation Travel and Relocation Services, Lease or Rental of Equipment -- Ground Effect Vehicles, Motor Vehicles, Trailers, and Cycles, and moreby Army, Department of Veterans Affairs Signed by year:2000: $56,582; 2001: $33,889; 2002: $32,919; 2003: $337,294; 2004: $140,149; 2005: $132,367; 2006: $15,220.
Biggest contracts:
$78,888 with Army for Motor Passenger Services. Signed on 2003-02-03. Completion date: 2003-09-30.
$41,340 with Army for Lease or Rental of Equipment -- Vehicular Equipment Components. Signed on 2003-10-14. Completion date: 2003-10-01.
$39,955 with Army for Other Transportation Travel and Relocation Services. Signed on 2001-02-08. Completion date: 2001-02-28.
$36,950 with Army for Lease or Rental of Equipment -- Ground Effect Vehicles, Motor Vehicles, Trailers, and Cycles. Signed on 2003-02-11. Completion date: 2003-02-12.
E R RONALD AND ASSOCIATES (1920 GOLDSMITH LANE, SUITE; small business) : $220,895 in 9 contractsfrom 2001 to 2006
Contracts for Hospital Buildings, Architect - Engineer Services (including landscaping, interior layout, and designing) by Department of Veterans Affairs, Army Signed by year:2000: $0; 2001: $93,000; 2002: $17,755; 2003: $41,859; 2004: $8,461; 2005: $3,807; 2006: $56,013.
Biggest contracts:
$93,000 with Department of Veterans Affairs for Hospital Buildings. Signed on 2001-09-15. Completion date: 2003-08-15.
$56,013 with Army for Architect - Engineer Services (including landscaping, interior layout, and designing). Signed on 2006-02-21. Completion date: 2006-02-21.
$32,118, same as above.Signed on 2003-05-30. Completion date: 2003-08-15.
$9,741, same as above.Signed on 2003-10-24. Completion date: 2003-08-15.
KEYSTONE SERVICES, INC (2210 MEADOW DRIVE SUITE #4; small business) : $79,433 in 21 contractsfrom 2003 to 2006
Contracts for Nursing Services by Army Signed by year:2000: $0; 2001: $0; 2002: $0; 2003: $43,892; 2004: $22,655; 2005: $21,896; 2006: -$9,010.
Biggest contracts:
$33,300 with Army for Nursing Services. Signed on 2004-10-12. Completion date: 2003-09-30.
$26,481, same as above.Signed on 2005-10-04. Completion date: 2003-09-30.
$25,466, same as above.Signed on 2003-10-02. Completion date: 2003-09-30.
$25,466, same as above.Signed on 2003-03-05. Completion date: 2003-09-30.
INFORMATION RESOURCES INC (4635 BITTERSWEET RD; small business) : $76,338 in 3 contractsfrom 2004 to 2005
$26,332 with Army for Warehousing and Storage Services. Signed on 2004-11-18. Completion date: 2005-11-30.
$26,332 with U.S. Army Corps of Engineers - civil program financing only for Warehousing and Storage Services. Signed on 2004-11-18. Completion date: 2005-11-30.
$23,674 with Army for Warehousing and Storage Services. Signed on 2005-10-20. Completion date: 2005-11-30.
FS SCHARDEIN & SONS, INC (4616 PINEWOOD RD; small business) : $61,317 in 2 contractsfrom 2004 to 2005
$54,900 with Army for Maintenance, Repair or Alteration of Real Property -- Office Buildings. Signed on 2005-09-29. Completion date: 2006-01-31.
$6,417 with Army for Maintenance, Repair or Alteration of Real Property -- Other Utilities. Signed on 2004-12-08. Completion date: 2004-12-22.
Top industries in this zip code by the number of employees in 2005:
Administrative and Support and Waste Management and Remediation Services: Temporary Help Services (250-499 employees: 2 establishments, 100-249 employees: 1 establishment, 50-99 employees: 3 establishments, 20-49 employees: 2 establishments, 10-19 employees: 1 establishment, 5-9 employees: 1 establishment, 1-4 employees: 5 establishments)
Real Estate and Rental and Leasing: Passenger Car Rental (500-999: 1)
2002 - 2018 National Fire Incident Reporting System (NFIRS) incidents
Based on the data from the years 2002 - 2018 the average number of fires per year is 130. The highest number of fire incidents - 209 took place in 2015, and the least - 29 in 2007. The data has a growing trend.
When looking into fire subcategories, the most incidents belonged to: Structure Fires (51.4%), and Outside Fires (25.9%).
Fire incident types reported to NFIRS in Zip Code 40218


 Nearest zip codes: 40231, 40205, 40220, 40219, 40228, 40213.


 Based on the data from the years 2002 - 2018 the average number of fires per year is 130. The highest number of fire incidents - 209 took place in 2015, and the least - 29 in 2007. The data has a growing trend.
 When looking into fire subcategories, the most incidents belonged to: Structure Fires (51.4%), and Outside Fires (25.9%).