Estimated zip code population in 2022: 34,721 Zip code population in 2010: 33,109 Zip code population in 2000: 32,834
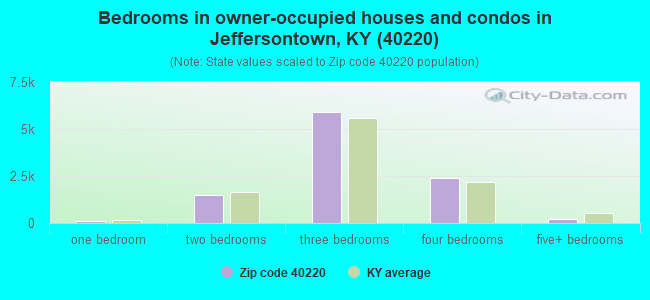
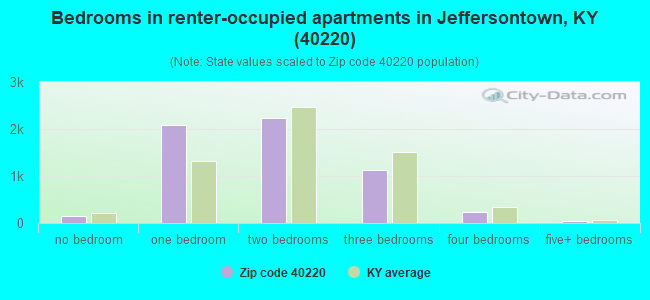
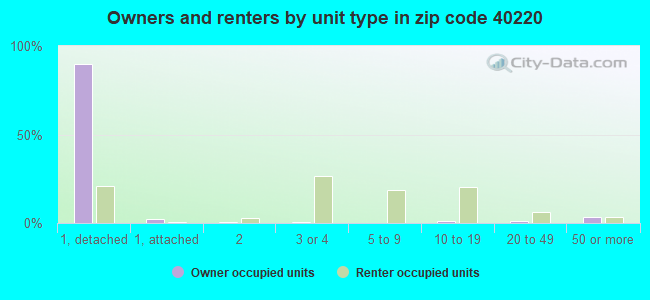
Houses and condos: 16,375 Renter-occupied apartments: 5,784
% of renters here:
36%
State:
31%
March 2022 cost of living index in zip code 40220: 89.1 (less than average, U.S. average is 100)
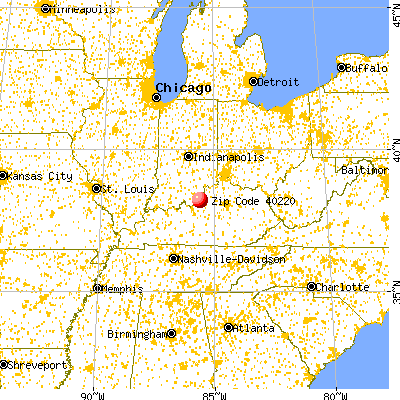
Land area: 7.6 sq. mi. Water area: 0.0 sq. mi.
Population density: 4,558 people per square mile
(average).
OSM Map
General Map
Google Map
MSN Map
OSM Map
General Map
Google Map
MSN Map
OSM Map
General Map
Google Map
MSN Map
OSM Map
General Map
Google Map
MSN Map
Please wait while loading the map...
Real estate property taxes paid for housing units in 2022:
This zip code:
0.8% ($2,148)
Kentucky:
0.7% ($1,456)
Median real estate property taxes paid for housing units with mortgages in 2022: $2,218 (0.8%) Median real estate property taxes paid for housing units with no mortgage in 2022: $1,990 (0.8%)
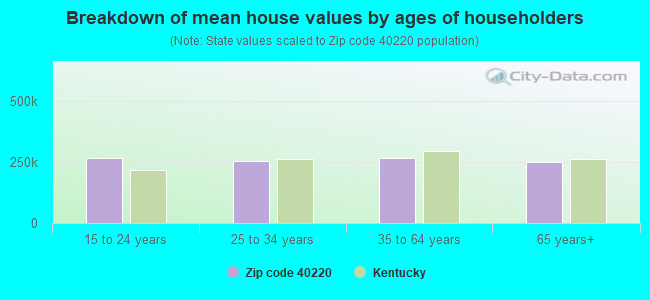
Estimated median house/condo value in 2022: $256,964
40220:
$256,964
Kentucky:
$196,300
According to our research of Kentucky and other state lists, there were 25 registered sex offenders living in 40220 zip code as of April 27, 2024. The ratio of all residents to sex offenders in zip code 40220 is 1,360 to 1. The ratio of registered sex offenders to all residents in this zip code is much lower than the state average.
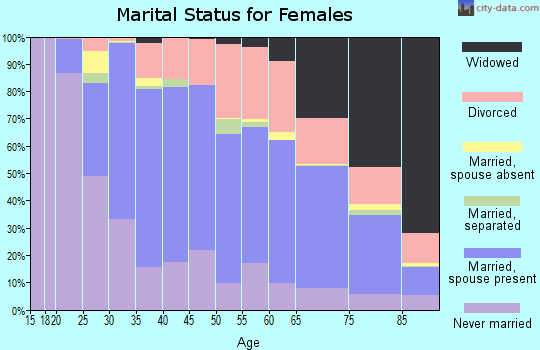
Median resident age:
This zip code:
39.8 years
Kentucky median age:
39.4 years
Average household size:
This zip code:
2.1 people
Kentucky:
2.4 people
Averages for the 2020 tax year for zip code 40220, filed in 2021:
Average Adjusted Gross Income (AGI) in 2020: $60,075 (Individual Income Tax Returns)
Here:
$60,075
State:
$61,342
Salary/wage: $51,840 (reported on 82.3% of returns)
Here:
$51,840
State:
$50,827
(% of AGI for various income ranges: 1156.4% for AGIs below $25k, 3586.2% for AGIs $25k-50k, 6558.3% for AGIs $50k-75k, 9555.7% for AGIs $75k-100k, 17535.7% for AGIs $100k-200k, 56791.4% for AGIs over 200k)
Taxable interest for individuals: $1,129 (reported on 26.7% of returns)
This zip code:
$1,129
Kentucky:
$1,441
(% of AGI for various income ranges: 16.6% for AGIs below $25k, 15.9% for AGIs $25k-50k, 38.6% for AGIs $50k-75k, 51.0% for AGIs $75k-100k, 115.6% for AGIs $100k-200k, 779.3% for AGIs over 200k)
Ordinary dividends: $4,708 (reported on 21.0% of returns)
Here:
$4,708
State:
$7,388
(% of AGI for various income ranges: 36.0% for AGIs below $25k, 45.3% for AGIs $25k-50k, 77.0% for AGIs $50k-75k, 163.3% for AGIs $75k-100k, 415.8% for AGIs $100k-200k, 3692.9% for AGIs over 200k)
Net capital gain/loss in AGI: +$13,547 (reported on 17.9% of returns)
Here:
+$13,547
State:
+$19,475
(% of AGI for various income ranges: 15.6% for AGIs below $25k, 32.2% for AGIs $25k-50k, 85.1% for AGIs $50k-75k, 174.7% for AGIs $75k-100k, 606.4% for AGIs $100k-200k, 20593.6% for AGIs over 200k)
Profit/loss from business: +$10,710 (reported on 14.9% of returns)
Here:
+$10,710
State:
+$11,386
(% of AGI for various income ranges: 99.3% for AGIs below $25k, 122.2% for AGIs $25k-50k, 179.3% for AGIs $50k-75k, 292.4% for AGIs $75k-100k, 517.3% for AGIs $100k-200k, 3923.6% for AGIs over 200k)
Taxable individual retirement arrangement distribution: $16,320 (reported on 10.7% of returns)
40220:
$16,320
Kentucky:
$18,941
(% of AGI for various income ranges: 75.7% for AGIs below $25k, 120.5% for AGIs $25k-50k, 223.9% for AGIs $50k-75k, 420.5% for AGIs $75k-100k, 733.7% for AGIs $100k-200k, 2616.4% for AGIs over 200k)
Self-employed (Keogh) retirement plans: $15,760 (reported on 0.3% of returns)
40220:
$15,760
Kentucky:
$23,933
(% of AGI for various income ranges: 59.7% for AGIs $100k-200k)
Total itemized deductions: $25,587 (reported on 6.9% of returns)
Here:
$25,587
State:
$32,473
(% of AGI for various income ranges: 40.3% for AGIs below $25k, 71.9% for AGIs $25k-50k, 301.4% for AGIs $50k-75k, 440.3% for AGIs $75k-100k, 691.7% for AGIs $100k-200k, 4109.3% for AGIs over 200k)
Charity contributions: $8,553 (reported on 5.4% of returns)
Here:
$8,553
State:
$13,472
(% of AGI for various income ranges: 4.3% for AGIs below $25k, 11.6% for AGIs $25k-50k, 48.5% for AGIs $50k-75k, 69.1% for AGIs $75k-100k, 190.8% for AGIs $100k-200k, 2200.0% for AGIs over 200k)
Taxes paid: $7,218 (reported on 6.9% of returns)
40220:
$7,218
State:
$7,830
(% of AGI for various income ranges: 4.4% for AGIs below $25k, 14.7% for AGIs $25k-50k, 82.1% for AGIs $50k-75k, 159.1% for AGIs $75k-100k, 228.5% for AGIs $100k-200k, 859.3% for AGIs over 200k)
Earned income credit: $2,044 (reported on 13.1% of returns)
Here:
$2,044
State:
$2,336
(% of AGI for various income ranges: 76.5% for AGIs below $25k, 50.2% for AGIs $25k-50k, 0.6% for AGIs $50k-75k)
Percentage of individuals using paid preparers for their 2020 taxes: 92.3%
Here:
92%
State:
94%
(% for various income ranges: 91.7% for AGIs below $25k, 93.3% for AGIs $25k-50k, 91.3% for AGIs $50k-75k, 92.6% for AGIs $75k-100k, 92.3% for AGIs $100k-200k, 93.2% for AGIs over 200k)
Averages for the 2012 tax year for zip code 40220, filed in 2013:
Average Adjusted Gross Income (AGI) in 2012: $50,494 (Individual Income Tax Returns)
Here:
$50,494
State:
$50,814
Salary/wage: $43,584 (reported on 84.3% of returns)
Here:
$43,584
State:
$42,723
(% of AGI for various income ranges: 73.9% for AGIs below $25k, 79.1% for AGIs $25k-50k, 75.3% for AGIs $50k-75k, 74.2% for AGIs $75k-100k, 76.2% for AGIs $100k-200k, 48.5% for AGIs over 200k)
Taxable interest for individuals: $1,232 (reported on 31.8% of returns)
This zip code:
$1,232
Kentucky:
$1,381
(% of AGI for various income ranges: 1.2% for AGIs below $25k, 0.6% for AGIs $25k-50k, 0.7% for AGIs $50k-75k, 0.8% for AGIs $75k-100k, 0.7% for AGIs $100k-200k, 0.8% for AGIs over 200k)
Ordinary dividends: $3,748 (reported on 22.5% of returns)
Here:
$3,748
State:
$6,239
(% of AGI for various income ranges: 2.1% for AGIs below $25k, 1.2% for AGIs $25k-50k, 1.3% for AGIs $50k-75k, 1.6% for AGIs $75k-100k, 1.6% for AGIs $100k-200k, 2.8% for AGIs over 200k)
Net capital gain/loss in AGI: +$4,257 (reported on 15.6% of returns)
Here:
+$4,257
State:
+$11,336
(% of AGI for various income ranges: 0.2% for AGIs $25k-50k, 0.4% for AGIs $50k-75k, 0.7% for AGIs $75k-100k, 1.2% for AGIs $100k-200k, 6.6% for AGIs over 200k)
Profit/loss from business: +$12,049 (reported on 13.0% of returns)
Here:
+$12,049
State:
+$10,862
(% of AGI for various income ranges: 6.0% for AGIs below $25k, 2.2% for AGIs $25k-50k, 2.2% for AGIs $50k-75k, 1.8% for AGIs $75k-100k, 2.6% for AGIs $100k-200k, 6.3% for AGIs over 200k)
Taxable individual retirement arrangement distribution: $12,672 (reported on 11.8% of returns)
40220:
$12,672
Kentucky:
$14,296
(% of AGI for various income ranges: 3.9% for AGIs below $25k, 2.6% for AGIs $25k-50k, 2.7% for AGIs $50k-75k, 3.0% for AGIs $75k-100k, 3.1% for AGIs $100k-200k, 3.0% for AGIs over 200k)
Self-employment retirement plans: $16,767 (reported on 0.4% of returns)
40220:
$16,767
Kentucky:
$20,768
Total itemized deductions: $18,497 (21% of AGI, reported on 36.3% of returns)
Here:
$18,497
State:
$21,160
Here:
21.2% of AGI
State:
20.0% of AGI
(% of AGI for various income ranges: 10.2% for AGIs below $25k, 11.4% for AGIs $25k-50k, 14.3% for AGIs $50k-75k, 14.6% for AGIs $75k-100k, 14.9% for AGIs $100k-200k, 12.1% for AGIs over 200k)
Charity contributions: $3,327 (reported on 31.1% of returns)
Here:
$3,327
State:
$4,303
(% of AGI for various income ranges: 1.0% for AGIs below $25k, 1.4% for AGIs $25k-50k, 1.9% for AGIs $50k-75k, 2.3% for AGIs $75k-100k, 2.6% for AGIs $100k-200k, 2.6% for AGIs over 200k)
Taxes paid: $7,471 (reported on 36.2% of returns)
40220:
$7,471
State:
$8,496
(% of AGI for various income ranges: 1.6% for AGIs below $25k, 3.1% for AGIs $25k-50k, 5.1% for AGIs $50k-75k, 6.1% for AGIs $75k-100k, 7.4% for AGIs $100k-200k, 6.8% for AGIs over 200k)
Earned income credit: $2,008 (reported on 14.8% of returns)
Here:
$2,008
State:
$2,273
(% of AGI for various income ranges: 4.9% for AGIs below $25k, 0.7% for AGIs $25k-50k)
Percentage of individuals using paid preparers for their 2012 taxes: 49.1%
Here:
49%
State:
60%
(% for various income ranges: 46.4% for AGIs below $25k, 48.0% for AGIs $25k-50k, 50.6% for AGIs $50k-75k, 51.6% for AGIs $75k-100k, 55.0% for AGIs $100k-200k, 68.0% for AGIs over 200k)
Averages for the 2004 tax year for zip code 40220, filed in 2005:
Average Adjusted Gross Income (AGI) in 2004: $44,716 (Individual Income Tax Returns)
Here:
$44,716
State:
$41,540
Salary/wage: $40,463 (reported on 83.4% of returns)
Here:
$40,463
State:
$36,432
(% of AGI for various income ranges: 107.7% for AGIs below $10k, 71.9% for AGIs $10k-25k, 77.1% for AGIs $25k-50k, 76.4% for AGIs $50k-75k, 80.7% for AGIs $75k-100k, 69.8% for AGIs over 100k)
Taxable interest for individuals: $1,788 (reported on 47.6% of returns)
This zip code:
$1,788
Kentucky:
$1,571
(% of AGI for various income ranges: 5.8% for AGIs below $10k, 3.8% for AGIs $10k-25k, 1.9% for AGIs $25k-50k, 1.7% for AGIs $50k-75k, 1.4% for AGIs $75k-100k, 1.5% for AGIs over 100k)
Taxable dividends: $2,589 (reported on 29.8% of returns)
Here:
$2,589
State:
$3,453
(% of AGI for various income ranges: 5.2% for AGIs below $10k, 2.3% for AGIs $10k-25k, 1.6% for AGIs $25k-50k, 1.6% for AGIs $50k-75k, 1.4% for AGIs $75k-100k, 1.7% for AGIs over 100k)
Net capital gain/loss: +$4,845 (reported on 22.2% of returns)
Here:
+$4,845
State:
+$9,663
(% of AGI for various income ranges: -3.2% for AGIs below $10k, 0.1% for AGIs $10k-25k, 0.4% for AGIs $25k-50k, 0.8% for AGIs $50k-75k, 1.2% for AGIs $75k-100k, 6.6% for AGIs over 100k)
Profit/loss from business: +$9,146 (reported on 12.8% of returns)
Here:
+$9,146
State:
+$9,233
(% of AGI for various income ranges: 4.7% for AGIs below $10k, 3.4% for AGIs $10k-25k, 2.5% for AGIs $25k-50k, 2.5% for AGIs $50k-75k, 1.2% for AGIs $75k-100k, 3.3% for AGIs over 100k)
IRA payment deduction: $2,925 (reported on 2.6% of returns)
40220:
$2,925
Kentucky:
$2,955
(% of AGI for various income ranges: 0.2% for AGIs below $10k, 0.2% for AGIs $10k-25k, 0.3% for AGIs $25k-50k, 0.2% for AGIs $50k-75k, 0.1% for AGIs $75k-100k, 0.1% for AGIs over 100k)
Self-employed pension: $11,600 (reported on 0.5% of returns)
Here:
$11,600
Kentucky:
$14,996
(% of AGI for various income ranges: 0.1% for AGIs $10k-25k, 0.1% for AGIs $50k-75k, 0.1% for AGIs $75k-100k, 0.3% for AGIs over 100k)
Total itemized deductions: $16,803 (23% of AGI, reported on 41.7% of returns)
Here:
$16,803
State:
$17,474
Here:
22.7% of AGI
State:
21.0% of AGI
(% of AGI for various income ranges: 19.2% for AGIs below $10k, 11.9% for AGIs $10k-25k, 13.0% for AGIs $25k-50k, 17.3% for AGIs $50k-75k, 17.9% for AGIs $75k-100k, 16.0% for AGIs over 100k)
Charity contributions deductions: $3,230 (4% of AGI, reported on 38.7% of returns)
Here:
$3,230
State:
$3,494
Here:
4.2% of AGI
State:
4.0% of AGI
(% of AGI for various income ranges: 1.5% for AGIs below $10k, 1.5% for AGIs $10k-25k, 2.0% for AGIs $25k-50k, 2.7% for AGIs $50k-75k, 3.1% for AGIs $75k-100k, 3.7% for AGIs over 100k)
Total tax: $5,981 (reported on 79.9% of returns)
40220:
$5,981
State:
$6,162
(% of AGI for various income ranges: 2.9% for AGIs below $10k, 4.3% for AGIs $10k-25k, 7.6% for AGIs $25k-50k, 9.3% for AGIs $50k-75k, 10.1% for AGIs $75k-100k, 16.6% for AGIs over 100k)
Earned income credit: $1,526 (reported on 10.7% of returns)
Here:
$1,526
State:
$1,723
Percentage of individuals using paid preparers for their 2004 taxes: 52.4%
Here:
52%
State:
66%
(% for various income ranges: 45.2% for AGIs below $10k, 53.0% for AGIs $10k-25k, 52.9% for AGIs $25k-50k, 54.8% for AGIs $50k-75k, 53.3% for AGIs $75k-100k, 59.2% for AGIs over 100k)
Likely homosexual households (counted as self-reported same-sex unmarried-partner households)
Lesbian couples: 0.3% of all households
Gay men: 0.2% of all households
Household received Food Stamps/SNAP in the past 12 months: 590 Household did not receive Food Stamps/SNAP in the past 12 months: 15,368
Women who had a birth in the past 12 months: 521 (456 now married, 56 unmarried) Women who did not have a birth in the past 12 months: 7,095 (3,097 now married, 3,995 unmarried)
Housing units in zip code 40220 with a mortgage: 6,519 (724 second mortgage, 91 home equity loan, 576 both second mortgage and home equity loan) Houses without a mortgage: 257
Median monthly owner costs for units with a mortgage: $1,458 Median monthly owner costs for units without a mortgage: $557
Residents with income below the poverty level in 2022:
This zip code:
8.6%
Whole state:
16.5%
Residents with income below 50% of the poverty level in 2022:
This zip code:
4.7%
Whole state:
9.0%
Median number of rooms in houses and condos:
Here:
6.8
State:
6.4
Median number of rooms in apartments:
Here:
4.2
State:
4.4
Notable locations in this zip code not listed on our city pages
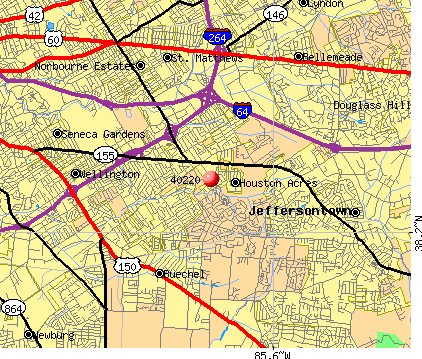
Notable locations in zip code 40220: Huntington Learning Center (A), Bon Air Regional Branch Library Louisville Free Public Library (B), McMahon Fire Department (C), Meredith-Dunn Library (D), Jeffersontown Fire Department Station 3 (E). Display/hide their locations on the map
Shopping Centers: Hikes Point Plaza Shopping Center (1), Breckenridge Plaza Shopping Center (2), Westport Plaza Shopping Center (3), Stony Brook Shopping Center (4), McMahan Plaza Shopping Center (5). Display/hide their locations on the map
Churches in zip code 40220 include: Saint Pauls Episcopal Church (A), Saint Barnabas Church (B), The River Community Church (C), Grace Community Church of the Nazarene (D), First Church of God of Anderson Indiana (E), Church of Christ (F), Meadowview Church (G), Melbourne Heights Church (H), Saint Andrews Church (I). Display/hide their locations on the map
Tourist attractions (not listed on the city page) : Wild Birds Unlimited (Nature Centers; 1969 South Hurstbourne Parkway) (1), Paula's World of Travel (Tours & Charters; 3834 Taylorsville Road) (2). Display/hide their approximate locations on the map
4,381 married couples with children.
1,461 single-parent households (373 men, 1,088 women).
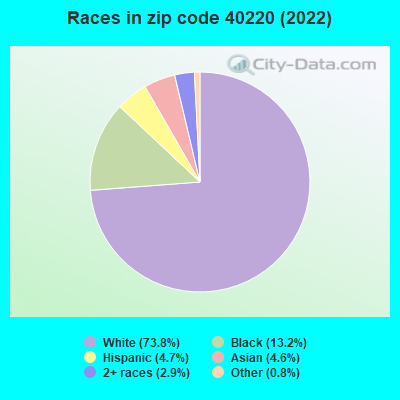
88.0% of residents of 40220 zip code speak English at home.
3.8% of residents speak Spanish at home (44% very well, 40% well, 12% not well, 3% not at all).
4.2% of residents speak other Indo-European language at home (74% very well, 16% well, 7% not well, 3% not at all).
2.9% of residents speak Asian or Pacific Island language at home (52% very well, 43% well, 5% not well).
0.8% of residents speak other language at home (83% very well, 16% well).
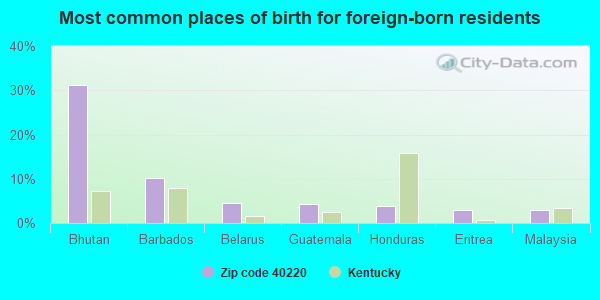
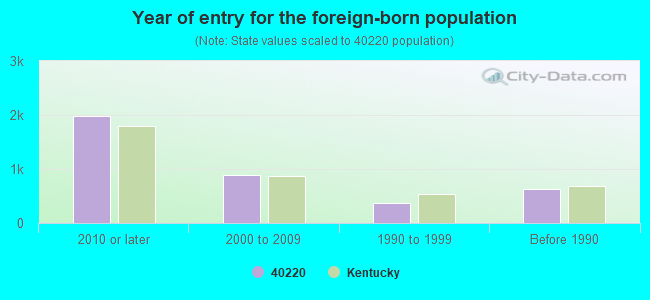
Foreign born population: 3,455 (10.0%) (50.7% of them are naturalized citizens)
Facilities with environmental interests located in this zip code:
NORTEN"S HOSPITAL (200 E CHESTNUT STREET in LOUISVILLE, KY)
COMPLIANCE ACTIVITY (Tracking inspections of insecticide, fungicide, and rodenticide, and toxic substances) (National Center for Education Statistics) - STATE ID-056275452 (National Center for Education Statistics) - STATE ID-056275456 Conditionally Exempt Small Quantity Generators, less than 100 kg/month of hazardous waste (Resource Conservation and Recovery Act (tracking hazardous waste)) Organizations: NORTON HEALTHCARE, INC. (CONTACT/OWNER)
, JEFFERSON COUNTY (SCHOOL DISTRICT)
Alternative names: ACKERLY/BINGHAM GUIDANCE, NORTON BURN UNIT, NORTON HEALTHCARE INC
ALFRED BINET SPECIAL EDUCATION SCHOOL (3410 BON AIR AVE in LOUISVILLE, KY)
(National Center for Education Statistics) - STATE ID-056275183 Organizations: JEFFERSON COUNTY (SCHOOL DISTRICT)
B & K MINI MART (3009 SEVENTH STREET in LOUISVILLE, KY)
AIR MINOR (AIRS/AFS) (Resource Conservation and Recovery Act (tracking hazardous waste)) Business SIC classification: GASOLINE SERVICE STATIONS Organizations: FRIDAY PROPERTIES (CONTACT/OWNER)
BECKHAMS INCORPORATED (4100 BROWNS LANE in LOUISVILLE, KY)
AIR MINOR (AIRS/AFS) (Resource Conservation and Recovery Act (tracking hazardous waste)) Business SIC classification: GASOLINE SERVICE STATIONS
ADAMS RUN SECTION 4 (BEULAH CHURCH RD in LOUISVILLE, KY)
National Pollutant Discharge Elimination System NON-MAJOR (Tracking pollutant discharge elimination systems) - permit Business SIC classification: MANAGEMENT SERVICES
BP OIL COMPANY (1700 S HURSTBOURNE LN in LOUISVILLE, KY)
(Resource Conservation and Recovery Act (tracking hazardous waste)) Organizations: KIEL BROS. OIL COMPANY (CONTACT/OWNER)
BRECKINRIDGE PLAZA BP (3401 BRECKINRIDGE LANE in LOUISVILLE, KY)
(Resource Conservation and Recovery Act (tracking hazardous waste)) Organizations: BOB LOCKETT (CONTACT/OWNER)
CHURCHILL PARK APARTMENTS (3091 BRECKINRIDGE LANE in LOUISVILLE, KY)
(Resource Conservation and Recovery Act (tracking hazardous waste)) Organizations: CONSOLIDATED CAPITAL GROWTH FUND (CONTACT/OWNER)
MIDAS MUFFLER SHOP (4047 TAYLORSVILLE ROAD in LOUISVILLE, KY)
(Resource Conservation and Recovery Act (tracking hazardous waste)) Business NAICS classification: AUTOMOTIVE EXHAUST SYSTEM REPAIR. Organizations: MIDAS REALITY CORPORATION (CONTACT/OWNER)
NU-YALE DRY CLEANERS (HUNTINGTON SHOPPING CENTER in LOUISVILLE, KY)
FREEWAY ASSOCIATES (4110 ELMWOOD AVE in LOUISVILLE, KY)
National Pollutant Discharge Elimination System NON-MAJOR (Tracking pollutant discharge elimination systems) - permit Business SIC classification: HIGHWAY AND STREET CONSTRUCTION, EXCEPT ELEVATED HIGHWAYS
MERAH INC DBA ONE HR MARTINIZING DRY CL (2723 S HURSTBOURNE PKWY in LOUISVILLE, KY)
Conditionally Exempt Small Quantity Generators, less than 100 kg/month of hazardous waste (Resource Conservation and Recovery Act (tracking hazardous waste)) - notification Organizations: DOUGLAS R & MARTINA B DOLL (CONTACT/OWNER)
Housing units lacking complete plumbing facilities: 0.2% Housing units lacking complete kitchen facilities: 1.0%
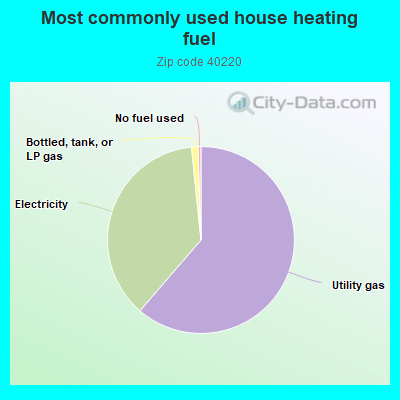
60.9%Utility gas
36.8%Electricity
1.1%Bottled, tank, or LP gas
0.5%No fuel used
Population in 1990: 29,012. Population change in the 1990s: +3,822 (+13.2%).
Place of birth for U.S.-born residents:
This state: 22,101
Northeast: 725
Midwest: 4,256
South: 2,682
West: 1,087
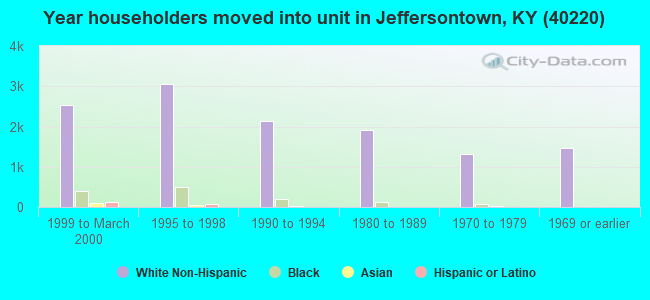
55% of the 40220 zip code residents lived in the same house 5 years ago. Out of people who lived in different houses, 67% lived in this county. Out of people who lived in different counties, 50% lived in Kentucky.
87% of the 40220 zip code residents lived in the same house 1 year ago. Out of people who lived in different houses, 63% moved from this county. Out of people who lived in different houses, 12% moved from different county within same state. Out of people who lived in different houses, 17% moved from different state. Out of people who lived in different houses, 7% moved from abroad.
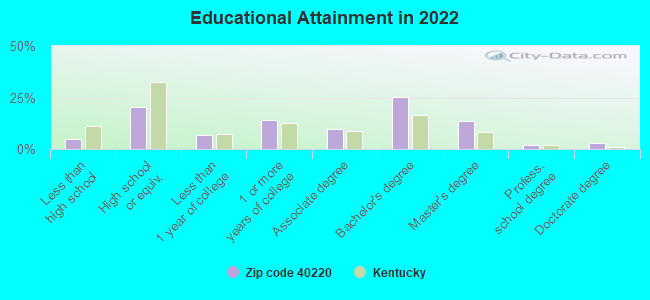
Private vs. public school enrollment:
Students in private schools in grades 1 to 8 (elementary and middle school): 1,105
Here:
33.7%
Kentucky:
17.2%
Students in private schools in grades 9 to 12 (high school): 235
Here:
24.3%
Kentucky:
15.2%
Students in private undergraduate colleges: 211
Here:
28.2%
Kentucky:
19.6%
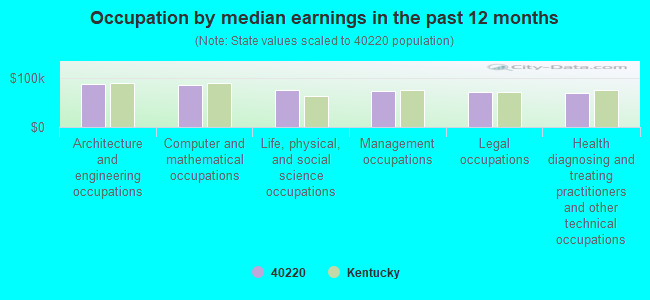
Occupation by median earnings in the past 12 months ($)
88,125Architecture and engineering occupations
84,419Computer and mathematical occupations
75,432Life, physical, and social science occupations
72,272Management occupations
71,412Legal occupations
68,607Health diagnosing and treating practitioners and other technical occupations
Companies with federal contracts located in this zip code (LOUISVILLE, KY):
FRENCH, WILLIAM S MD (2934 BRECKENRIDGE LN; small business) : $188,360 in 8 contractsfrom 2003 to 2006
Contracts for Physical Medicine and Rehabilitation Services by Army, U.S. Army Corps of Engineers - civil program financing only Signed by year:2000: $0; 2001: $0; 2002: $0; 2003: $31,500; 2004: $66,000; 2005: $54,860; 2006: $36,000.
Biggest contracts:
$36,000 with Army for Physical Medicine and Rehabilitation Services. Signed on 2006-02-01. Completion date: 2006-01-31.
$33,000, same as above.Signed on 2004-01-16. Completion date: 2003-03-03.
$33,000 with U.S. Army Corps of Engineers - civil program financing only for Physical Medicine and Rehabilitation Services. Signed on 2004-01-16. Completion date: 2003-03-03.
$31,500, same as above.Signed on 2003-03-07. Completion date: 2003-03-03.
GUARDIAN ANGEL STAFFING AGENCY (2821 S HURSTBOURNE PKWY ST; small business) : $64,050 in 5 contractsfrom 2005 to 2006
Contracts for Radiology Services by Army Signed by year:2000: $0; 2001: $0; 2002: $0; 2003: $0; 2004: $0; 2005: $31,250; 2006: $32,800.
Biggest contracts:
$32,800 with Army for Radiology Services. Signed on 2006-03-27. Completion date: 2006-09-30.
$31,250, same as above.Signed on 2005-10-05. Completion date: 2006-09-30.
$31,250, same as above.Signed on 2005-09-09. Completion date: 2006-09-30.
$0, same as above.Signed on 2005-10-05. Completion date: 2006-09-30.
DENTINGER, ROY E (3030 BRECKENRIDGE LN BLDG; small business) : $20,860 in 15 contractsfrom 2001 to 2005
Contracts for Chaplain Services by Army Signed by year:2000: $0; 2001: $3,570; 2002: $7,730; 2003: $2,700; 2004: $6,885; 2005: -$25; 2006: $0.
Biggest contracts:
$4,425 with Army for Chaplain Services. Signed on 2004-11-04. Completion date: 2005-09-30.
$3,570, same as above.Signed on 2001-10-04. Completion date: 2002-09-30.
$3,135, same as above.Signed on 2004-05-03. Completion date: 2004-09-30.
$2,775, same as above.Signed on 2003-10-14. Completion date: 2004-09-30.
LOUISVILLE WOODWORKER SUPPLY L (1846 S HURSTBOURNE PKWY; small business) : $13,140 in 2 contractsin 2005
$7,795 with Army for Hardware, Commercial. Signed on 2005-09-21. Completion date: 2005-10-31.
$5,345 with Army for Miscellaneous Machine Tools. Signed on 2005-04-25. Completion date: 2005-05-05.
SEATON SPRINGS, INC (1979 S HURSTBOURNE PKWY; small business) : $12,327 in 2 contractsfrom 2005 to 2006
$8,878 with Army for Signs, Advertising Displays, and Identification Plates. Signed on 2005-11-22. Completion date: 2005-11-23.
$3,449, same as above.Signed on 2006-03-10. Completion date: 2006-04-04.
DERBY DAVE'S, LLC (8605 CITADEL WAY; small business)
$7,500 with Army for Food Services. Signed on 2004-12-03. Completion date: 2004-12-05.
BLUEGRASS SIGNS INC (2136 S HURSTBOURNE PKWY; small business) : $2,343 in 3 contractsin 2005
$1,893 with Army for Signs, Advertising Displays, and Identification Plates. Signed on 2005-03-07. Completion date: 2005-01-31.
$250, same as above.Signed on 2005-03-11. Completion date: 2005-01-31.
$200, same as above.Signed on 2005-03-25. Completion date: 2005-01-31.
EFFOG CORPORATION (2950 BRECKENRIDGE LANE; small business) : $1,896 in 4 contractsfrom 2003 to 2005
$1,235 with Defense Commissary Agency for Landscaping/Groundskeeping Services. Signed on 2005-09-13. Completion date: 2005-10-17.
$414 with Department of Defense for Accounting Services (NOTE: New code created for Financial Services See R710 below). Signed on 2005-12-28. Completion date: 2006-02-06.
$247, same as above.Signed on 2005-10-25. Completion date: 2005-10-17.
$0 with Department of Defense for Other Management Support Services. Signed on 2003-08-15. Completion date: 2004-08-31.
Top industries in this zip code by the number of employees in 2005:
Administrative and Support and Waste Management and Remediation Services: Temporary Help Services (500-999 employees: 1 establishment, 250-499 employees: 1 establishment, 50-99 employees: 1 establishment, 20-49 employees: 2 establishments, 5-9 employees: 1 establishment, 1-4 employees: 1 establishment)
Health Care and Social Assistance: Nursing Care Facilities (100-249: 6)
2002 - 2018 National Fire Incident Reporting System (NFIRS) incidents
According to the data from the years 2002 - 2018 the average number of fires per year is 73. The highest number of fire incidents - 121 took place in 2017, and the least - 9 in 2002. The data has a rising trend.
When looking into fire subcategories, the most incidents belonged to: Structure Fires (40.8%), and Outside Fires (34.1%).
Fire incident types reported to NFIRS in Zip Code 40220


 Nearest zip codes: 40218, 40222, 40041, 40207, 40205, 40242.


 According to the data from the years 2002 - 2018 the average number of fires per year is 73. The highest number of fire incidents - 121 took place in 2017, and the least - 9 in 2002. The data has a rising trend.
 When looking into fire subcategories, the most incidents belonged to: Structure Fires (40.8%), and Outside Fires (34.1%).