Estimated zip code population in 2022: 11,568 Zip code population in 2010: 10,930 Zip code population in 2000: 10,349
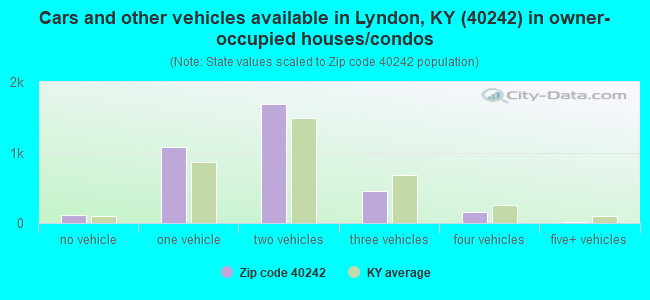
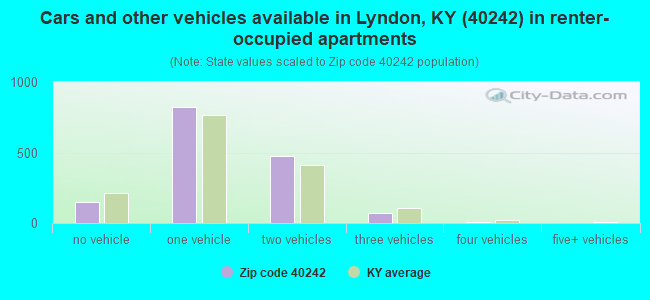
Houses and condos: 5,090 Renter-occupied apartments: 1,525
% of renters here:
30%
State:
31%
March 2022 cost of living index in zip code 40242: 89.6 (less than average, U.S. average is 100)
Land area: 2.7 sq. mi. Water area: 0.0 sq. mi.
Population density: 4,337 people per square mile
(average).
OSM Map
General Map
Google Map
MSN Map
OSM Map
General Map
Google Map
MSN Map
OSM Map
General Map
Google Map
MSN Map
OSM Map
General Map
Google Map
MSN Map
Please wait while loading the map...
Real estate property taxes paid for housing units in 2022:
This zip code:
0.8% ($2,360)
Kentucky:
0.7% ($1,456)
Median real estate property taxes paid for housing units with mortgages in 2022: $2,330 (0.7%) Median real estate property taxes paid for housing units with no mortgage in 2022: $2,401 (0.8%)
Business Search- 14 Million verified businesses
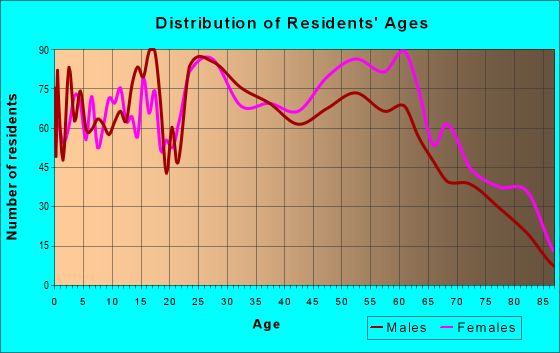
Males: 5,243
(45.3%)
Females: 6,326
(54.7%)
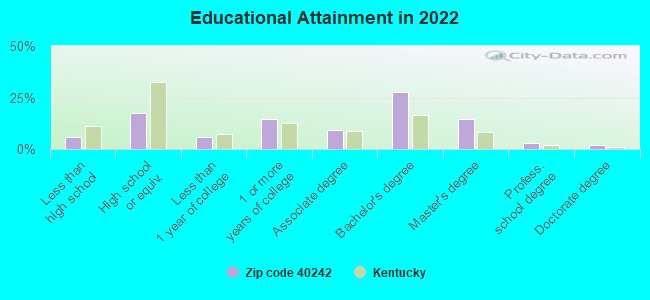
For population 25 years and over in 40242:
High school or higher: 95.6%
Bachelor's degree or higher: 48.0%
Graduate or professional degree: 19.7%
Unemployed: 3.8%
Mean travel time to work (commute): 20.0 minutes
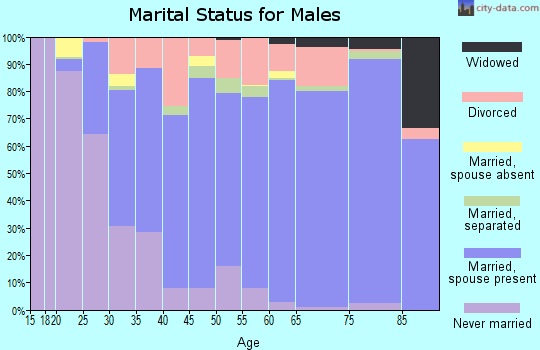
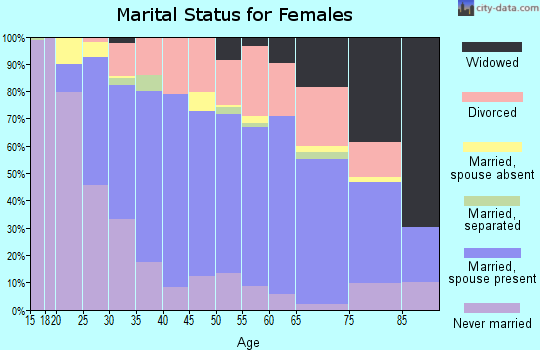
For population 15 years and over in 40242:
Never married: 32.1%
Now married: 48.7%
Separated: 1.0%
Widowed: 5.9%
Divorced: 12.2%
Zip code 40242 compared to state average:
Median house value above state average.
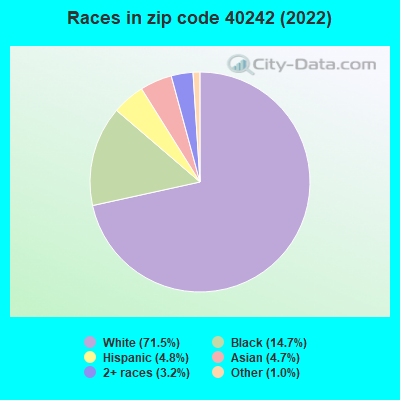
Black race population percentage above state average.
Foreign-born population percentage significantly above state average.
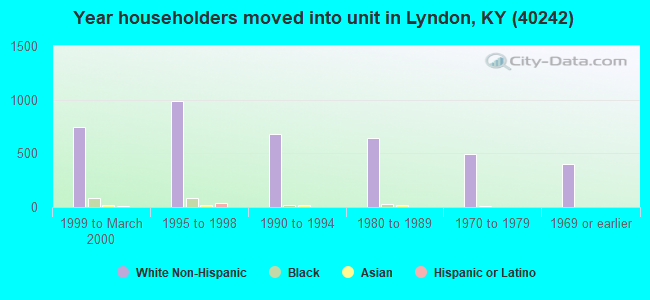
Length of stay since moving in above state average.
Percentage of population with a bachelor's degree or higher above state average.
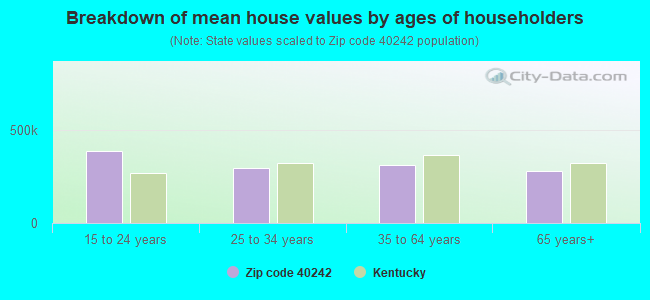
Estimated median house/condo value in 2022: $307,204
40242:
$307,204
Kentucky:
$196,300
According to our research of Kentucky and other state lists, there were 5 registered sex offenders living in 40242 zip code as of April 26, 2024. The ratio of all residents to sex offenders in zip code 40242 is 2,293 to 1. The ratio of registered sex offenders to all residents in this zip code is much lower than the state average.
Median resident age:
This zip code:
36.2 years
Kentucky median age:
39.4 years
Average household size:
This zip code:
2.3 people
Kentucky:
2.4 people
Averages for the 2020 tax year for zip code 40242, filed in 2021:
Average Adjusted Gross Income (AGI) in 2020: $69,680 (Individual Income Tax Returns)
Here:
$69,680
State:
$61,342
Salary/wage: $59,179 (reported on 81.5% of returns)
Here:
$59,179
State:
$50,827
(% of AGI for various income ranges: 1217.5% for AGIs below $25k, 3611.7% for AGIs $25k-50k, 6048.0% for AGIs $50k-75k, 9405.6% for AGIs $75k-100k, 17362.5% for AGIs $100k-200k, 66015.0% for AGIs over 200k)
Taxable interest for individuals: $1,131 (reported on 30.6% of returns)
This zip code:
$1,131
Kentucky:
$1,441
(% of AGI for various income ranges: 12.4% for AGIs below $25k, 23.3% for AGIs $25k-50k, 50.8% for AGIs $50k-75k, 61.5% for AGIs $75k-100k, 128.3% for AGIs $100k-200k, 401.2% for AGIs over 200k)
Ordinary dividends: $5,655 (reported on 25.7% of returns)
Here:
$5,655
State:
$7,388
(% of AGI for various income ranges: 33.8% for AGIs below $25k, 63.8% for AGIs $25k-50k, 160.0% for AGIs $50k-75k, 243.5% for AGIs $75k-100k, 542.1% for AGIs $100k-200k, 2861.2% for AGIs over 200k)
Net capital gain/loss in AGI: +$8,452 (reported on 22.1% of returns)
Here:
+$8,452
State:
+$19,475
(% of AGI for various income ranges: 20.1% for AGIs below $25k, 40.3% for AGIs $25k-50k, 115.5% for AGIs $50k-75k, 201.2% for AGIs $75k-100k, 533.1% for AGIs $100k-200k, 6815.0% for AGIs over 200k)
Profit/loss from business: +$14,142 (reported on 14.7% of returns)
Here:
+$14,142
State:
+$11,386
(% of AGI for various income ranges: 61.9% for AGIs below $25k, 117.4% for AGIs $25k-50k, 132.0% for AGIs $50k-75k, 453.2% for AGIs $75k-100k, 764.8% for AGIs $100k-200k, 3950.0% for AGIs over 200k)
Taxable individual retirement arrangement distribution: $20,286 (reported on 12.7% of returns)
40242:
$20,286
Kentucky:
$18,941
(% of AGI for various income ranges: 80.2% for AGIs below $25k, 133.1% for AGIs $25k-50k, 305.0% for AGIs $50k-75k, 565.9% for AGIs $75k-100k, 1169.6% for AGIs $100k-200k, 2390.0% for AGIs over 200k)
Self-employed (Keogh) retirement plans: $16,625 (reported on 0.7% of returns)
40242:
$16,625
Kentucky:
$23,933
(% of AGI for various income ranges: 127.9% for AGIs $100k-200k)
Total itemized deductions: $27,206 (reported on 9.2% of returns)
Here:
$27,206
State:
$32,473
(% of AGI for various income ranges: 152.5% for AGIs $25k-50k, 341.8% for AGIs $50k-75k, 562.4% for AGIs $75k-100k, 949.0% for AGIs $100k-200k, 3943.8% for AGIs over 200k)
Charity contributions: $9,688 (reported on 7.2% of returns)
Here:
$9,688
State:
$13,472
(% of AGI for various income ranges: 16.7% for AGIs $25k-50k, 53.3% for AGIs $50k-75k, 97.6% for AGIs $75k-100k, 310.4% for AGIs $100k-200k, 1750.0% for AGIs over 200k)
Taxes paid: $7,537 (reported on 9.2% of returns)
40242:
$7,537
State:
$7,830
(% of AGI for various income ranges: 26.8% for AGIs $25k-50k, 94.8% for AGIs $50k-75k, 201.8% for AGIs $75k-100k, 275.8% for AGIs $100k-200k, 1017.5% for AGIs over 200k)
Earned income credit: $2,052 (reported on 11.1% of returns)
Here:
$2,052
State:
$2,336
(% of AGI for various income ranges: 68.1% for AGIs below $25k, 49.3% for AGIs $25k-50k)
Percentage of individuals using paid preparers for their 2020 taxes: 92.9%
Here:
93%
State:
94%
(% for various income ranges: 93.2% for AGIs below $25k, 93.4% for AGIs $25k-50k, 92.5% for AGIs $50k-75k, 90.7% for AGIs $75k-100k, 92.6% for AGIs $100k-200k, 96.2% for AGIs over 200k)
Averages for the 2012 tax year for zip code 40242, filed in 2013:
Average Adjusted Gross Income (AGI) in 2012: $58,989 (Individual Income Tax Returns)
Here:
$58,989
State:
$50,814
Salary/wage: $50,091 (reported on 84.1% of returns)
Here:
$50,091
State:
$42,723
(% of AGI for various income ranges: 74.8% for AGIs below $25k, 77.2% for AGIs $25k-50k, 73.3% for AGIs $50k-75k, 71.6% for AGIs $75k-100k, 73.8% for AGIs $100k-200k, 58.0% for AGIs over 200k)
Taxable interest for individuals: $1,328 (reported on 35.9% of returns)
This zip code:
$1,328
Kentucky:
$1,381
(% of AGI for various income ranges: 1.3% for AGIs below $25k, 0.7% for AGIs $25k-50k, 0.7% for AGIs $50k-75k, 0.9% for AGIs $75k-100k, 0.9% for AGIs $100k-200k, 0.6% for AGIs over 200k)
Ordinary dividends: $5,108 (reported on 27.4% of returns)
Here:
$5,108
State:
$6,239
(% of AGI for various income ranges: 2.4% for AGIs below $25k, 1.5% for AGIs $25k-50k, 1.5% for AGIs $50k-75k, 1.8% for AGIs $75k-100k, 2.4% for AGIs $100k-200k, 4.6% for AGIs over 200k)
Net capital gain/loss in AGI: +$4,853 (reported on 20.7% of returns)
Here:
+$4,853
State:
+$11,336
(% of AGI for various income ranges: 0.2% for AGIs $25k-50k, 0.8% for AGIs $50k-75k, 1.5% for AGIs $75k-100k, 1.2% for AGIs $100k-200k, 5.9% for AGIs over 200k)
Profit/loss from business: +$12,213 (reported on 13.9% of returns)
Here:
+$12,213
State:
+$10,862
(% of AGI for various income ranges: 4.6% for AGIs below $25k, 2.5% for AGIs $25k-50k, 2.1% for AGIs $50k-75k, 2.7% for AGIs $75k-100k, 2.5% for AGIs $100k-200k, 4.1% for AGIs over 200k)
Taxable individual retirement arrangement distribution: $13,662 (reported on 14.0% of returns)
40242:
$13,662
Kentucky:
$14,296
(% of AGI for various income ranges: 3.8% for AGIs below $25k, 3.2% for AGIs $25k-50k, 3.5% for AGIs $50k-75k, 4.4% for AGIs $75k-100k, 2.9% for AGIs $100k-200k, 2.4% for AGIs over 200k)
Self-employment retirement plans: $15,350 (reported on 0.7% of returns)
40242:
$15,350
Kentucky:
$20,768
Total itemized deductions: $19,829 (21% of AGI, reported on 42.3% of returns)
Here:
$19,829
State:
$21,160
Here:
20.6% of AGI
State:
20.0% of AGI
(% of AGI for various income ranges: 11.2% for AGIs below $25k, 10.9% for AGIs $25k-50k, 14.4% for AGIs $50k-75k, 15.8% for AGIs $75k-100k, 15.7% for AGIs $100k-200k, 14.2% for AGIs over 200k)
Charity contributions: $3,799 (reported on 36.8% of returns)
Here:
$3,799
State:
$4,303
(% of AGI for various income ranges: 0.9% for AGIs below $25k, 1.3% for AGIs $25k-50k, 2.1% for AGIs $50k-75k, 2.5% for AGIs $75k-100k, 2.9% for AGIs $100k-200k, 3.3% for AGIs over 200k)
Taxes paid: $8,266 (reported on 42.3% of returns)
40242:
$8,266
State:
$8,496
(% of AGI for various income ranges: 1.7% for AGIs below $25k, 3.4% for AGIs $25k-50k, 5.4% for AGIs $50k-75k, 6.3% for AGIs $75k-100k, 7.6% for AGIs $100k-200k, 7.4% for AGIs over 200k)
Earned income credit: $1,843 (reported on 11.3% of returns)
Here:
$1,843
State:
$2,273
(% of AGI for various income ranges: 3.8% for AGIs below $25k, 0.6% for AGIs $25k-50k)
Percentage of individuals using paid preparers for their 2012 taxes: 46.2%
Here:
46%
State:
60%
(% for various income ranges: 40.0% for AGIs below $25k, 43.8% for AGIs $25k-50k, 50.6% for AGIs $50k-75k, 50.0% for AGIs $75k-100k, 51.4% for AGIs $100k-200k, 75.0% for AGIs over 200k)
Averages for the 2004 tax year for zip code 40242, filed in 2005:
Average Adjusted Gross Income (AGI) in 2004: $50,471 (Individual Income Tax Returns)
Here:
$50,471
State:
$41,540
Salary/wage: $43,639 (reported on 83.7% of returns)
Here:
$43,639
State:
$36,432
(% of AGI for various income ranges: 102.6% for AGIs below $10k, 71.2% for AGIs $10k-25k, 78.1% for AGIs $25k-50k, 73.5% for AGIs $50k-75k, 75.9% for AGIs $75k-100k, 67.1% for AGIs over 100k)
Taxable interest for individuals: $1,761 (reported on 49.7% of returns)
This zip code:
$1,761
Kentucky:
$1,571
(% of AGI for various income ranges: 6.1% for AGIs below $10k, 3.3% for AGIs $10k-25k, 1.7% for AGIs $25k-50k, 1.4% for AGIs $50k-75k, 1.6% for AGIs $75k-100k, 1.5% for AGIs over 100k)
Taxable dividends: $3,577 (reported on 33.8% of returns)
Here:
$3,577
State:
$3,453
(% of AGI for various income ranges: 5.6% for AGIs below $10k, 2.3% for AGIs $10k-25k, 1.4% for AGIs $25k-50k, 2.1% for AGIs $50k-75k, 2.0% for AGIs $75k-100k, 3.0% for AGIs over 100k)
Net capital gain/loss: +$5,847 (reported on 26.6% of returns)
Here:
+$5,847
State:
+$9,663
(% of AGI for various income ranges: -0.9% for AGIs below $10k, 0.6% for AGIs $10k-25k, 0.3% for AGIs $25k-50k, 1.3% for AGIs $50k-75k, 1.1% for AGIs $75k-100k, 6.5% for AGIs over 100k)
Profit/loss from business: +$14,317 (reported on 13.9% of returns)
Here:
+$14,317
State:
+$9,233
(% of AGI for various income ranges: 5.9% for AGIs below $10k, 4.4% for AGIs $10k-25k, 2.6% for AGIs $25k-50k, 2.4% for AGIs $50k-75k, 4.0% for AGIs $75k-100k, 5.0% for AGIs over 100k)
IRA payment deduction: $2,772 (reported on 2.8% of returns)
40242:
$2,772
Kentucky:
$2,955
(% of AGI for various income ranges: 0.2% for AGIs $10k-25k, 0.2% for AGIs $25k-50k, 0.3% for AGIs $50k-75k, 0.1% for AGIs $75k-100k, 0.1% for AGIs over 100k)
Self-employed pension: $11,197 (reported on 1.2% of returns)
Here:
$11,197
Kentucky:
$14,996
(% of AGI for various income ranges: 0.1% for AGIs $50k-75k, 0.2% for AGIs $75k-100k, 0.5% for AGIs over 100k)
Total itemized deductions: $18,066 (22% of AGI, reported on 45.4% of returns)
Here:
$18,066
State:
$17,474
Here:
22.1% of AGI
State:
21.0% of AGI
(% of AGI for various income ranges: 20.7% for AGIs below $10k, 13.0% for AGIs $10k-25k, 14.1% for AGIs $25k-50k, 17.8% for AGIs $50k-75k, 18.1% for AGIs $75k-100k, 16.2% for AGIs over 100k)
Charity contributions deductions: $3,318 (4% of AGI, reported on 42.0% of returns)
Here:
$3,318
State:
$3,494
Here:
3.9% of AGI
State:
4.0% of AGI
(% of AGI for various income ranges: 1.2% for AGIs below $10k, 1.7% for AGIs $10k-25k, 1.9% for AGIs $25k-50k, 2.8% for AGIs $50k-75k, 3.1% for AGIs $75k-100k, 3.2% for AGIs over 100k)
Total tax: $7,310 (reported on 80.6% of returns)
40242:
$7,310
State:
$6,162
(% of AGI for various income ranges: 3.1% for AGIs below $10k, 4.5% for AGIs $10k-25k, 7.5% for AGIs $25k-50k, 9.3% for AGIs $50k-75k, 10.7% for AGIs $75k-100k, 16.6% for AGIs over 100k)
Earned income credit: $1,450 (reported on 9.1% of returns)
Here:
$1,450
State:
$1,723
Percentage of individuals using paid preparers for their 2004 taxes: 52.6%
Here:
53%
State:
66%
(% for various income ranges: 44.1% for AGIs below $10k, 54.5% for AGIs $10k-25k, 54.4% for AGIs $25k-50k, 54.6% for AGIs $50k-75k, 53.0% for AGIs $75k-100k, 55.1% for AGIs over 100k)
Likely homosexual households (counted as self-reported same-sex unmarried-partner households)
Lesbian couples: 0.0% of all households
Gay men: 0.3% of all households
Household received Food Stamps/SNAP in the past 12 months: 236 Household did not receive Food Stamps/SNAP in the past 12 months: 4,759
Women who had a birth in the past 12 months: 177 (137 now married, 39 unmarried) Women who did not have a birth in the past 12 months: 2,649 (1,032 now married, 1,613 unmarried)
Housing units in zip code 40242 with a mortgage: 2,292 (283 second mortgage, 4 home equity loan, 258 both second mortgage and home equity loan) Houses without a mortgage: 83
Median monthly owner costs for units with a mortgage: $1,590 Median monthly owner costs for units without a mortgage: $664
Residents with income below the poverty level in 2022:
This zip code:
7.5%
Whole state:
16.5%
Residents with income below 50% of the poverty level in 2022:
This zip code:
2.9%
Whole state:
9.0%
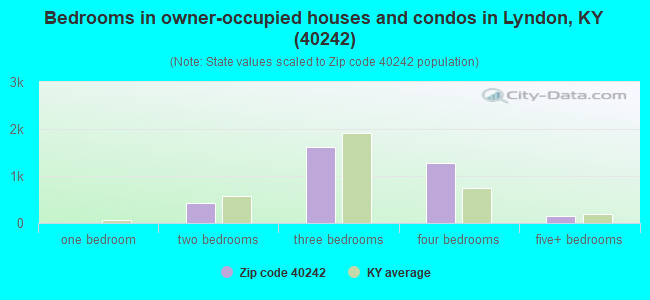
Median number of rooms in houses and condos:
Here:
7.4
State:
6.4
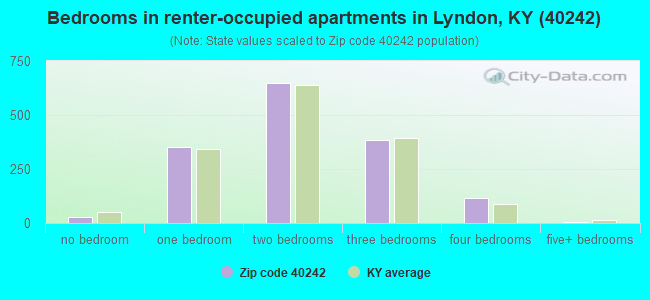
Median number of rooms in apartments:
Here:
4.7
State:
4.4
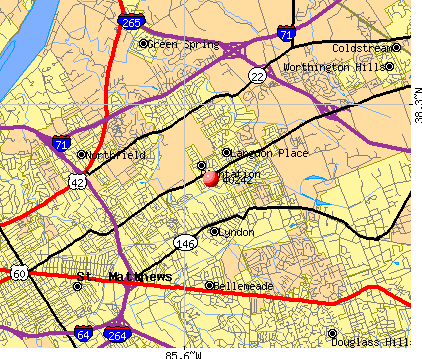
Notable locations in this zip code not listed on our city pages
Notable locations in zip code 40242: Lyndon Fire Department Station 2 (A), Worthington Fire Department Station 2 (B). Display/hide their locations on the map
In group quarters: 32 (-1 institutionalized population)
Size of family households: 1,482 2-persons, 656 3-persons, 475 4-persons, 244 5-persons, 58 6-persons, 16 7-or-more-persons
Size of nonfamily households: 1,726 1-person, 319 2-persons, 34 3-persons
1,851 married couples with children.
789 single-parent households (64 men, 725 women).
89.4% of residents of 40242 zip code speak English at home.
2.9% of residents speak Spanish at home (76% very well, 21% well, 3% not well).
1.8% of residents speak other Indo-European language at home (64% very well, 34% well, 3% not well).
2.6% of residents speak Asian or Pacific Island language at home (71% very well, 7% well, 23% not well).
3.8% of residents speak other language at home (44% very well, 39% well, 12% not well, 5% not at all).
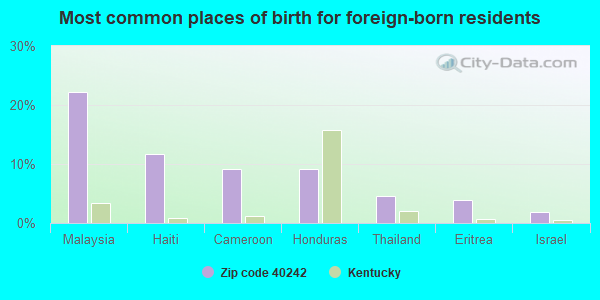
Foreign born population: 1,109 (9.6%) (34.5% of them are naturalized citizens)
This zip code:
9.6%
Whole state:
4.0%
22%Malaysia
12%Haiti
9%Cameroon
9%Honduras
5%Thailand
4%Eritrea
2%Israel
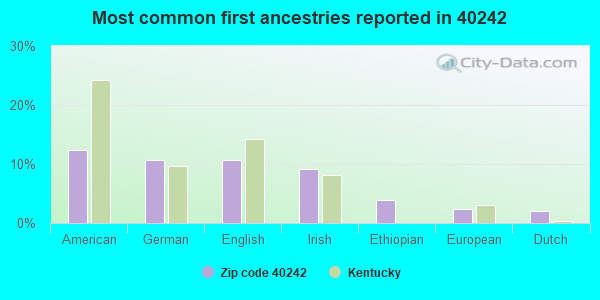
12%American
11%German
11%English
9%Irish
4%Ethiopian
2%European
2%Dutch
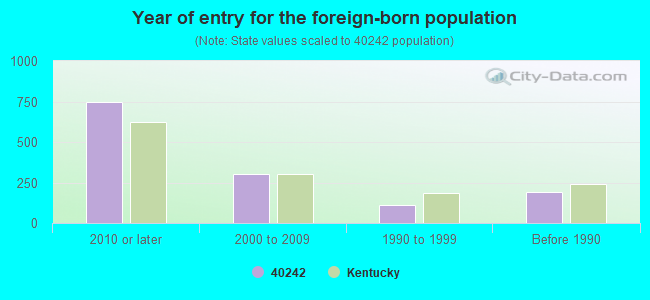
Year of entry for the foreign-born population
7442010 or later
3012000 to 2009
1121990 to 1999
191Before 1990
Facilities with environmental interests located in this zip code:
BOWEN ELEMENTARY SCHOOL (1601 ROOSEVELT AVENUE in LOUISVILLE, KY)
(National Center for Education Statistics) - STATE ID-056275094 Organizations: JEFFERSON COUNTY (SCHOOL DISTRICT)
LOUISVILLE DAY TREATMENT CENTER ALT SCH (8711 LAGRANGE RD in LOUISVILLE, KY)
(National Center for Education Statistics) - STATE ID-056275138 Organizations: JEFFERSON COUNTY (SCHOOL DISTRICT)
COPPER RIDGE AT CRAIGS CREEK (10500 BALLARDSVILLE RD in LOUISVILLE, KY)
National Pollutant Discharge Elimination System NON-MAJOR (Tracking pollutant discharge elimination systems) - permit Business SIC classification: HIGHWAY AND STREET CONSTRUCTION, EXCEPT ELEVATED HIGHWAYS
LYNDON CROSSINGS (NEW LAGRANGE RD & in LOUISVILLE, KY)
National Pollutant Discharge Elimination System NON-MAJOR (Tracking pollutant discharge elimination systems) - permit Business SIC classification: MANAGEMENT SERVICES
MAPLE BROOK REALTY LTD (I 265 & WESTPORT RD in LOUISVILLE, KY)
National Pollutant Discharge Elimination System NON-MAJOR (Tracking pollutant discharge elimination systems) - permit Business SIC classification: MANAGEMENT SERVICES
Housing units lacking complete kitchen facilities: 0.5%
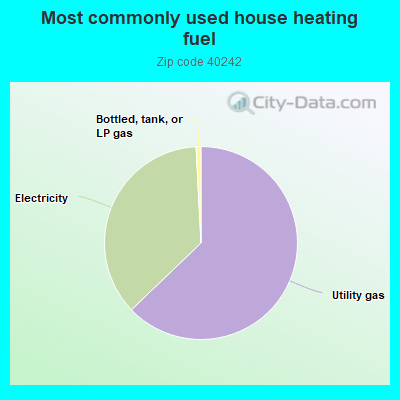
62.7%Utility gas
36.3%Electricity
0.8%Bottled, tank, or LP gas
Population in 1990: 9,742. Population change in the 1990s: +607 (+6.2%).
Place of birth for U.S.-born residents:
This state: 6,677
Northeast: 520
Midwest: 1,508
South: 1,188
West: 375
57% of the 40242 zip code residents lived in the same house 5 years ago. Out of people who lived in different houses, 60% lived in this county. Out of people who lived in different counties, 50% lived in Kentucky.
87% of the 40242 zip code residents lived in the same house 1 year ago. Out of people who lived in different houses, 59% moved from this county. Out of people who lived in different houses, 17% moved from different county within same state. Out of people who lived in different houses, 20% moved from different state. Out of people who lived in different houses, 2% moved from abroad.
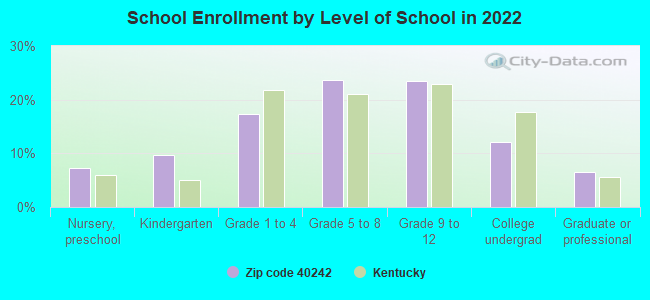
Private vs. public school enrollment:
Students in private schools in grades 1 to 8 (elementary and middle school): 267
Here:
24.8%
Kentucky:
17.2%
Students in private schools in grades 9 to 12 (high school): 217
Here:
35.1%
Kentucky:
15.2%
Students in private undergraduate colleges: 33
Here:
10.8%
Kentucky:
19.6%
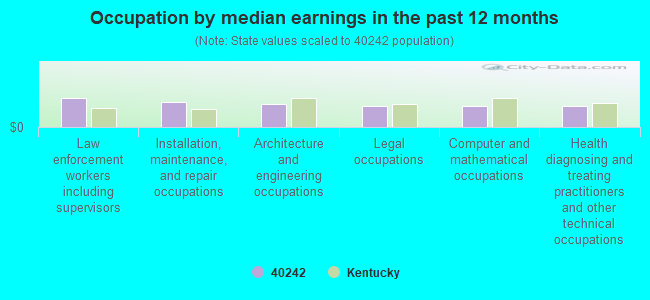
Occupation by median earnings in the past 12 months ($)
111,076Law enforcement workers including supervisors
93,341Installation, maintenance, and repair occupations
88,688Architecture and engineering occupations
80,496Legal occupations
79,953Computer and mathematical occupations
79,863Health diagnosing and treating practitioners and other technical occupations
Companies with federal contracts located in this zip code:
JOHN KAYS (2910 BROWNSBORO VISTA DR in LOUISVILLE, KY; small business) : $40,980 in 23 contractsfrom 2001 to 2005
Contracts for Chaplain Services, Personal Services Contracts by Army Signed by year:2000: $0; 2001: $13,455; 2002: $6,795; 2003: $1,050; 2004: $12,040; 2005: $7,640; 2006: $0.
Biggest contracts:
$12,300 with Army for Chaplain Services. Signed on 2001-10-09. Completion date: 2002-09-30.
$10,040, same as above.Signed on 2002-10-10. Completion date: 2003-09-30.
$4,200, same as above.Signed on 2005-10-03. Completion date: 2006-09-30.
$4,200, same as above.Signed on 2005-10-03. Completion date: 2006-09-30.
ALERT-U INC, (2411 MARYMOUNT COURT in LOUISVILLE, KY) : $14,280 in 2 contractsin 2004
$7,140 with Army for Facilities Operations Support Services. Signed on 2004-01-06. Completion date: 2004-09-30.
$7,140 with U.S. Army Corps of Engineers - civil program financing only for Facilities Operations Support Services. Signed on 2004-01-06. Completion date: 2004-09-30.
Top industries in this zip code by the number of employees in 2005:
Health Care and Social Assistance: Psychiatric and Substance Abuse Hospitals (100-249 employees: 1 establishment)
2002 - 2018 National Fire Incident Reporting System (NFIRS) incidents
According to the data from the years 2002 - 2018 the average number of fires per year is 7. The highest number of fire incidents - 25 took place in 2017, and the least - 0 in 2003. The data has a rising trend.
When looking into fire subcategories, the most incidents belonged to: Structure Fires (52.3%), and Outside Fires (27.9%).
Fire incident types reported to NFIRS in Zip Code 40242


 Nearest zip codes: 40241, 40222, 40223, 40025, 40243, 40220.
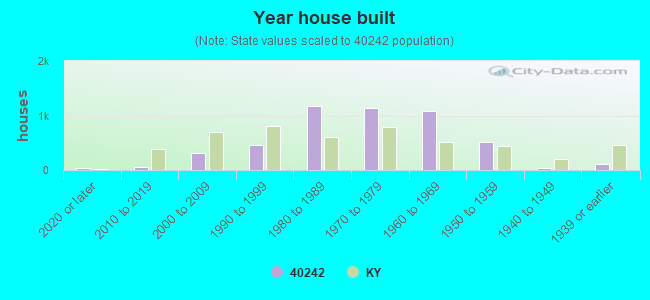


 According to the data from the years 2002 - 2018 the average number of fires per year is 7. The highest number of fire incidents - 25 took place in 2017, and the least - 0 in 2003. The data has a rising trend.
 When looking into fire subcategories, the most incidents belonged to: Structure Fires (52.3%), and Outside Fires (27.9%).