Estimated zip code population in 2022: 19,666 Zip code population in 2010: 20,869 Zip code population in 2000: 21,891
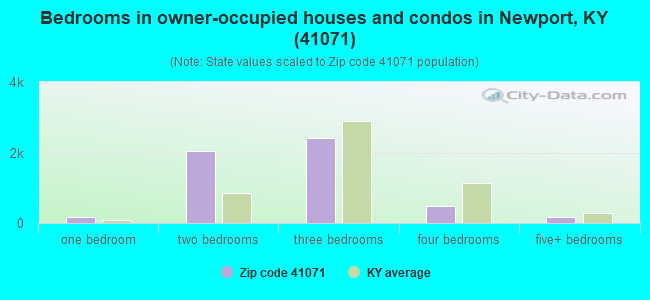
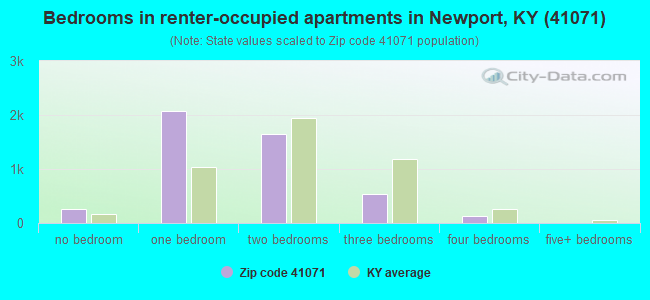
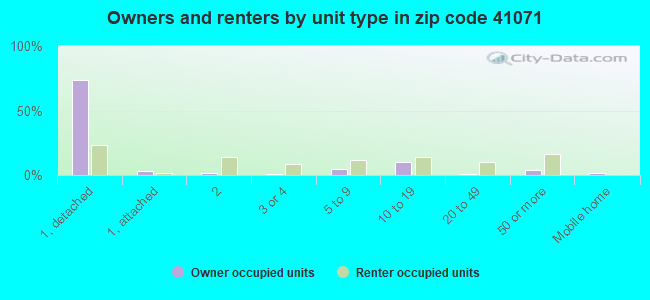
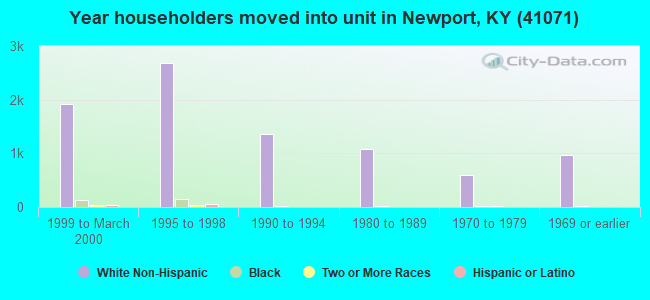
Houses and condos: 10,800 Renter-occupied apartments: 4,523
% of renters here:
46%
State:
31%
March 2022 cost of living index in zip code 41071: 88.2 (less than average, U.S. average is 100)
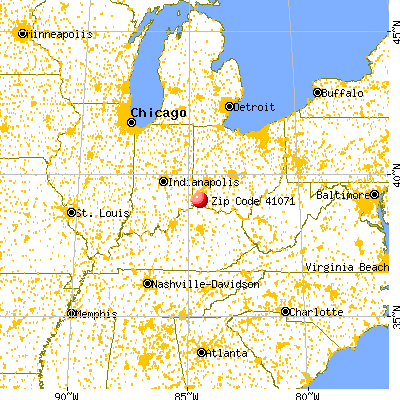
Land area: 5.4 sq. mi. Water area: 0.3 sq. mi.
Population density: 3,628 people per square mile
(average).
OSM Map
General Map
Google Map
MSN Map
OSM Map
General Map
Google Map
MSN Map
OSM Map
General Map
Google Map
MSN Map
OSM Map
General Map
Google Map
MSN Map
Please wait while loading the map...
Real estate property taxes paid for housing units in 2022:
This zip code:
1.1% ($2,051)
Kentucky:
0.7% ($1,456)
Median real estate property taxes paid for housing units with mortgages in 2022: $2,183 (1.1%) Median real estate property taxes paid for housing units with no mortgage in 2022: $1,858 (1.1%)
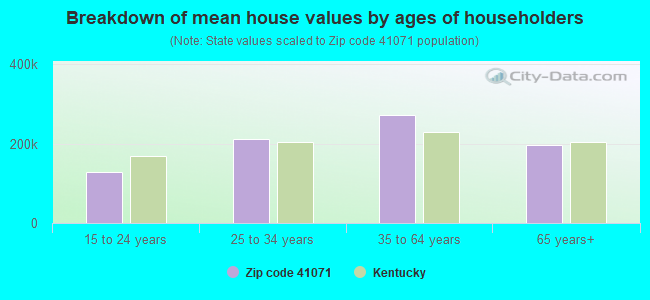
Estimated median house/condo value in 2022: $189,757
41071:
$189,757
Kentucky:
$196,300
According to our research of Kentucky and other state lists, there were 34 registered sex offenders living in 41071 zip code as of April 27, 2024. The ratio of all residents to sex offenders in zip code 41071 is 618 to 1. The ratio of registered sex offenders to all residents in this zip code is lower than the state average.
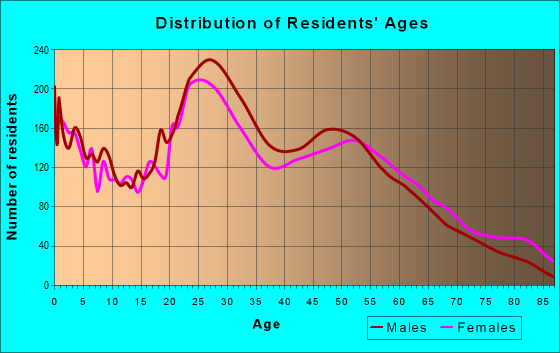
Median resident age:
This zip code:
38.4 years
Kentucky median age:
39.4 years
Average household size:
This zip code:
1.9 people
Kentucky:
2.4 people
Averages for the 2020 tax year for zip code 41071, filed in 2021:
Average Adjusted Gross Income (AGI) in 2020: $58,102 (Individual Income Tax Returns)
Here:
$58,102
State:
$61,342
Salary/wage: $50,979 (reported on 87.7% of returns)
Here:
$50,979
State:
$50,827
(% of AGI for various income ranges: 1165.8% for AGIs below $25k, 3770.2% for AGIs $25k-50k, 6729.5% for AGIs $50k-75k, 10102.3% for AGIs $75k-100k, 18650.8% for AGIs $100k-200k, 82842.7% for AGIs over 200k)
Taxable interest for individuals: $1,012 (reported on 18.7% of returns)
This zip code:
$1,012
Kentucky:
$1,441
(% of AGI for various income ranges: 4.2% for AGIs below $25k, 7.1% for AGIs $25k-50k, 18.4% for AGIs $50k-75k, 21.5% for AGIs $75k-100k, 119.2% for AGIs $100k-200k, 560.9% for AGIs over 200k)
Ordinary dividends: $6,929 (reported on 16.8% of returns)
Here:
$6,929
State:
$7,388
(% of AGI for various income ranges: 13.4% for AGIs below $25k, 23.3% for AGIs $25k-50k, 47.0% for AGIs $50k-75k, 188.5% for AGIs $75k-100k, 426.4% for AGIs $100k-200k, 6049.1% for AGIs over 200k)
Net capital gain/loss in AGI: +$14,352 (reported on 13.3% of returns)
Here:
+$14,352
State:
+$19,475
(% of AGI for various income ranges: 6.3% for AGIs below $25k, 29.7% for AGIs $25k-50k, 74.8% for AGIs $50k-75k, 156.8% for AGIs $75k-100k, 654.3% for AGIs $100k-200k, 11323.6% for AGIs over 200k)
Profit/loss from business: +$12,508 (reported on 12.1% of returns)
Here:
+$12,508
State:
+$11,386
(% of AGI for various income ranges: 91.6% for AGIs below $25k, 88.6% for AGIs $25k-50k, 128.2% for AGIs $50k-75k, 274.9% for AGIs $75k-100k, 746.6% for AGIs $100k-200k, 3177.3% for AGIs over 200k)
Taxable individual retirement arrangement distribution: $20,841 (reported on 6.3% of returns)
41071:
$20,841
Kentucky:
$18,941
(% of AGI for various income ranges: 32.9% for AGIs below $25k, 62.6% for AGIs $25k-50k, 126.9% for AGIs $50k-75k, 321.3% for AGIs $75k-100k, 761.1% for AGIs $100k-200k, 3102.7% for AGIs over 200k)
Self-employed (Keogh) retirement plans: $23,400 (reported on 0.3% of returns)
41071:
$23,400
Kentucky:
$23,933
(% of AGI for various income ranges: 132.5% for AGIs $100k-200k)
Total itemized deductions: $26,943 (reported on 5.6% of returns)
Here:
$26,943
State:
$32,473
(% of AGI for various income ranges: 15.5% for AGIs below $25k, 47.5% for AGIs $25k-50k, 120.3% for AGIs $50k-75k, 450.4% for AGIs $75k-100k, 820.0% for AGIs $100k-200k, 4730.9% for AGIs over 200k)
Charity contributions: $9,940 (reported on 4.1% of returns)
Here:
$9,940
State:
$13,472
(% of AGI for various income ranges: 6.8% for AGIs $25k-50k, 12.3% for AGIs $50k-75k, 75.7% for AGIs $75k-100k, 176.4% for AGIs $100k-200k, 2169.1% for AGIs over 200k)
Taxes paid: $8,141 (reported on 5.6% of returns)
41071:
$8,141
State:
$7,830
(% of AGI for various income ranges: 3.7% for AGIs below $25k, 11.0% for AGIs $25k-50k, 51.7% for AGIs $50k-75k, 170.6% for AGIs $75k-100k, 279.4% for AGIs $100k-200k, 1060.9% for AGIs over 200k)
Earned income credit: $2,206 (reported on 17.7% of returns)
Here:
$2,206
State:
$2,336
(% of AGI for various income ranges: 103.2% for AGIs below $25k, 47.8% for AGIs $25k-50k)
Percentage of individuals using paid preparers for their 2020 taxes: 94.4%
Here:
94%
State:
94%
(% for various income ranges: 93.4% for AGIs below $25k, 95.4% for AGIs $25k-50k, 94.1% for AGIs $50k-75k, 94.2% for AGIs $75k-100k, 94.7% for AGIs $100k-200k, 97.0% for AGIs over 200k)
Averages for the 2012 tax year for zip code 41071, filed in 2013:
Average Adjusted Gross Income (AGI) in 2012: $45,661 (Individual Income Tax Returns)
Here:
$45,661
State:
$50,814
Salary/wage: $38,840 (reported on 89.1% of returns)
Here:
$38,840
State:
$42,723
(% of AGI for various income ranges: 81.4% for AGIs below $25k, 86.0% for AGIs $25k-50k, 83.1% for AGIs $50k-75k, 82.8% for AGIs $75k-100k, 79.8% for AGIs $100k-200k, 48.2% for AGIs over 200k)
Taxable interest for individuals: $1,051 (reported on 20.3% of returns)
This zip code:
$1,051
Kentucky:
$1,381
(% of AGI for various income ranges: 0.4% for AGIs below $25k, 0.2% for AGIs $25k-50k, 0.2% for AGIs $50k-75k, 0.3% for AGIs $75k-100k, 0.4% for AGIs $100k-200k, 1.1% for AGIs over 200k)
Ordinary dividends: $5,865 (reported on 15.2% of returns)
Here:
$5,865
State:
$6,239
(% of AGI for various income ranges: 0.6% for AGIs below $25k, 0.5% for AGIs $25k-50k, 0.6% for AGIs $50k-75k, 1.1% for AGIs $75k-100k, 1.9% for AGIs $100k-200k, 5.9% for AGIs over 200k)
Net capital gain/loss in AGI: +$8,986 (reported on 9.6% of returns)
Here:
+$8,986
State:
+$11,336
(% of AGI for various income ranges: 0.3% for AGIs $25k-50k, 0.3% for AGIs $50k-75k, 0.7% for AGIs $75k-100k, 1.9% for AGIs $100k-200k, 6.7% for AGIs over 200k)
Profit/loss from business: +$11,026 (reported on 11.5% of returns)
Here:
+$11,026
State:
+$10,862
(% of AGI for various income ranges: 6.8% for AGIs below $25k, 1.9% for AGIs $25k-50k, 2.5% for AGIs $50k-75k, 2.2% for AGIs $75k-100k, 3.2% for AGIs $100k-200k, 1.4% for AGIs over 200k)
Taxable individual retirement arrangement distribution: $14,018 (reported on 6.9% of returns)
41071:
$14,018
Kentucky:
$14,296
(% of AGI for various income ranges: 1.8% for AGIs below $25k, 1.7% for AGIs $25k-50k, 2.3% for AGIs $50k-75k, 2.0% for AGIs $75k-100k, 5.0% for AGIs $100k-200k)
Self-employment retirement plans: $20,200 (reported on 0.3% of returns)
41071:
$20,200
Kentucky:
$20,768
Total itemized deductions: $20,183 (19% of AGI, reported on 24.8% of returns)
Here:
$20,183
State:
$21,160
Here:
19.1% of AGI
State:
20.0% of AGI
(% of AGI for various income ranges: 3.1% for AGIs below $25k, 7.7% for AGIs $25k-50k, 10.7% for AGIs $50k-75k, 13.3% for AGIs $75k-100k, 14.9% for AGIs $100k-200k, 14.7% for AGIs over 200k)
Charity contributions: $2,993 (reported on 19.3% of returns)
Here:
$2,993
State:
$4,303
(% of AGI for various income ranges: 0.2% for AGIs below $25k, 0.6% for AGIs $25k-50k, 1.2% for AGIs $50k-75k, 1.3% for AGIs $75k-100k, 1.9% for AGIs $100k-200k, 2.1% for AGIs over 200k)
Taxes paid: $9,181 (reported on 24.6% of returns)
41071:
$9,181
State:
$8,496
(% of AGI for various income ranges: 0.8% for AGIs below $25k, 2.8% for AGIs $25k-50k, 4.6% for AGIs $50k-75k, 6.5% for AGIs $75k-100k, 7.8% for AGIs $100k-200k, 6.8% for AGIs over 200k)
Earned income credit: $2,278 (reported on 24.0% of returns)
Here:
$2,278
State:
$2,273
(% of AGI for various income ranges: 7.8% for AGIs below $25k, 0.8% for AGIs $25k-50k)
Percentage of individuals using paid preparers for their 2012 taxes: 48.3%
Here:
48%
State:
60%
(% for various income ranges: 47.2% for AGIs below $25k, 45.3% for AGIs $25k-50k, 48.2% for AGIs $50k-75k, 54.0% for AGIs $75k-100k, 57.9% for AGIs $100k-200k, 76.9% for AGIs over 200k)
Averages for the 2004 tax year for zip code 41071, filed in 2005:
Average Adjusted Gross Income (AGI) in 2004: $35,307 (Individual Income Tax Returns)
Here:
$35,307
State:
$41,540
Salary/wage: $31,292 (reported on 90.4% of returns)
Here:
$31,292
State:
$36,432
(% of AGI for various income ranges: 89.1% for AGIs below $10k, 84.9% for AGIs $10k-25k, 88.1% for AGIs $25k-50k, 86.7% for AGIs $50k-75k, 88.3% for AGIs $75k-100k, 55.7% for AGIs over 100k)
Taxable interest for individuals: $881 (reported on 28.7% of returns)
This zip code:
$881
Kentucky:
$1,571
(% of AGI for various income ranges: 1.6% for AGIs below $10k, 1.0% for AGIs $10k-25k, 0.5% for AGIs $25k-50k, 0.3% for AGIs $50k-75k, 0.5% for AGIs $75k-100k, 1.1% for AGIs over 100k)
Taxable dividends: $2,519 (reported on 16.3% of returns)
Here:
$2,519
State:
$3,453
(% of AGI for various income ranges: 1.2% for AGIs below $10k, 0.7% for AGIs $10k-25k, 0.5% for AGIs $25k-50k, 0.7% for AGIs $50k-75k, 0.9% for AGIs $75k-100k, 2.8% for AGIs over 100k)
Net capital gain/loss: +$8,407 (reported on 10.9% of returns)
Here:
+$8,407
State:
+$9,663
(% of AGI for various income ranges: -0.1% for AGIs below $10k, 0.0% for AGIs $10k-25k, 0.5% for AGIs $25k-50k, 0.3% for AGIs $50k-75k, 0.8% for AGIs $75k-100k, 10.2% for AGIs over 100k)
Profit/loss from business: +$8,964 (reported on 9.4% of returns)
Here:
+$8,964
State:
+$9,233
(% of AGI for various income ranges: 4.6% for AGIs below $10k, 2.9% for AGIs $10k-25k, 1.5% for AGIs $25k-50k, 2.5% for AGIs $50k-75k, 1.8% for AGIs $75k-100k, 3.0% for AGIs over 100k)
IRA payment deduction: $2,523 (reported on 1.4% of returns)
41071:
$2,523
Kentucky:
$2,955
(% of AGI for various income ranges: 0.1% for AGIs $10k-25k, 0.1% for AGIs $25k-50k, 0.1% for AGIs $50k-75k, 0.2% for AGIs $75k-100k)
Self-employed pension: $9,900 (reported on 0.3% of returns)
Here:
$9,900
Kentucky:
$14,996
Total itemized deductions: $14,804 (20% of AGI, reported on 27.1% of returns)
Here:
$14,804
State:
$17,474
Here:
20.4% of AGI
State:
21.0% of AGI
(% of AGI for various income ranges: 5.4% for AGIs below $10k, 4.8% for AGIs $10k-25k, 9.3% for AGIs $25k-50k, 14.6% for AGIs $50k-75k, 16.4% for AGIs $75k-100k, 13.5% for AGIs over 100k)
Charity contributions deductions: $2,041 (3% of AGI, reported on 22.4% of returns)
Here:
$2,041
State:
$3,494
Here:
2.6% of AGI
State:
4.0% of AGI
(% of AGI for various income ranges: 0.4% for AGIs below $10k, 0.4% for AGIs $10k-25k, 0.9% for AGIs $25k-50k, 1.5% for AGIs $50k-75k, 1.9% for AGIs $75k-100k, 2.0% for AGIs over 100k)
Total tax: $5,030 (reported on 71.9% of returns)
41071:
$5,030
State:
$6,162
(% of AGI for various income ranges: 1.6% for AGIs below $10k, 4.0% for AGIs $10k-25k, 7.5% for AGIs $25k-50k, 9.6% for AGIs $50k-75k, 10.8% for AGIs $75k-100k, 19.2% for AGIs over 100k)
Earned income credit: $1,700 (reported on 21.8% of returns)
Here:
$1,700
State:
$1,723
Percentage of individuals using paid preparers for their 2004 taxes: 54.7%
Here:
55%
State:
66%
(% for various income ranges: 52.9% for AGIs below $10k, 56.4% for AGIs $10k-25k, 52.8% for AGIs $25k-50k, 56.9% for AGIs $50k-75k, 50.8% for AGIs $75k-100k, 64.2% for AGIs over 100k)
Likely homosexual households (counted as self-reported same-sex unmarried-partner households)
Lesbian couples: 0.2% of all households
Gay men: 0.1% of all households
Household received Food Stamps/SNAP in the past 12 months: 1,338 Household did not receive Food Stamps/SNAP in the past 12 months: 8,527
Women who had a birth in the past 12 months: 339 (212 now married, 126 unmarried) Women who did not have a birth in the past 12 months: 4,141 (1,541 now married, 2,592 unmarried)
Housing units in zip code 41071 with a mortgage: 3,538 (408 second mortgage, 3 home equity loan, 350 both second mortgage and home equity loan) Houses without a mortgage: 136
Median monthly owner costs for units with a mortgage: $1,299 Median monthly owner costs for units without a mortgage: $565
Residents with income below the poverty level in 2022:
This zip code:
23.2%
Whole state:
16.5%
Residents with income below 50% of the poverty level in 2022:
This zip code:
10.3%
Whole state:
9.0%
Median number of rooms in houses and condos:
Here:
6.1
State:
6.4
Median number of rooms in apartments:
Here:
3.7
State:
4.4
Notable locations in this zip code not listed on our city pages
Notable locations in zip code 41071: Baptist Home of Northern Kentucky (A), Campbell County Boys and Girls Club (B), Stained Glass Theatre (C), Newport City Hall (D), Campbell County Jail (E), Newport Fire Department Station 1 Headquarters (F), Southgate City Hall (G), Southgate Fire Department (H), Wilder Fire Department (I), Woodlawn Fire Department (J), Newport Fire Department Station 2 (K), Southgate - Wilder Emergency Medical Service (L). Display/hide their locations on the map
Churches in zip code 41071 include: Saint Therese Church (A), New Hope United Methodist Church (B), First Church of Christ Scientist (C), Saint John's United Church of Christ (D), First Presbyterian Church (E), Trinity Baptist Church (F), Corinthian Baptist Church (G), Grace United Methodist Church (H), Apostolic Temple (I). Display/hide their locations on the map
1,402 married couples with children.
1,387 single-parent households (186 men, 1,201 women).
95.7% of residents of 41071 zip code speak English at home.
2.4% of residents speak Spanish at home (70% very well, 21% well, 4% not well, 5% not at all).
1.3% of residents speak other Indo-European language at home (75% very well, 11% well, 14% not well).
0.2% of residents speak Asian or Pacific Island language at home (88% very well, 12% well).
0.2% of residents speak other language at home (100% very well).
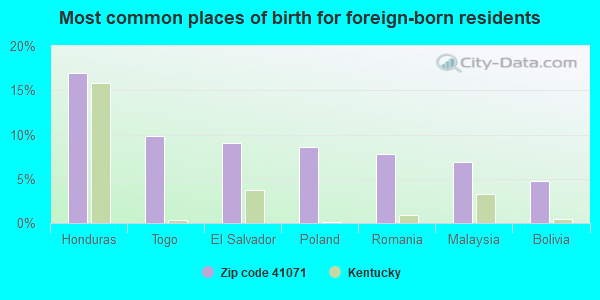
Foreign born population: 555 (2.8%) (63.5% of them are naturalized citizens)
This zip code:
2.8%
Whole state:
4.0%
17%Honduras
10%Togo
9%El Salvador
9%Poland
8%Romania
7%Malaysia
5%Bolivia
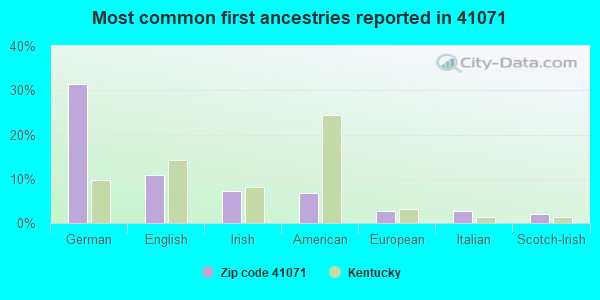
31%German
11%English
7%Irish
7%American
3%European
3%Italian
2%Scotch-Irish
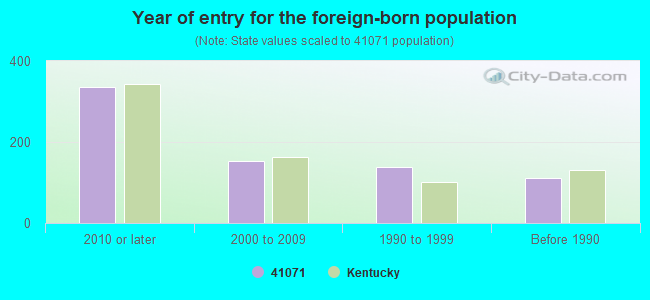
Year of entry for the foreign-born population
3362010 or later
1532000 to 2009
1381990 to 1999
112Before 1990
Major facilities with environmental interests located in this zip code:
NEWPORT STEEL CORPORATION (100 STEEL PLANT ROAD in WILDER, KY)
AIR MINOR (AIRS/AFS) (Integrated Compliance Information System) - ICIS-04-1996-0582, FORMAL ENFORCEMENT ACTION, ICIS-04-2004-1750, CRITERIA AND HAZARDOUS AIR POLLUTANT INVENTORY (Inventory of air pollution sources) National Pollutant Discharge Elimination System MAJOR (Tracking pollutant discharge elimination systems) - permit HAZARDOUS WASTE BIENNIAL REPORTER (Resource Conservation and Recovery Act (tracking hazardous waste)) - ICIS-, ENFORCEMENT/COMPLIANCE ACTIVITY Large Quantity Generators, more that 1000 kg of hazardous waste/month (Resource Conservation and Recovery Act (tracking hazardous waste)) - notification - ICIS-, ENFORCEMENT/COMPLIANCE ACTIVITY TSD (Resource Conservation and Recovery Act (tracking hazardous waste)) - notification - ICIS-, ENFORCEMENT/COMPLIANCE ACTIVITY TRI REPORTER (Tracking of toxic chemicals releasing facilities) Business SIC classification: STEEL WORKS, BLAST FURNACES (INCLUDING COKE OVENS), AND ROLLING MILLS; STEEL PIPE AND TUBES; REFUSE SYSTEMS; NONCLASSIFIABLE ESTABLISHMENTS Business NAICS classification: FABRICATED PIPE AND PIPE FITTING MANUFACTURING. Organizations: N.S. GROUP (CONTACT/OWNER)
, IPSCO TUBULARS (KY) INC (CONTACT/OWNER)
Alternative names: IPSCO TUBULARS (KY) INC, NEWPORT STEEL CORP WILDER PLANT
NEWPORT STEEL CORP/IPSCO TUBULARS (9TH AND LOWELL STREETS in NEWPORT, KY)
AIR MAJOR (AIRS/AFS) - ICIS-04-2004-1750, FORMAL ENFORCEMENT ACTION, ICIS-04-2004-1502, COMPLIANCE ACTIVITY (Tracking inspections of insecticide, fungicide, and rodenticide, and toxic substances) (Resource Conservation and Recovery Act (tracking hazardous waste)) Business SIC classification: STEEL PIPE AND TUBES Business NAICS classification: IRON AND STEEL MILLS.; ELECTROMETALLURGICAL FERROALLOY PRODUCT MANUFACTURING. Organizations: NEWPORT STEEL CORPORATION (CONTACT/OWNER)
ATLAS DRY CLEANERS (328 MONMOUTH ST in NEWPORT, KY)
AIR MINOR (AIRS/AFS) CRITERIA AND HAZARDOUS AIR POLLUTANT INVENTORY (Inventory of air pollution sources) (Resource Conservation and Recovery Act (tracking hazardous waste)) Business SIC classification: DRYCLEANING PLANTS, EXCEPT RUG CLEANING Business NAICS classification: DRYCLEANING AND LAUNDRY SERVICES (EXCEPT COIN-OPERATED). Organizations: STEPHAN HANNAH (CONTACT/OWNER)
Alternative names: ATLAS CLEANERS
A D OWENS ELEMENTARY SCHOOL (1102 YORK ST in NEWPORT, KY)
(National Center for Education Statistics) - STATE ID-019452020 Organizations: NEWPORT INDEPENDENT (SCHOOL DISTRICT)
MILDRED DEAN ELEMENTARY SCHOOL (1360 GRAND AVE in NEWPORT, KY)
(National Center for Education Statistics) - STATE ID-019452067 Organizations: NEWPORT INDEPENDENT (SCHOOL DISTRICT)
NEWPORT HIGH SCHOOL (900 E 6TH ST in NEWPORT, KY)
(National Center for Education Statistics) - STATE ID-019452070 Organizations: NEWPORT INDEPENDENT (SCHOOL DISTRICT)
CAMPBELL CO REG JUVENILE DET CTR ALT SCH (590 COLUMBIA ST in NEWPORT, KY)
(National Center for Education Statistics) - STATE ID-019091018 Organizations: CAMPBELL COUNTY (SCHOOL DISTRICT)
NEWPORT MIDDLE SCHOOL (30 W EIGHTH ST in NEWPORT, KY)
(National Center for Education Statistics) - STATE ID-019452080 Organizations: NEWPORT INDEPENDENT (SCHOOL DISTRICT)
NEWPORT ALTERNATIVE HIGH SCHOOL (30 W EIGHTH ST in NEWPORT, KY)
(National Center for Education Statistics) - STATE ID-019452068 Organizations: NEWPORT INDEPENDENT (SCHOOL DISTRICT)
NORTHERN KY LEARNING ACADEMY ALT SCH (8TH & COLUMBIA in NEWPORT, KY)
(National Center for Education Statistics) - STATE ID-019452021 Organizations: NEWPORT INDEPENDENT (SCHOOL DISTRICT)
FOURTH STREET ELEMENTARY SCHOOL (101 E FOURTH ST in NEWPORT, KY)
(National Center for Education Statistics) - STATE ID-019452040 Organizations: NEWPORT INDEPENDENT (SCHOOL DISTRICT)
ALL-RITE READY MIX INC (108 WILLIAMS WAY in WILDER, KY)
National Pollutant Discharge Elimination System NON-MAJOR (Tracking pollutant discharge elimination systems) - permit Business SIC classification: READY-MIXED CONCRETE Organizations: ALL RITE READY MIX INC (CONTACT/OWNER)
MULTI-CRAFT LITHO INC (131 E 6TH ST in NEWPORT, KY)
COMPLIANCE ACTIVITY (Tracking inspections of insecticide, fungicide, and rodenticide, and toxic substances) (Resource Conservation and Recovery Act (tracking hazardous waste)) Business NAICS classification: COMMERCIAL LITHOGRAPHIC PRINTING. Organizations: DEBORAH A. PFAFFL (CONTACT/OWNER)
Alternative names: MULTICRAFT LITHO
Housing units lacking complete plumbing facilities: 1.0% Housing units lacking complete kitchen facilities: 0.8%
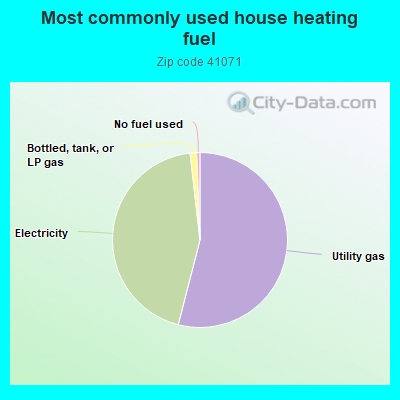
53.8%Utility gas
44.0%Electricity
1.2%Bottled, tank, or LP gas
0.6%No fuel used
Population in 1990: 22,918.
Place of birth for U.S.-born residents:
This state: 9,911
Northeast: 472
Midwest: 7,061
South: 1,086
West: 493
50% of the 41071 zip code residents lived in the same house 5 years ago. Out of people who lived in different houses, 58% lived in this county. Out of people who lived in different counties, 50% lived in Kentucky.
82% of the 41071 zip code residents lived in the same house 1 year ago. Out of people who lived in different houses, 31% moved from this county. Out of people who lived in different houses, 26% moved from different county within same state. Out of people who lived in different houses, 45% moved from different state. Out of people who lived in different houses, 0% moved from abroad.
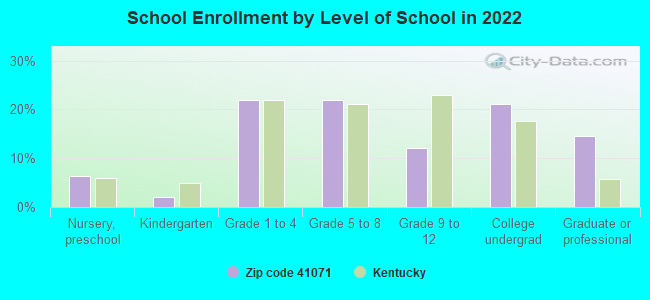
Private vs. public school enrollment:
Students in private schools in grades 1 to 8 (elementary and middle school): 535
Here:
34.0%
Kentucky:
17.2%
Students in private schools in grades 9 to 12 (high school): 87
Here:
20.3%
Kentucky:
15.2%
Students in private undergraduate colleges: 25
Here:
3.4%
Kentucky:
19.6%
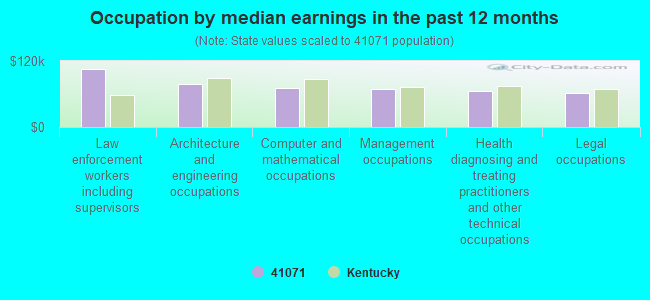
Occupation by median earnings in the past 12 months ($)
105,436Law enforcement workers including supervisors
78,006Architecture and engineering occupations
70,652Computer and mathematical occupations
68,955Management occupations
65,048Health diagnosing and treating practitioners and other technical occupations
62,573Legal occupations
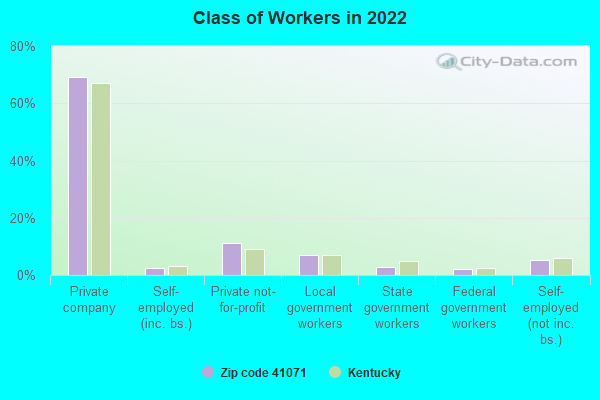
Companies with federal contracts located in this zip code:
CARDINAL LABORATORIES (104 NORTH ST in NEWPORT, KY; small business) : $19,536 in 2 contractsin 2005
$9,768 with Army for Water Quality Studies. Signed on 2005-05-23. Completion date: 2005-04-20.
$9,768 with U.S. Army Corps of Engineers - civil program financing only for Water Quality Studies. Signed on 2005-05-23. Completion date: 2005-04-20.
STEVE HAMILTON (105 BONNIE LYNN TER STE 2 in SOUTHGATE, KY; small business)
$5,024 with Navy for Other Professional Services. Signed on 2005-02-03. Completion date: 2005-02-28.
DALTON GA. CARPET OUTLET INC. (76 in NEWPORT, KY; small business)
$3,960 with Navy for Maintenance, Repair or Alteration of Real Property -- Family Housing Facilities. Taking place in GA. Signed on 2000-07-19. Completion date: 2000-07-19.
MILLER IMPRINTS (832 MONMOUTH ST in NEWPORT, KY; small business)
$3,000 with Army for Children's and Infants' Apparel and Accessories. Signed on 2004-04-05. Completion date: 2004-04-23.
Top industries in this zip code by the number of employees in 2005:
2002 - 2018 National Fire Incident Reporting System (NFIRS) incidents
Based on the data from the years 2002 - 2018 the average number of fires per year is 84. The highest number of fires - 187 took place in 2007, and the least - 6 in 2005. The data has an increasing trend.
When looking into fire subcategories, the most reports belonged to: Outside Fires (48.0%), and Structure Fires (31.7%).
Fire incident types reported to NFIRS in Zip Code 41071


 Nearest zip codes: 41014, 41073, 41075, 45202, 41099, 41074.
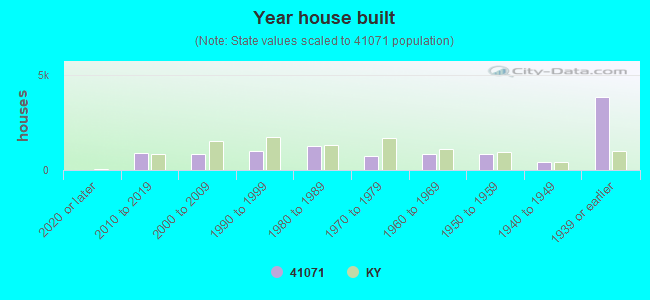


 Based on the data from the years 2002 - 2018 the average number of fires per year is 84. The highest number of fires - 187 took place in 2007, and the least - 6 in 2005. The data has an increasing trend.
 When looking into fire subcategories, the most reports belonged to: Outside Fires (48.0%), and Structure Fires (31.7%).