Estimated zip code population in 2022: 17,445 Zip code population in 2010: 16,459 Zip code population in 2000: 17,184
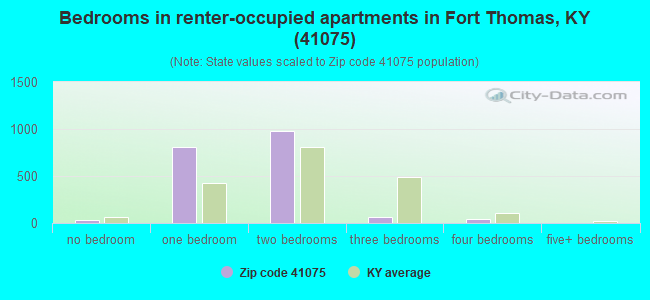
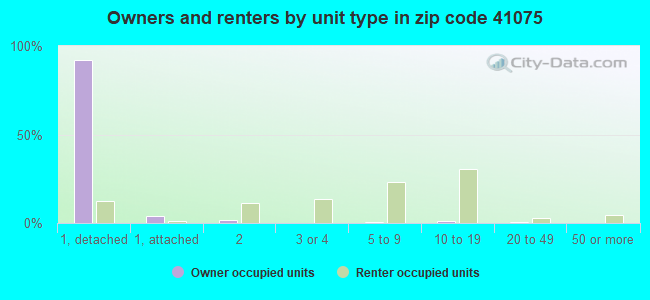
Houses and condos: 6,829 Renter-occupied apartments: 1,848
% of renters here:
27%
State:
31%
March 2022 cost of living index in zip code 41075: 88.1 (less than average, U.S. average is 100)
Land area: 6.0 sq. mi. Water area: 0.5 sq. mi.
Population density: 2,899 people per square mile
(average).
OSM Map
General Map
Google Map
MSN Map
OSM Map
General Map
Google Map
MSN Map
OSM Map
General Map
Google Map
MSN Map
OSM Map
General Map
Google Map
MSN Map
Please wait while loading the map...
Real estate property taxes paid for housing units in 2022:
This zip code:
1.2% ($3,706)
Kentucky:
0.7% ($1,456)
Median real estate property taxes paid for housing units with mortgages in 2022: $3,857 (1.2%) Median real estate property taxes paid for housing units with no mortgage in 2022: $3,455 (1.4%)
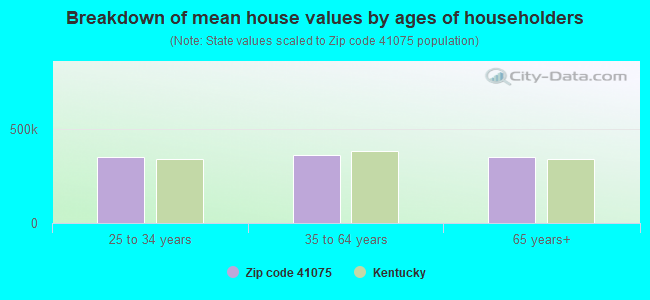
Estimated median house/condo value in 2022: $301,548
41075:
$301,548
Kentucky:
$196,300
According to our research of Kentucky and other state lists, there were 4 registered sex offenders living in 41075 zip code as of April 27, 2024. The ratio of all residents to sex offenders in zip code 41075 is 4,169 to 1. The ratio of registered sex offenders to all residents in this zip code is much lower than the state average.
Median resident age:
This zip code:
38.3 years
Kentucky median age:
39.4 years
Average household size:
This zip code:
2.5 people
Kentucky:
2.4 people
Averages for the 2020 tax year for zip code 41075, filed in 2021:
Average Adjusted Gross Income (AGI) in 2020: $106,080 (Individual Income Tax Returns)
Here:
$106,080
State:
$61,342
Salary/wage: $87,598 (reported on 83.6% of returns)
Here:
$87,598
State:
$50,827
(% of AGI for various income ranges: 1155.0% for AGIs below $25k, 3688.2% for AGIs $25k-50k, 6417.2% for AGIs $50k-75k, 9272.2% for AGIs $75k-100k, 19119.5% for AGIs $100k-200k, 92927.8% for AGIs over 200k)
Taxable interest for individuals: $1,658 (reported on 34.4% of returns)
This zip code:
$1,658
Kentucky:
$1,441
(% of AGI for various income ranges: 17.1% for AGIs below $25k, 22.0% for AGIs $25k-50k, 50.5% for AGIs $50k-75k, 58.0% for AGIs $75k-100k, 103.6% for AGIs $100k-200k, 903.7% for AGIs over 200k)
Ordinary dividends: $9,565 (reported on 34.3% of returns)
Here:
$9,565
State:
$7,388
(% of AGI for various income ranges: 61.3% for AGIs below $25k, 98.3% for AGIs $25k-50k, 192.7% for AGIs $50k-75k, 254.3% for AGIs $75k-100k, 648.0% for AGIs $100k-200k, 5748.9% for AGIs over 200k)
Net capital gain/loss in AGI: +$21,152 (reported on 28.2% of returns)
Here:
+$21,152
State:
+$19,475
(% of AGI for various income ranges: 31.3% for AGIs below $25k, 57.2% for AGIs $25k-50k, 118.2% for AGIs $50k-75k, 250.6% for AGIs $75k-100k, 712.7% for AGIs $100k-200k, 14114.8% for AGIs over 200k)
Profit/loss from business: +$18,310 (reported on 14.6% of returns)
Here:
+$18,310
State:
+$11,386
(% of AGI for various income ranges: 89.9% for AGIs below $25k, 102.2% for AGIs $25k-50k, 190.4% for AGIs $50k-75k, 353.5% for AGIs $75k-100k, 597.8% for AGIs $100k-200k, 3765.9% for AGIs over 200k)
Taxable individual retirement arrangement distribution: $23,973 (reported on 12.2% of returns)
41075:
$23,973
Kentucky:
$18,941
(% of AGI for various income ranges: 78.1% for AGIs below $25k, 125.9% for AGIs $25k-50k, 276.9% for AGIs $50k-75k, 564.8% for AGIs $75k-100k, 841.3% for AGIs $100k-200k, 2889.3% for AGIs over 200k)
Self-employed (Keogh) retirement plans: $24,122 (reported on 1.1% of returns)
41075:
$24,122
Kentucky:
$23,933
(% of AGI for various income ranges: 63.9% for AGIs $75k-100k, 676.3% for AGIs over 200k)
Total itemized deductions: $35,818 (reported on 11.3% of returns)
Here:
$35,818
State:
$32,473
(% of AGI for various income ranges: 51.7% for AGIs below $25k, 113.3% for AGIs $25k-50k, 262.7% for AGIs $50k-75k, 477.6% for AGIs $75k-100k, 801.2% for AGIs $100k-200k, 6850.0% for AGIs over 200k)
Charity contributions: $14,840 (reported on 9.6% of returns)
Here:
$14,840
State:
$13,472
(% of AGI for various income ranges: 7.0% for AGIs below $25k, 21.1% for AGIs $25k-50k, 38.5% for AGIs $50k-75k, 80.0% for AGIs $75k-100k, 228.1% for AGIs $100k-200k, 3065.2% for AGIs over 200k)
Taxes paid: $8,698 (reported on 11.3% of returns)
41075:
$8,698
State:
$7,830
(% of AGI for various income ranges: 7.9% for AGIs below $25k, 27.9% for AGIs $25k-50k, 79.7% for AGIs $50k-75k, 167.8% for AGIs $75k-100k, 247.3% for AGIs $100k-200k, 1343.7% for AGIs over 200k)
Earned income credit: $1,845 (reported on 6.9% of returns)
Here:
$1,845
State:
$2,336
(% of AGI for various income ranges: 46.4% for AGIs below $25k, 35.9% for AGIs $25k-50k)
Percentage of individuals using paid preparers for their 2020 taxes: 92.7%
Here:
93%
State:
94%
(% for various income ranges: 91.1% for AGIs below $25k, 92.0% for AGIs $25k-50k, 93.6% for AGIs $50k-75k, 93.8% for AGIs $75k-100k, 93.3% for AGIs $100k-200k, 94.4% for AGIs over 200k)
Averages for the 2012 tax year for zip code 41075, filed in 2013:
Average Adjusted Gross Income (AGI) in 2012: $76,089 (Individual Income Tax Returns)
Here:
$76,089
State:
$50,814
Salary/wage: $63,251 (reported on 84.5% of returns)
Here:
$63,251
State:
$42,723
(% of AGI for various income ranges: 72.4% for AGIs below $25k, 75.8% for AGIs $25k-50k, 76.4% for AGIs $50k-75k, 75.6% for AGIs $75k-100k, 76.8% for AGIs $100k-200k, 57.7% for AGIs over 200k)
Taxable interest for individuals: $1,449 (reported on 40.1% of returns)
This zip code:
$1,449
Kentucky:
$1,381
(% of AGI for various income ranges: 1.4% for AGIs below $25k, 0.9% for AGIs $25k-50k, 0.6% for AGIs $50k-75k, 0.7% for AGIs $75k-100k, 0.5% for AGIs $100k-200k, 0.9% for AGIs over 200k)
Ordinary dividends: $6,808 (reported on 34.2% of returns)
Here:
$6,808
State:
$6,239
(% of AGI for various income ranges: 3.2% for AGIs below $25k, 2.5% for AGIs $25k-50k, 2.2% for AGIs $50k-75k, 2.2% for AGIs $75k-100k, 2.0% for AGIs $100k-200k, 4.9% for AGIs over 200k)
Net capital gain/loss in AGI: +$9,177 (reported on 23.9% of returns)
Here:
+$9,177
State:
+$11,336
(% of AGI for various income ranges: 0.6% for AGIs $25k-50k, 1.1% for AGIs $50k-75k, 1.0% for AGIs $75k-100k, 1.3% for AGIs $100k-200k, 7.0% for AGIs over 200k)
Profit/loss from business: +$18,042 (reported on 14.5% of returns)
Here:
+$18,042
State:
+$10,862
(% of AGI for various income ranges: 4.6% for AGIs below $25k, 2.8% for AGIs $25k-50k, 3.3% for AGIs $50k-75k, 3.4% for AGIs $75k-100k, 3.6% for AGIs $100k-200k, 3.3% for AGIs over 200k)
Taxable individual retirement arrangement distribution: $16,286 (reported on 13.5% of returns)
41075:
$16,286
Kentucky:
$14,296
(% of AGI for various income ranges: 5.5% for AGIs below $25k, 3.5% for AGIs $25k-50k, 2.9% for AGIs $50k-75k, 2.9% for AGIs $75k-100k, 3.3% for AGIs $100k-200k, 2.0% for AGIs over 200k)
Self-employment retirement plans: $19,267 (reported on 1.1% of returns)
41075:
$19,267
Kentucky:
$20,768
(% of AGI for various income ranges: 0.4% for AGIs $25k-50k, 0.3% for AGIs $100k-200k, 0.5% for AGIs over 200k)
Total itemized deductions: $24,934 (19% of AGI, reported on 45.6% of returns)
Here:
$24,934
State:
$21,160
Here:
19.0% of AGI
State:
20.0% of AGI
(% of AGI for various income ranges: 10.5% for AGIs below $25k, 11.2% for AGIs $25k-50k, 14.7% for AGIs $50k-75k, 16.4% for AGIs $75k-100k, 17.4% for AGIs $100k-200k, 14.0% for AGIs over 200k)
Charity contributions: $4,150 (reported on 39.6% of returns)
Here:
$4,150
State:
$4,303
(% of AGI for various income ranges: 0.9% for AGIs below $25k, 1.3% for AGIs $25k-50k, 1.5% for AGIs $50k-75k, 1.7% for AGIs $75k-100k, 2.5% for AGIs $100k-200k, 2.7% for AGIs over 200k)
Taxes paid: $12,241 (reported on 45.4% of returns)
41075:
$12,241
State:
$8,496
(% of AGI for various income ranges: 2.1% for AGIs below $25k, 3.6% for AGIs $25k-50k, 6.2% for AGIs $50k-75k, 7.6% for AGIs $75k-100k, 8.9% for AGIs $100k-200k, 8.0% for AGIs over 200k)
Earned income credit: $1,850 (reported on 9.5% of returns)
Here:
$1,850
State:
$2,273
(% of AGI for various income ranges: 3.5% for AGIs below $25k, 0.6% for AGIs $25k-50k)
Percentage of individuals using paid preparers for their 2012 taxes: 49.7%
Here:
50%
State:
60%
(% for various income ranges: 43.1% for AGIs below $25k, 46.3% for AGIs $25k-50k, 51.8% for AGIs $50k-75k, 52.9% for AGIs $75k-100k, 56.1% for AGIs $100k-200k, 73.2% for AGIs over 200k)
Averages for the 2004 tax year for zip code 41075, filed in 2005:
Average Adjusted Gross Income (AGI) in 2004: $63,930 (Individual Income Tax Returns)
Here:
$63,930
State:
$41,540
Salary/wage: $49,188 (reported on 83.2% of returns)
Here:
$49,188
State:
$36,432
(% of AGI for various income ranges: 100.3% for AGIs below $10k, 71.1% for AGIs $10k-25k, 78.1% for AGIs $25k-50k, 78.3% for AGIs $50k-75k, 80.7% for AGIs $75k-100k, 50.5% for AGIs over 100k)
Taxable interest for individuals: $1,685 (reported on 52.0% of returns)
This zip code:
$1,685
Kentucky:
$1,571
(% of AGI for various income ranges: 5.5% for AGIs below $10k, 4.3% for AGIs $10k-25k, 1.9% for AGIs $25k-50k, 1.6% for AGIs $50k-75k, 0.9% for AGIs $75k-100k, 1.0% for AGIs over 100k)
Taxable dividends: $5,503 (reported on 40.4% of returns)
Here:
$5,503
State:
$3,453
(% of AGI for various income ranges: 7.1% for AGIs below $10k, 3.3% for AGIs $10k-25k, 2.3% for AGIs $25k-50k, 2.3% for AGIs $50k-75k, 2.0% for AGIs $75k-100k, 4.4% for AGIs over 100k)
Net capital gain/loss: +$6,526 (reported on 29.2% of returns)
Here:
+$6,526
State:
+$9,663
(% of AGI for various income ranges: -2.9% for AGIs below $10k, 1.0% for AGIs $10k-25k, 0.9% for AGIs $25k-50k, 1.1% for AGIs $50k-75k, 1.6% for AGIs $75k-100k, 4.7% for AGIs over 100k)
Profit/loss from business: +$20,461 (reported on 13.8% of returns)
Here:
+$20,461
State:
+$9,233
(% of AGI for various income ranges: 4.5% for AGIs below $10k, 3.8% for AGIs $10k-25k, 2.7% for AGIs $25k-50k, 3.0% for AGIs $50k-75k, 2.9% for AGIs $75k-100k, 5.7% for AGIs over 100k)
Profit/loss from farming: +$500 (reported on 0.2% of returns)
Here:
+$500
State:
-$5,660
IRA payment deduction: $2,929 (reported on 2.6% of returns)
41075:
$2,929
Kentucky:
$2,955
(% of AGI for various income ranges: 0.2% for AGIs $10k-25k, 0.3% for AGIs $25k-50k, 0.2% for AGIs $50k-75k, 0.2% for AGIs $75k-100k, 0.1% for AGIs over 100k)
Self-employed pension: $17,176 (reported on 1.7% of returns)
Here:
$17,176
Kentucky:
$14,996
(% of AGI for various income ranges: 0.1% for AGIs $25k-50k, 0.2% for AGIs $50k-75k, 0.2% for AGIs $75k-100k, 0.7% for AGIs over 100k)
Total itemized deductions: $20,644 (19% of AGI, reported on 46.4% of returns)
Here:
$20,644
State:
$17,474
Here:
18.6% of AGI
State:
21.0% of AGI
(% of AGI for various income ranges: 11.0% for AGIs below $10k, 12.8% for AGIs $10k-25k, 13.7% for AGIs $25k-50k, 17.7% for AGIs $50k-75k, 18.8% for AGIs $75k-100k, 13.8% for AGIs over 100k)
Charity contributions deductions: $3,364 (3% of AGI, reported on 42.6% of returns)
Here:
$3,364
State:
$3,494
Here:
2.9% of AGI
State:
4.0% of AGI
(% of AGI for various income ranges: 0.7% for AGIs below $10k, 1.8% for AGIs $10k-25k, 1.6% for AGIs $25k-50k, 2.1% for AGIs $50k-75k, 2.4% for AGIs $75k-100k, 2.5% for AGIs over 100k)
Total tax: $10,397 (reported on 81.4% of returns)
41075:
$10,397
State:
$6,162
(% of AGI for various income ranges: 2.7% for AGIs below $10k, 4.5% for AGIs $10k-25k, 7.7% for AGIs $25k-50k, 8.6% for AGIs $50k-75k, 9.8% for AGIs $75k-100k, 17.9% for AGIs over 100k)
Earned income credit: $1,434 (reported on 7.3% of returns)
Here:
$1,434
State:
$1,723
Percentage of individuals using paid preparers for their 2004 taxes: 51.2%
Here:
51%
State:
66%
(% for various income ranges: 42.1% for AGIs below $10k, 52.8% for AGIs $10k-25k, 50.0% for AGIs $25k-50k, 51.1% for AGIs $50k-75k, 52.5% for AGIs $75k-100k, 62.9% for AGIs over 100k)
Likely homosexual households (counted as self-reported same-sex unmarried-partner households)
Lesbian couples: 0.1% of all households
Gay men: 0.0% of all households
Household received Food Stamps/SNAP in the past 12 months: 66 Household did not receive Food Stamps/SNAP in the past 12 months: 6,721
Women who had a birth in the past 12 months: 269 (263 now married, 0 unmarried) Women who did not have a birth in the past 12 months: 3,359 (1,550 now married, 1,809 unmarried)
Housing units in zip code 41075 with a mortgage: 3,172 (584 second mortgage, 499 both second mortgage and home equity loan) Houses without a mortgage: 75
Median monthly owner costs for units with a mortgage: $1,795 Median monthly owner costs for units without a mortgage: $675
Residents with income below the poverty level in 2022:
This zip code:
6.0%
Whole state:
16.5%
Residents with income below 50% of the poverty level in 2022:
This zip code:
2.9%
Whole state:
9.0%
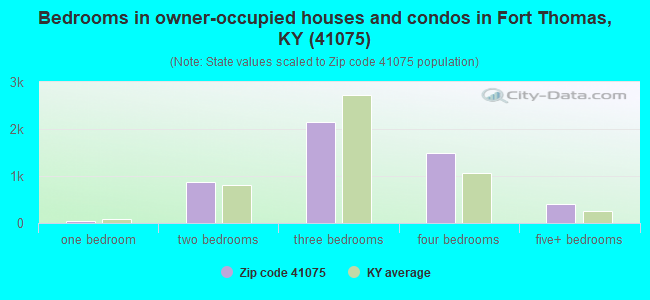
Median number of rooms in houses and condos:
Here:
7.2
State:
6.4
Median number of rooms in apartments:
Here:
4.2
State:
4.4
Notable locations in this zip code not listed on our city pages
Notable locations in zip code 41075: Highland Country Club (A), Covington Filtration Plant (B), Carmel Manor Nursing Home (C), Fort Thomas Fire Department (D). Display/hide their locations on the map
Churches in zip code 41075 include: Sisters of the Good Shepherd Convent (A), Saint Thomas Church (B), Saint Paul United Church of Christ (C), Saint Catherine of Siena Church (D), Saint Andrews Episcopal Church (E), Kingdom Hall of Jehovahs Witnesses (F), Highland United Methodist Church (G), Highland Hills Baptist Church (H), Highland Avenue Baptist Tabernacle (I). Display/hide their locations on the map
In group quarters: 372 (-1 institutionalized population)
Size of family households: 1,894 2-persons, 864 3-persons, 1,098 4-persons, 418 5-persons, 171 6-persons, 137 7-or-more-persons
Size of nonfamily households: 2,004 1-person, 190 2-persons, 18 3-persons
3,099 married couples with children.
786 single-parent households (202 men, 584 women).
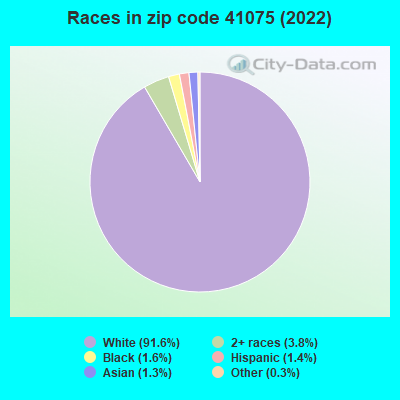
95.9% of residents of 41075 zip code speak English at home.
1.3% of residents speak Spanish at home (97% very well, 3% not well).
1.2% of residents speak other Indo-European language at home (100% very well).
1.2% of residents speak Asian or Pacific Island language at home (43% very well, 14% well, 41% not well, 3% not at all).
0.2% of residents speak other language at home (100% very well).
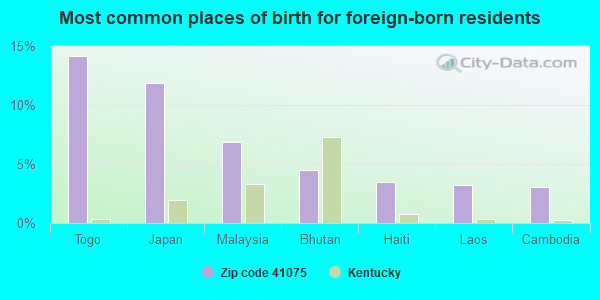
Foreign born population: 452 (2.6%) (55.2% of them are naturalized citizens)
This zip code:
2.6%
Whole state:
4.0%
14%Togo
12%Japan
7%Malaysia
5%Bhutan
3%Haiti
3%Laos
3%Cambodia
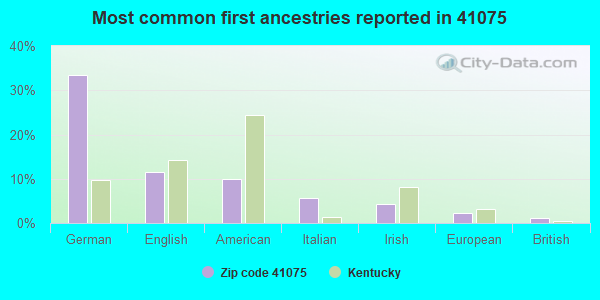
33%German
12%English
10%American
6%Italian
4%Irish
2%European
1%British
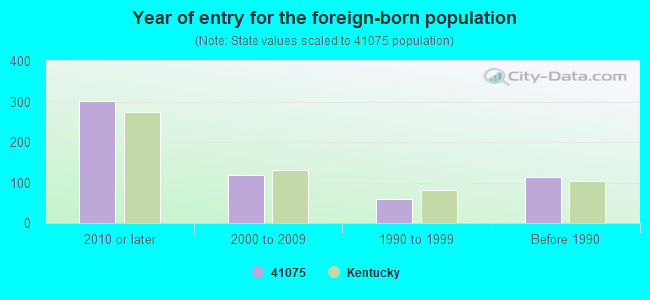
Year of entry for the foreign-born population
3002010 or later
1182000 to 2009
591990 to 1999
114Before 1990
Facilities with environmental interests located in this zip code:
MOYER ELEMENTARY SCHOOL (219 HIGHLAND AVE in FT THOMAS, KY)
(National Center for Education Statistics) - STATE ID-019176030 Organizations: FORT THOMAS INDEPENDENT (SCHOOL DISTRICT)
AMSA 71 (75 CARMEL MANOR DRIVE in FORT THOMAS, KY) . Federal Facility. U.S. ARMY
National Pollutant Discharge Elimination System NON-MAJOR (Tracking pollutant discharge elimination systems) - permit Conditionally Exempt Small Quantity Generators, less than 100 kg/month of hazardous waste (Resource Conservation and Recovery Act (tracking hazardous waste)) - notification Business SIC classification: TERMINAL AND JOINT TERMINAL MAINTENANCE FACILITIES FOR MOTOR FREIGHT TRANSPORTATION Organizations: DEPT OF THE ARMY (CONTACT/OWNER)
Alternative names: AMSA #71 (G), BLDG #100
FT.THOMAS CARRYOUT (2179 MEMORIAL PARKWAY in FORT THOMAS, KY)
AIR MINOR (AIRS/AFS) CRITERIA AND HAZARDOUS AIR POLLUTANT INVENTORY (Inventory of air pollution sources) Business SIC classification: GASOLINE SERVICE STATIONS
BP OIL COMPANY (709 HIGHLAND AVE. in FORT THOMAS, KY)
AIR MINOR (AIRS/AFS) CRITERIA AND HAZARDOUS AIR POLLUTANT INVENTORY (Inventory of air pollution sources) Business SIC classification: GASOLINE SERVICE STATIONS
CHEVRON USA, INC. (670 HIGHLAND AVE. in FORT THOMAS, KY)
AIR MINOR (AIRS/AFS) Business SIC classification: GASOLINE SERVICE STATIONS
CITY OF FT. THOMAS (CITY BUILDING in FT. THOMAS, KY)
(Resource Conservation and Recovery Act (tracking hazardous waste))
MEMORIAL VILLAGE APTS (MEMORIAL PKWY in FT THOMAS, KY)
National Pollutant Discharge Elimination System NON-MAJOR (Tracking pollutant discharge elimination systems) - permit Business SIC classification: HIGHWAY AND STREET CONSTRUCTION, EXCEPT ELEVATED HIGHWAYS
NEWPORT WTP (2055 MEMORIAL PARKWAY in FORT THOMAS, KY)
National Pollutant Discharge Elimination System NON-MAJOR (Tracking pollutant discharge elimination systems) - permit Business SIC classification: WATER SUPPLY Alternative names: NEWPORT WATER TREATMENT PLANT
NORTHERN KENTUCKY WATER DISTRICT (700 ALEXANDRIA PIKE in FORT THOMAS, KY)
(Resource Conservation and Recovery Act (tracking hazardous waste)) Alternative names: FORT THOMAS FILTRATION PLANT, SITE ID 210370003
NORTHERN KY WATER SERVICE DISTRICT (LUMLEY ST WATER STORAGE TANK in FT THOMAS, KY)
(Resource Conservation and Recovery Act (tracking hazardous waste)) Organizations: NORTHERN KENTUCKY WATER SERVICE DISTRICT (CONTACT/OWNER)
FT. THOMAS SHELL (1429 ALEXANDRIA PIKE in FT THOMAS, KY)
(Resource Conservation and Recovery Act (tracking hazardous waste)) Organizations: DENNIS BAILEY (CONTACT/OWNER)
NAGEL SERVICE STATIO (901 N.FT.THOMAS AVE. in FORT THOMAS, KY)
AIR MINOR (AIRS/AFS) Business SIC classification: GASOLINE SERVICE STATIONS
FORT THOMAS INDEPENDENT SCHOOL DISTRICT (2356 MEMORIAL PARKWAY in FORT THOMAS, KY)
COMPLIANCE ACTIVITY (Tracking inspections of insecticide, fungicide, and rodenticide, and toxic substances)
Housing units lacking complete plumbing facilities: 0.0% Housing units lacking complete kitchen facilities: 0.6%
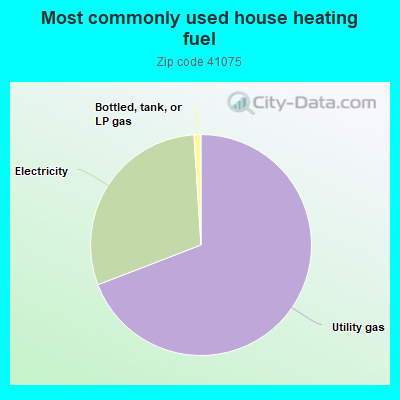
68.6%Utility gas
29.6%Electricity
1.0%Bottled, tank, or LP gas
Population in 1990: 16,165. Population change in the 1990s: +1,019 (+6.3%).
Place of birth for U.S.-born residents:
This state: 8,216
Northeast: 595
Midwest: 6,860
South: 1,040
West: 244
60% of the 41075 zip code residents lived in the same house 5 years ago. Out of people who lived in different houses, 56% lived in this county. Out of people who lived in different counties, 50% lived in Kentucky.
88% of the 41075 zip code residents lived in the same house 1 year ago. Out of people who lived in different houses, 47% moved from this county. Out of people who lived in different houses, 30% moved from different county within same state. Out of people who lived in different houses, 20% moved from different state. Out of people who lived in different houses, 3% moved from abroad.
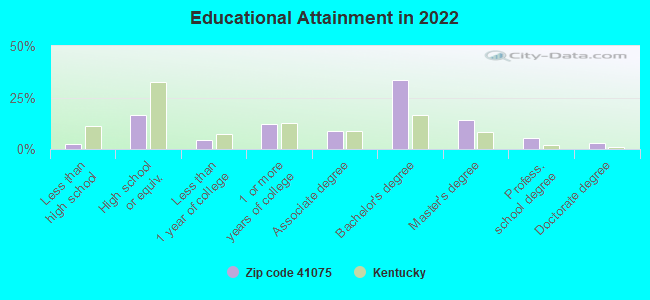
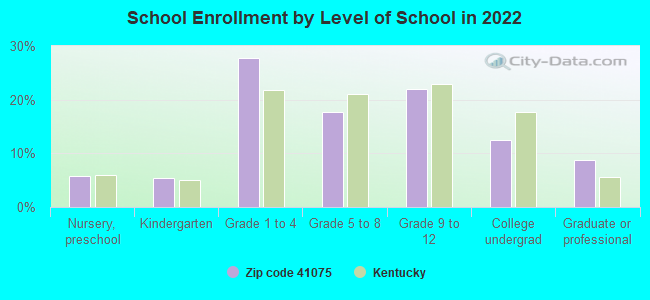
Private vs. public school enrollment:
Students in private schools in grades 1 to 8 (elementary and middle school): 319
Here:
13.9%
Kentucky:
17.2%
Students in private schools in grades 9 to 12 (high school): 95
Here:
8.6%
Kentucky:
15.2%
Students in private undergraduate colleges: 98
Here:
15.4%
Kentucky:
19.6%
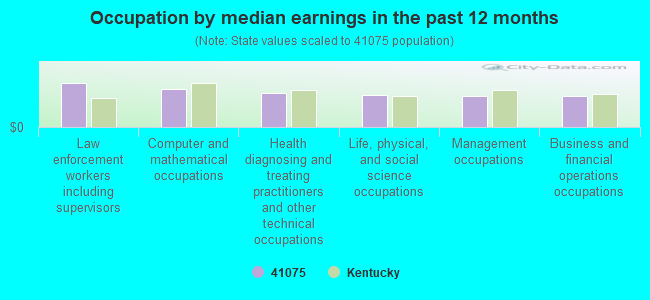
Occupation by median earnings in the past 12 months ($)
104,420Law enforcement workers including supervisors
90,646Computer and mathematical occupations
80,087Health diagnosing and treating practitioners and other technical occupations
76,526Life, physical, and social science occupations
74,480Management occupations
74,086Business and financial operations occupations
Companies with federal contracts located in this zip code:
REGAL OFFICE CLEANING SERVICE (654 HIGHLAND AVE UNIT23 in FORT THOMAS, KY; small business) : $22,742 in 7 contractsfrom 2004 to 2006
Contracts for Custodial Janitorial Services by Army, U.S. Army Corps of Engineers - civil program financing only Signed by year:2000: $0; 2001: $0; 2002: $0; 2003: $0; 2004: $18,024; 2005: $0; 2006: $4,718.
Biggest contracts:
$4,718 with Army for Custodial Janitorial Services. Signed on 2006-01-24. Completion date: 2005-03-31.
$4,584, same as above.Signed on 2004-12-17. Completion date: 2005-03-31.
$4,584 with U.S. Army Corps of Engineers - civil program financing only for Custodial Janitorial Services. Signed on 2004-12-17. Completion date: 2005-03-31.
$4,428 with Army for Custodial Janitorial Services. Signed on 2004-01-23. Completion date: 2005-03-31.
Top industries in this zip code by the number of employees in 2005:
Health Care and Social Assistance: General Medical and Surgical Hospitals (500-999 employees: 1 establishment)
Health Care and Social Assistance: Nursing Care Facilities (100-249: 2, 20-49: 1)
Health Care and Social Assistance: Home Health Care Services (100-249: 1, 20-49: 2, 10-19: 1)
2003 - 2018 National Fire Incident Reporting System (NFIRS) incidents
Based on the data from the years 2003 - 2018 the average number of fire incidents per year is 17. The highest number of reported fires - 60 took place in 2007, and the least - 0 in 2005. The data has a decreasing trend.
When looking into fire subcategories, the most incidents belonged to: Structure Fires (42.1%), and Outside Fires (38.7%).
Fire incident types reported to NFIRS in Zip Code 41075


+$500
-$5,660
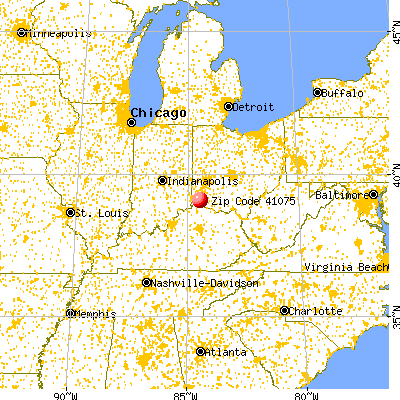
 Nearest zip codes: 41074, 41071, 41073, 45226, 41099, 41014.


 Based on the data from the years 2003 - 2018 the average number of fire incidents per year is 17. The highest number of reported fires - 60 took place in 2007, and the least - 0 in 2005. The data has a decreasing trend.
 When looking into fire subcategories, the most incidents belonged to: Structure Fires (42.1%), and Outside Fires (38.7%).