Estimated zip code population in 2022: 1,621 Zip code population in 2010: 1,300 Zip code population in 2000: 1,125
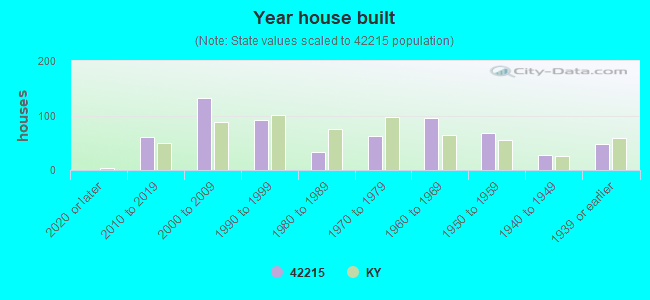
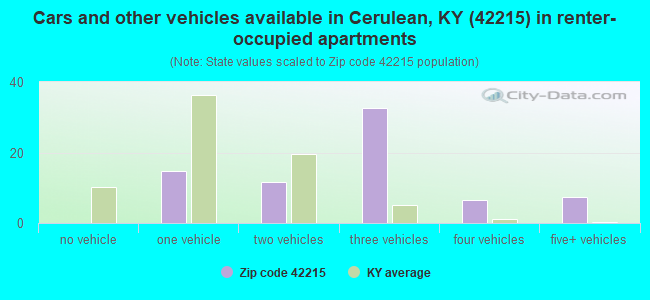
Houses and condos: 627 Renter-occupied apartments: 72
% of renters here:
12%
State:
31%
March 2022 cost of living index in zip code 42215: 82.0 (low, U.S. average is 100)
Land area: 58.6 sq. mi. Water area: 0.3 sq. mi.
Population density: 28 people per square mile
(very low).
OSM Map
General Map
Google Map
MSN Map
OSM Map
General Map
Google Map
MSN Map
OSM Map
General Map
Google Map
MSN Map
OSM Map
General Map
Google Map
MSN Map
Please wait while loading the map...
Real estate property taxes paid for housing units in 2022:
This zip code:
0.5% ($853)
Kentucky:
0.7% ($1,456)
Median real estate property taxes paid for housing units with mortgages in 2022: $944 (0.4%) Median real estate property taxes paid for housing units with no mortgage in 2022: $748 (0.5%)
Business Search- 14 Million verified businesses
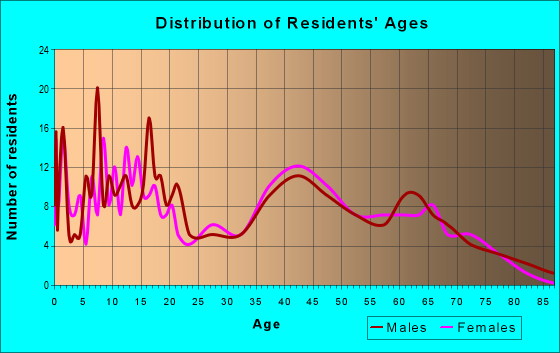
Males: 870
(53.7%)
Females: 750
(46.3%)
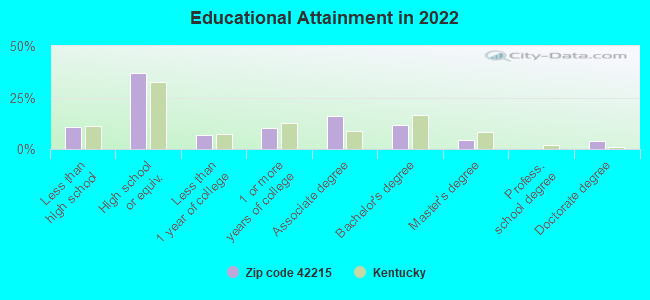
For population 25 years and over in 42215:
High school or higher: 88.6%
Bachelor's degree or higher: 19.5%
Graduate or professional degree: 8.0%
Mean travel time to work (commute): 26.0 minutes
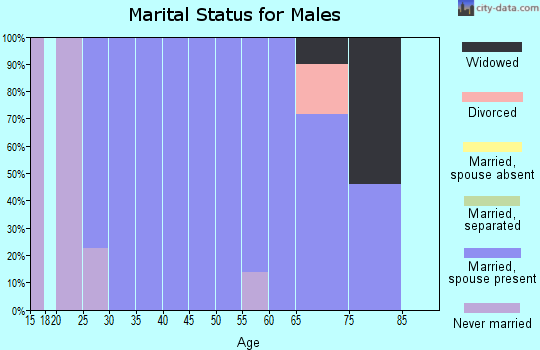
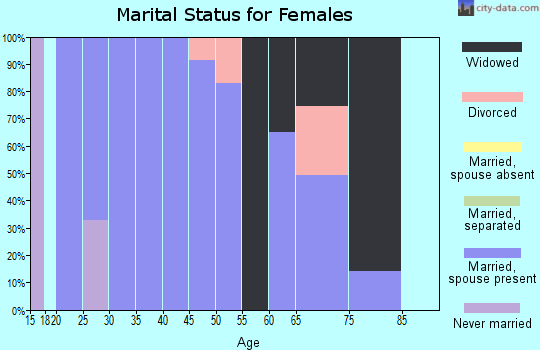
For population 15 years and over in 42215:
Never married: 29.2%
Now married: 53.6%
Separated: 1.6%
Widowed: 3.6%
Divorced: 12.0%
Zip code 42215 compared to state average:
Unemployed percentage significantly below state average.
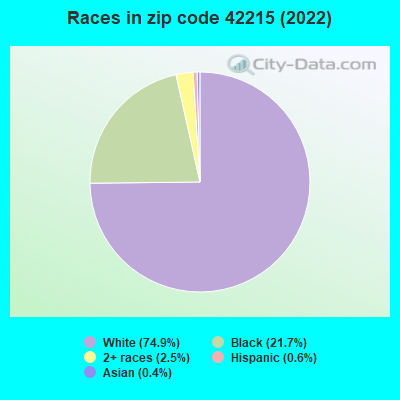
Black race population percentage above state average.
Hispanic race population percentage significantly below state average.
Median age above state average.
Foreign-born population percentage significantly below state average.
Renting percentage significantly below state average.
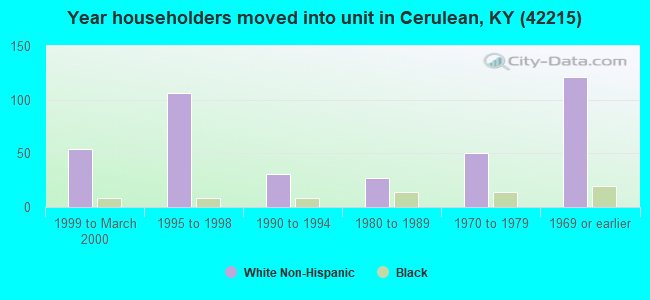
Length of stay since moving in significantly above state average.
Averages for the 2020 tax year for zip code 42215, filed in 2021:
Average Adjusted Gross Income (AGI) in 2020: $50,822 (Individual Income Tax Returns)
Here:
$50,822
State:
$61,342
Salary/wage: $44,782 (reported on 70.9% of returns)
Here:
$44,782
State:
$50,827
(% of AGI for various income ranges: 1275.8% for AGIs below $25k, 3669.0% for AGIs $25k-50k, 6330.0% for AGIs $50k-75k, 6935.0% for AGIs $75k-100k, 21086.7% for AGIs $100k-200k)
Taxable interest for individuals: $1,800 (reported on 23.6% of returns)
This zip code:
$1,800
Kentucky:
$1,441
(% of AGI for various income ranges: 10.8% for AGIs below $25k, 57.0% for AGIs $25k-50k, 162.5% for AGIs $75k-100k, 330.0% for AGIs $100k-200k)
Ordinary dividends: $1,843 (reported on 12.7% of returns)
Here:
$1,843
State:
$7,388
(% of AGI for various income ranges: 15.8% for AGIs below $25k, 92.0% for AGIs $50k-75k, 213.3% for AGIs $100k-200k)
Net capital gain/loss in AGI: +$5,943 (reported on 12.7% of returns)
Here:
+$5,943
State:
+$19,475
(% of AGI for various income ranges: 34.0% for AGIs $25k-50k, 955.0% for AGIs $75k-100k)
Profit/loss from business: +$9,700 (reported on 18.2% of returns)
Here:
+$9,700
State:
+$11,386
(% of AGI for various income ranges: 226.7% for AGIs below $25k, 387.0% for AGIs $25k-50k, 777.5% for AGIs $75k-100k)
Taxable individual retirement arrangement distribution: $7,675 (reported on 7.3% of returns)
42215:
$7,675
Kentucky:
$18,941
(% of AGI for various income ranges: 307.0% for AGIs $25k-50k)
Earned income credit: $2,467 (reported on 16.4% of returns)
Here:
$2,467
State:
$2,336
(% of AGI for various income ranges: 117.5% for AGIs below $25k, 81.0% for AGIs $25k-50k)
Percentage of individuals using paid preparers for their 2020 taxes: 90.9%
Here:
91%
State:
94%
(% for various income ranges: 89.5% for AGIs below $25k, 87.5% for AGIs $25k-50k, 100.0% for AGIs $50k-75k, 83.3% for AGIs $75k-100k, 100.0% for AGIs $100k-200k)
Averages for the 2012 tax year for zip code 42215, filed in 2013:
Average Adjusted Gross Income (AGI) in 2012: $45,029 (Individual Income Tax Returns)
Here:
$45,029
State:
$50,814
Salary/wage: $38,068 (reported on 75.5% of returns)
Here:
$38,068
State:
$42,723
(% of AGI for various income ranges: 65.7% for AGIs below $25k, 69.1% for AGIs $25k-50k, 69.1% for AGIs $50k-75k, 80.8% for AGIs $75k-100k, 46.4% for AGIs $100k-200k)
Taxable interest for individuals: $1,119 (reported on 32.7% of returns)
This zip code:
$1,119
Kentucky:
$1,381
(% of AGI for various income ranges: 1.2% for AGIs below $25k, 1.6% for AGIs $25k-50k, 1.0% for AGIs $50k-75k, 0.4% for AGIs $100k-200k)
Ordinary dividends: $1,217 (reported on 12.2% of returns)
Here:
$1,217
State:
$6,239
Net capital gain/loss in AGI: +$7,286 (reported on 14.3% of returns)
Here:
+$7,286
State:
+$11,336
(% of AGI for various income ranges: 2.5% for AGIs below $25k, 4.1% for AGIs $50k-75k, 7.2% for AGIs $75k-100k)
Profit/loss from business: +$9,614 (reported on 14.3% of returns)
Here:
+$9,614
State:
+$10,862
Taxable individual retirement arrangement distribution: $9,180 (reported on 10.2% of returns)
42215:
$9,180
Kentucky:
$14,296
Total itemized deductions: $19,483 (23% of AGI, reported on 24.5% of returns)
Here:
$19,483
State:
$21,160
Here:
22.9% of AGI
State:
20.0% of AGI
(% of AGI for various income ranges: 12.7% for AGIs $25k-50k, 17.4% for AGIs $50k-75k, 14.2% for AGIs $100k-200k)
Charity contributions: $5,780 (reported on 20.4% of returns)
Here:
$5,780
State:
$4,303
(% of AGI for various income ranges: 2.5% for AGIs $25k-50k, 4.1% for AGIs $50k-75k, 4.1% for AGIs $100k-200k)
Taxes paid: $6,075 (reported on 24.5% of returns)
42215:
$6,075
State:
$8,496
(% of AGI for various income ranges: 1.8% for AGIs $25k-50k, 4.7% for AGIs $50k-75k, 6.5% for AGIs $100k-200k)
Earned income credit: $1,918 (reported on 22.4% of returns)
Here:
$1,918
State:
$2,273
(% of AGI for various income ranges: 6.1% for AGIs below $25k, 1.0% for AGIs $25k-50k)
Percentage of individuals using paid preparers for their 2012 taxes: 67.3%
Here:
67%
State:
60%
(% for various income ranges: 60.0% for AGIs below $25k, 61.5% for AGIs $25k-50k, 75.0% for AGIs $50k-75k, 100.0% for AGIs $75k-100k, 75.0% for AGIs $100k-200k)
Averages for the 2004 tax year for zip code 42215, filed in 2005:
Average Adjusted Gross Income (AGI) in 2004: $34,666 (Individual Income Tax Returns)
Here:
$34,666
State:
$41,540
Salary/wage: $32,985 (reported on 82.6% of returns)
Here:
$32,985
State:
$36,432
(% of AGI for various income ranges: 74.0% for AGIs below $10k, 74.3% for AGIs $10k-25k, 81.5% for AGIs $25k-50k, 81.4% for AGIs $50k-75k, 78.2% for AGIs $75k-100k, 63.5% for AGIs over 100k)
Taxable interest for individuals: $1,393 (reported on 38.9% of returns)
This zip code:
$1,393
Kentucky:
$1,571
(% of AGI for various income ranges: 9.1% for AGIs below $10k, 4.2% for AGIs $10k-25k, 2.0% for AGIs $25k-50k, 0.4% for AGIs $50k-75k, 0.3% for AGIs $75k-100k)
Taxable dividends: $523 (reported on 18.3% of returns)
Here:
$523
State:
$3,453
(% of AGI for various income ranges: 0.5% for AGIs below $10k, 0.5% for AGIs $10k-25k, 0.2% for AGIs $25k-50k, 0.5% for AGIs $50k-75k, 0.2% for AGIs $75k-100k)
Net capital gain/loss: +$2,113 (reported on 13.2% of returns)
Here:
+$2,113
State:
+$9,663
Profit/loss from business: +$6,233 (reported on 15.5% of returns)
Here:
+$6,233
State:
+$9,233
(% of AGI for various income ranges: 18.5% for AGIs below $10k, 3.3% for AGIs $10k-25k, 2.2% for AGIs $25k-50k, 4.3% for AGIs $50k-75k)
Total itemized deductions: $14,232 (25% of AGI, reported on 23.8% of returns)
Here:
$14,232
State:
$17,474
Here:
24.5% of AGI
State:
21.0% of AGI
(% of AGI for various income ranges: 6.9% for AGIs $10k-25k, 7.5% for AGIs $25k-50k, 10.9% for AGIs $50k-75k, 20.8% for AGIs $75k-100k)
Charity contributions deductions: $3,633 (6% of AGI, reported on 20.9% of returns)
Here:
$3,633
State:
$3,494
Here:
6.0% of AGI
State:
4.0% of AGI
(% of AGI for various income ranges: 7.0% for AGIs below $10k, 1.1% for AGIs $25k-50k, 2.5% for AGIs $50k-75k, 5.9% for AGIs $75k-100k)
Total tax: $3,416 (reported on 77.2% of returns)
42215:
$3,416
State:
$6,162
(% of AGI for various income ranges: 3.5% for AGIs below $10k, 3.2% for AGIs $10k-25k, 6.1% for AGIs $25k-50k, 8.4% for AGIs $50k-75k, 10.8% for AGIs $75k-100k, 13.4% for AGIs over 100k)
Earned income credit: $1,765 (reported on 18.1% of returns)
Here:
$1,765
State:
$1,723
Percentage of individuals using paid preparers for their 2004 taxes: 72.3%
Here:
72%
State:
66%
(% for various income ranges: 72.1% for AGIs below $10k, 69.2% for AGIs $10k-25k, 71.0% for AGIs $25k-50k, 80.0% for AGIs $50k-75k, 96.9% for AGIs $75k-100k)
Household received Food Stamps/SNAP in the past 12 months: 71 Household did not receive Food Stamps/SNAP in the past 12 months: 550
Women who had a birth in the past 12 months: 30 (21 now married, 8 unmarried) Women who did not have a birth in the past 12 months: 363 (203 now married, 161 unmarried)
Housing units in zip code 42215 with a mortgage: 280 (18 second mortgage, 18 both second mortgage and home equity loan) Median monthly owner costs for units with a mortgage: $982 Median monthly owner costs for units without a mortgage: $377
Residents with income below the poverty level in 2022:
This zip code:
15.0%
Whole state:
16.5%
Residents with income below 50% of the poverty level in 2022:
This zip code:
11.1%
Whole state:
9.0%
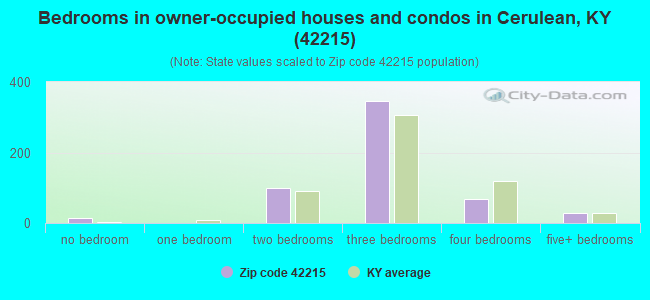
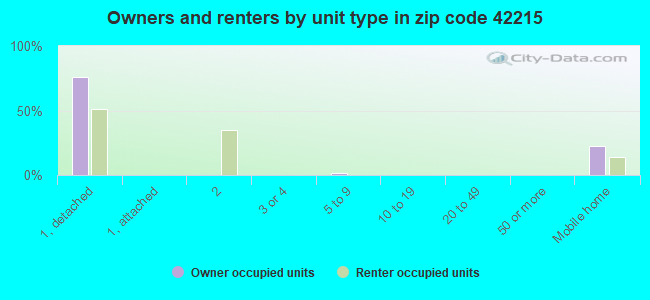
Median number of rooms in houses and condos:
Here:
6.7
State:
6.4
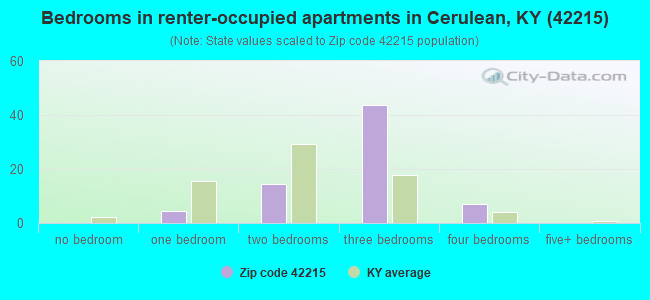
Median number of rooms in apartments:
Here:
6.1
State:
4.4
Notable locations in this zip code not listed on our city pages
Churches in zip code 42215 include: Hawkins Church (A), McCarroll Hill Baptist Church (B), Mount Carmel United Methodist Church (C), Sinking Fork Christian Church (D). Display/hide their locations on the map
Cemeteries: Thomas Cemetery (1), Turner Cemetery (2), Childress Cemetery (3), Cornelius Cemetery (4), Stewart Cemetery (5), Miller Cemetery (6), Wright Cemetery (7). Display/hide their locations on the map
Size of family households: 156 2-persons, 194 3-persons, 51 4-persons, 11 5-persons, 14 6-persons, 17 7-or-more-persons
Size of nonfamily households: 159 1-person, 17 4-persons
148 married couples with children.
20 single-parent households (20 women).
99.5% of residents of 42215 zip code speak English at home.
0.4% of residents speak Asian or Pacific Island language at home (100% very well).
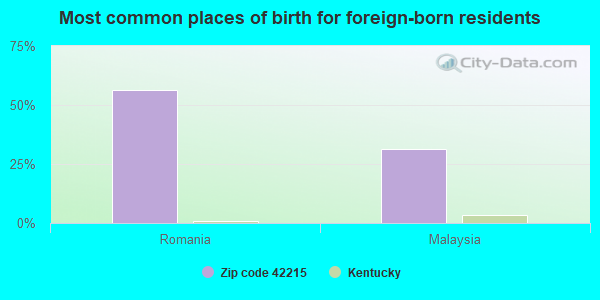
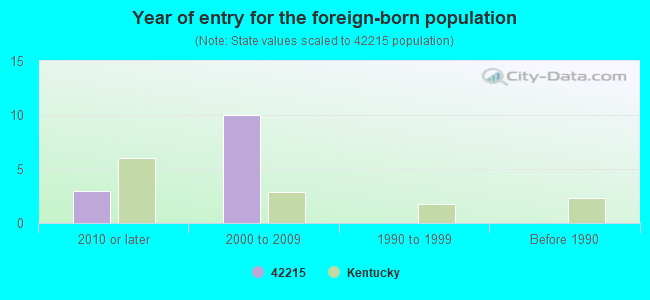
Foreign born population: 16 (1.0%) (64.5% of them are naturalized citizens)
This zip code:
1.0%
Whole state:
4.0%
56%Romania
31%Malaysia
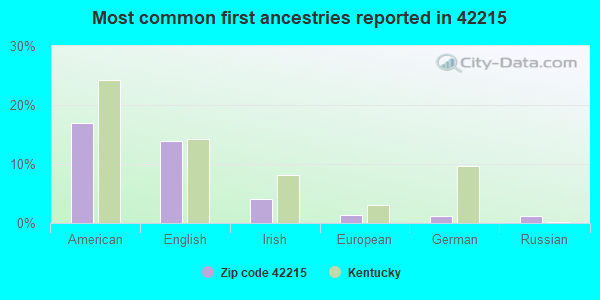
17%American
14%English
4%Irish
1%European
1%German
1%Russian
Year of entry for the foreign-born population
32010 or later
102000 to 2009
01990 to 1999
0Before 1990
Facilities with environmental interests located in this zip code:
HOADLEY PROPERTY (517 MAIN STREET in CERULEAN, KY)
(Resource Conservation and Recovery Act (tracking hazardous waste)) Organizations: JAMES HOADLEY (CONTACT/OWNER)
Housing units lacking complete plumbing facilities: 4.2% Housing units lacking complete kitchen facilities: 4.2%
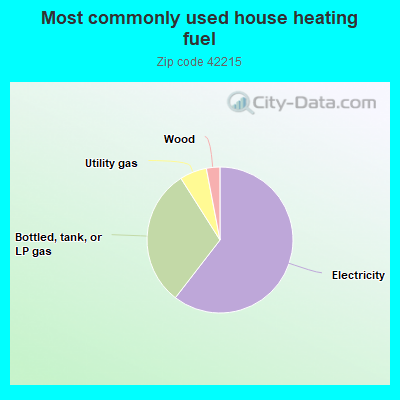
60.6%Electricity
30.6%Bottled, tank, or LP gas
6.0%Utility gas
3.0%Wood
Population in 1990: 1,654.
Place of birth for U.S.-born residents:
This state: 1,240
Northeast: 3
Midwest: 200
South: 140
West: 13
59% of the 42215 zip code residents lived in the same house 5 years ago. Out of people who lived in different houses, 82% lived in this county. Out of people who lived in different counties, 50% lived in Kentucky.
92% of the 42215 zip code residents lived in the same house 1 year ago. Out of people who lived in different houses, 18% moved from this county. Out of people who lived in different houses, 74% moved from different county within same state. Out of people who lived in different houses, 8% moved from different state.
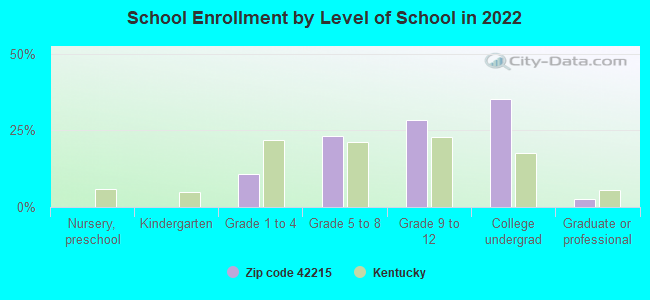
Private vs. public school enrollment:
Students in private schools in grades 1 to 8 (elementary and middle school): 78
Here:
71.7%
Kentucky:
17.2%
Students in private schools in grades 9 to 12 (high school): 4
Here:
6.0%
Kentucky:
15.2%
Students in private undergraduate colleges: 46
Here:
46.1%
Kentucky:
19.6%
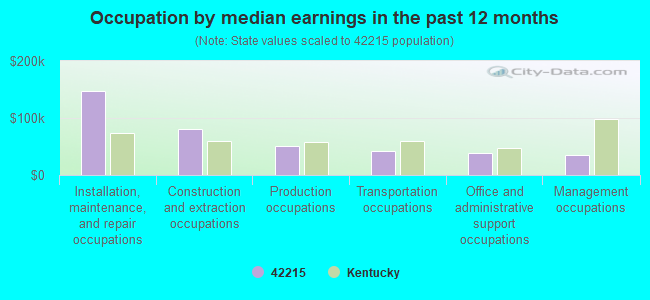
Occupation by median earnings in the past 12 months ($)
148,014Installation, maintenance, and repair occupations
81,188Construction and extraction occupations
51,321Production occupations
42,712Transportation occupations
37,797Office and administrative support occupations
35,586Management occupations
Top industries in this zip code by the number of employees in 2005:
Other Services (except Public Administration): Religious Organizations (1-4 employees: 3 establishments)
Construction: Site Preparation Contractors (1-4: 1)
Wholesale Trade: Construction and Mining (except Oil Well) Machinery and Equipment Merchant Wholesalers (1-4: 1)
Home Mortgage Disclosure Act Aggregated Statistics For Year 2009 (Based on 2 partial tracts)
A) FHA, FSA/RHS & VA Home Purchase Loans
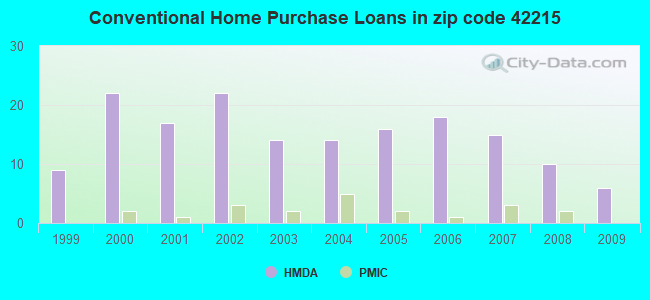
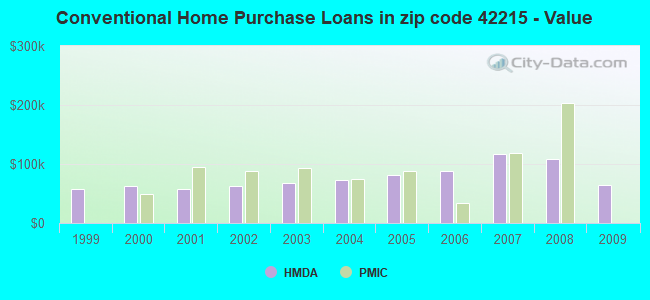
B) Conventional Home Purchase Loans
C) Refinancings
D) Home Improvement Loans
F) Non-occupant Loans on < 5 Family Dwellings (A B C & D)
G) Loans On Manufactured Home Dwelling (A B C & D)
Number
Average Value
Number
Average Value
Number
Average Value
Number
Average Value
Number
Average Value
Number
Average Value
LOANS ORIGINATED
4
$85,940
6
$65,065
24
$123,987
4
$40,242
3
$86,253
3
$33,597
APPLICATIONS APPROVED, NOT ACCEPTED
0
$0
1
$11,280
5
$102,600
0
$0
0
$0
1
$75,970
APPLICATIONS DENIED
0
$0
3
$38,863
14
$123,522
2
$32,720
1
$66,190
4
$29,335
APPLICATIONS WITHDRAWN
0
$0
0
$0
4
$88,948
0
$0
0
$0
0
$0
FILES CLOSED FOR INCOMPLETENESS
0
$0
0
$0
2
$79,735
0
$0
0
$0
1
$35,350
Aggregated Statistics For Year 2008 (Based on 2 partial tracts)
A) FHA, FSA/RHS & VA Home Purchase Loans
B) Conventional Home Purchase Loans
C) Refinancings
D) Home Improvement Loans
F) Non-occupant Loans on < 5 Family Dwellings (A B C & D)
G) Loans On Manufactured Home Dwelling (A B C & D)
Number
Average Value
Number
Average Value
Number
Average Value
Number
Average Value
Number
Average Value
Number
Average Value
LOANS ORIGINATED
2
$61,305
10
$108,317
15
$82,241
5
$52,804
3
$62,433
4
$46,638
APPLICATIONS APPROVED, NOT ACCEPTED
0
$0
2
$71,085
5
$41,522
3
$18,803
1
$9,780
3
$33,850
APPLICATIONS DENIED
1
$104,560
3
$102,050
14
$99,720
5
$26,478
1
$15,040
3
$31,593
APPLICATIONS WITHDRAWN
0
$0
1
$89,510
3
$101,047
0
$0
0
$0
1
$60,930
FILES CLOSED FOR INCOMPLETENESS
1
$145,170
0
$0
0
$0
0
$0
0
$0
0
$0
Aggregated Statistics For Year 2007 (Based on 2 partial tracts)
A) FHA, FSA/RHS & VA Home Purchase Loans
B) Conventional Home Purchase Loans
C) Refinancings
D) Home Improvement Loans
F) Non-occupant Loans on < 5 Family Dwellings (A B C & D)
G) Loans On Manufactured Home Dwelling (A B C & D)
Number
Average Value
Number
Average Value
Number
Average Value
Number
Average Value
Number
Average Value
Number
Average Value
LOANS ORIGINATED
2
$130,505
15
$116,240
18
$96,825
5
$35,804
6
$84,122
3
$45,633
APPLICATIONS APPROVED, NOT ACCEPTED
0
$0
2
$127,875
5
$23,468
1
$1,500
1
$34,600
1
$47,390
APPLICATIONS DENIED
0
$0
5
$84,246
8
$93,931
5
$57,318
0
$0
4
$59,612
APPLICATIONS WITHDRAWN
0
$0
2
$69,955
3
$135,147
1
$121,860
1
$96,280
0
$0
FILES CLOSED FOR INCOMPLETENESS
0
$0
0
$0
0
$0
0
$0
0
$0
0
$0
Aggregated Statistics For Year 2006 (Based on 2 partial tracts)
A) FHA, FSA/RHS & VA Home Purchase Loans
B) Conventional Home Purchase Loans
C) Refinancings
D) Home Improvement Loans
F) Non-occupant Loans on < 5 Family Dwellings (A B C & D)
G) Loans On Manufactured Home Dwelling (A B C & D)
Number
Average Value
Number
Average Value
Number
Average Value
Number
Average Value
Number
Average Value
Number
Average Value
LOANS ORIGINATED
3
$123,863
18
$88,634
17
$68,052
10
$17,752
2
$33,850
3
$22,567
APPLICATIONS APPROVED, NOT ACCEPTED
0
$0
2
$74,470
5
$53,106
1
$38,360
1
$69,950
2
$86,505
APPLICATIONS DENIED
0
$0
8
$64,689
13
$65,788
4
$21,625
1
$26,330
5
$56,566
APPLICATIONS WITHDRAWN
0
$0
1
$86,500
10
$81,388
2
$16,170
0
$0
0
$0
FILES CLOSED FOR INCOMPLETENESS
0
$0
2
$71,460
2
$88,760
0
$0
0
$0
0
$0
Aggregated Statistics For Year 2005 (Based on 2 partial tracts)
A) FHA, FSA/RHS & VA Home Purchase Loans
B) Conventional Home Purchase Loans
C) Refinancings
D) Home Improvement Loans
F) Non-occupant Loans on < 5 Family Dwellings (A B C & D)
G) Loans On Manufactured Home Dwelling (A B C & D)
Number
Average Value
Number
Average Value
Number
Average Value
Number
Average Value
Number
Average Value
Number
Average Value
LOANS ORIGINATED
2
$73,715
16
$81,049
24
$92,113
5
$39,866
2
$40,620
5
$64,238
APPLICATIONS APPROVED, NOT ACCEPTED
0
$0
2
$76,350
6
$73,967
0
$0
0
$0
1
$24,070
APPLICATIONS DENIED
2
$78,605
9
$46,302
15
$83,093
2
$22,940
2
$46,635
7
$39,221
APPLICATIONS WITHDRAWN
0
$0
4
$112,078
5
$82,290
0
$0
3
$75,220
0
$0
FILES CLOSED FOR INCOMPLETENESS
0
$0
2
$28,585
4
$107,752
0
$0
1
$71,460
0
$0
Aggregated Statistics For Year 2004 (Based on 2 partial tracts)
A) FHA, FSA/RHS & VA Home Purchase Loans
B) Conventional Home Purchase Loans
C) Refinancings
D) Home Improvement Loans
F) Non-occupant Loans on < 5 Family Dwellings (A B C & D)
G) Loans On Manufactured Home Dwelling (A B C & D)
Number
Average Value
Number
Average Value
Number
Average Value
Number
Average Value
Number
Average Value
Number
Average Value
LOANS ORIGINATED
3
$89,513
14
$73,339
26
$73,629
6
$23,318
2
$59,050
2
$15,045
APPLICATIONS APPROVED, NOT ACCEPTED
0
$0
1
$67,700
3
$52,653
0
$0
0
$0
1
$22,570
APPLICATIONS DENIED
1
$67,700
3
$25,573
14
$86,986
2
$18,430
0
$0
5
$33,398
APPLICATIONS WITHDRAWN
0
$0
4
$56,602
11
$99,222
1
$22,570
1
$109,820
1
$48,890
FILES CLOSED FOR INCOMPLETENESS
0
$0
2
$108,695
2
$119,975
0
$0
0
$0
0
$0
Aggregated Statistics For Year 2003 (Based on 2 partial tracts)
A) FHA, FSA/RHS & VA Home Purchase Loans
B) Conventional Home Purchase Loans
C) Refinancings
D) Home Improvement Loans
F) Non-occupant Loans on < 5 Family Dwellings (A B C & D)
Number
Average Value
Number
Average Value
Number
Average Value
Number
Average Value
Number
Average Value
LOANS ORIGINATED
3
$166,237
14
$68,289
30
$66,570
5
$52,052
5
$63,938
APPLICATIONS APPROVED, NOT ACCEPTED
1
$37,610
5
$38,964
5
$56,264
2
$15,420
0
$0
APPLICATIONS DENIED
1
$30,090
14
$46,153
11
$66,125
2
$21,815
1
$46,640
APPLICATIONS WITHDRAWN
1
$60,180
2
$102,300
7
$96,604
0
$0
0
$0
FILES CLOSED FOR INCOMPLETENESS
0
$0
0
$0
3
$44,630
0
$0
0
$0
Aggregated Statistics For Year 2002 (Based on 2 partial tracts)
A) FHA, FSA/RHS & VA Home Purchase Loans
B) Conventional Home Purchase Loans
C) Refinancings
D) Home Improvement Loans
F) Non-occupant Loans on < 5 Family Dwellings (A B C & D)
Number
Average Value
Number
Average Value
Number
Average Value
Number
Average Value
Number
Average Value
LOANS ORIGINATED
2
$55,665
22
$62,159
24
$63,060
5
$15,194
2
$42,125
APPLICATIONS APPROVED, NOT ACCEPTED
0
$0
2
$59,800
2
$44,380
0
$0
0
$0
APPLICATIONS DENIED
1
$50,400
3
$41,623
14
$72,587
4
$3,010
2
$2,635
APPLICATIONS WITHDRAWN
1
$47,390
3
$63,437
8
$77,852
0
$0
1
$18,810
FILES CLOSED FOR INCOMPLETENESS
0
$0
1
$51,150
2
$61,680
0
$0
0
$0
Aggregated Statistics For Year 2001 (Based on 2 partial tracts)
A) FHA, FSA/RHS & VA Home Purchase Loans
B) Conventional Home Purchase Loans
C) Refinancings
D) Home Improvement Loans
F) Non-occupant Loans on < 5 Family Dwellings (A B C & D)
Number
Average Value
Number
Average Value
Number
Average Value
Number
Average Value
Number
Average Value
LOANS ORIGINATED
1
$54,160
17
$57,875
19
$76,804
12
$26,013
1
$41,370
APPLICATIONS APPROVED, NOT ACCEPTED
0
$0
2
$78,230
2
$79,355
1
$3,760
0
$0
APPLICATIONS DENIED
0
$0
8
$60,646
8
$51,714
2
$6,020
0
$0
APPLICATIONS WITHDRAWN
0
$0
2
$30,840
3
$78,980
1
$11,280
0
$0
FILES CLOSED FOR INCOMPLETENESS
0
$0
0
$0
0
$0
0
$0
0
$0
Aggregated Statistics For Year 2000 (Based on 2 partial tracts)
A) FHA, FSA/RHS & VA Home Purchase Loans
B) Conventional Home Purchase Loans
C) Refinancings
D) Home Improvement Loans
F) Non-occupant Loans on < 5 Family Dwellings (A B C & D)
Number
Average Value
Number
Average Value
Number
Average Value
Number
Average Value
Number
Average Value
LOANS ORIGINATED
1
$35,350
22
$62,467
8
$48,235
4
$8,085
2
$17,300
APPLICATIONS APPROVED, NOT ACCEPTED
0
$0
1
$24,820
4
$24,635
1
$7,520
0
$0
APPLICATIONS DENIED
1
$26,330
20
$43,289
14
$55,233
2
$6,770
1
$30,840
APPLICATIONS WITHDRAWN
1
$19,560
2
$35,730
8
$48,235
1
$56,410
0
$0
FILES CLOSED FOR INCOMPLETENESS
0
$0
0
$0
2
$43,250
0
$0
0
$0
Aggregated Statistics For Year 1999 (Based on 1 partial tract)
B) Conventional Home Purchase Loans
C) Refinancings
D) Home Improvement Loans
F) Non-occupant Loans on < 5 Family Dwellings (A B C & D)
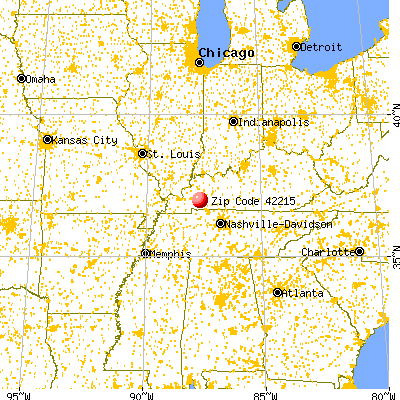


 Nearest zip codes: 42232, 42453, 42408, 42217, 42445, 42240.