Estimated zip code population in 2022: 6,320 Zip code population in 2010: 6,737 Zip code population in 2000: 7,448
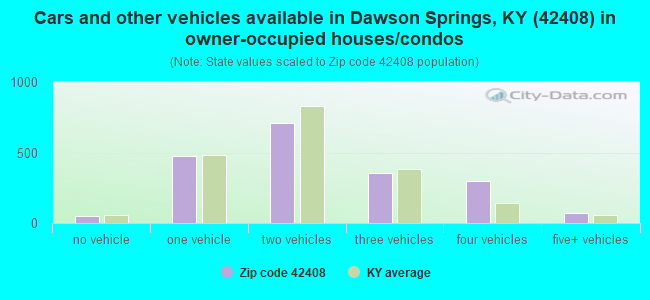
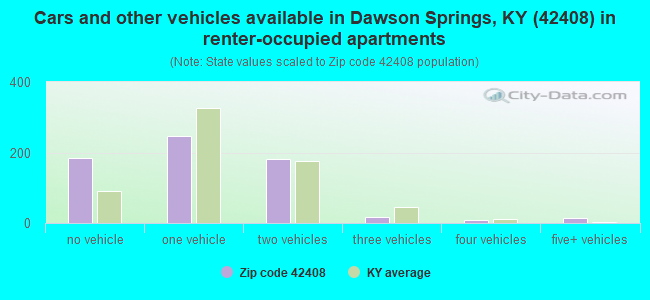
Houses and condos: 3,153 Renter-occupied apartments: 660
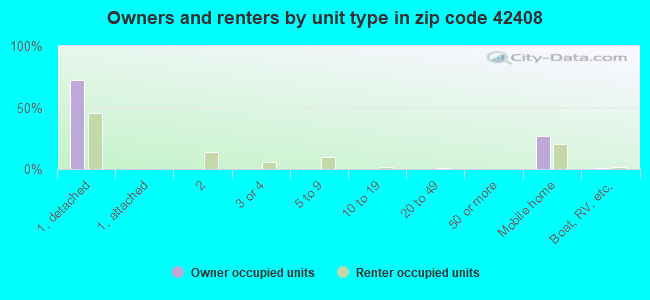
% of renters here:
25%
State:
31%
March 2022 cost of living index in zip code 42408: 80.0 (low, U.S. average is 100)
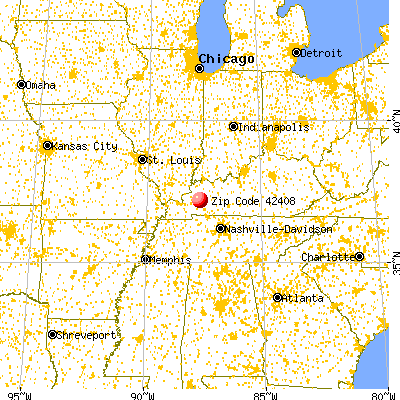
Land area: 128.6 sq. mi. Water area: 2.1 sq. mi.
Population density: 49 people per square mile
(very low).
OSM Map
General Map
Google Map
MSN Map
OSM Map
General Map
Google Map
MSN Map
OSM Map
General Map
Google Map
MSN Map
OSM Map
General Map
Google Map
MSN Map
Please wait while loading the map...
Real estate property taxes paid for housing units in 2022:
This zip code:
0.6% ($540)
Kentucky:
0.7% ($1,456)
Median real estate property taxes paid for housing units with mortgages in 2022: $586 (0.4%) Median real estate property taxes paid for housing units with no mortgage in 2022: $463 (0.6%)
Business Search- 14 Million verified businesses
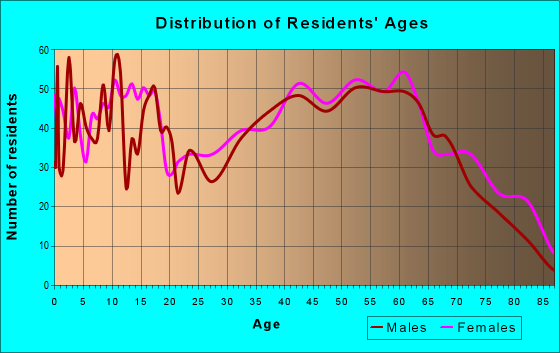
Males: 3,054
(48.3%)
Females: 3,265
(51.7%)
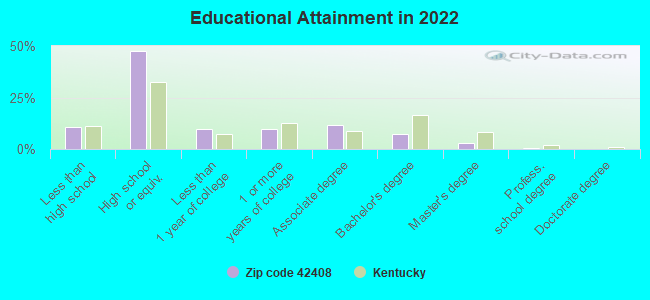
For population 25 years and over in 42408:
High school or higher: 88.3%
Bachelor's degree or higher: 10.5%
Graduate or professional degree: 3.4%
Unemployed: 6.5%
Mean travel time to work (commute): 30.8 minutes
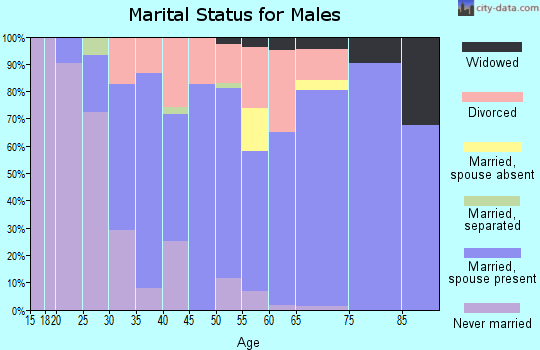
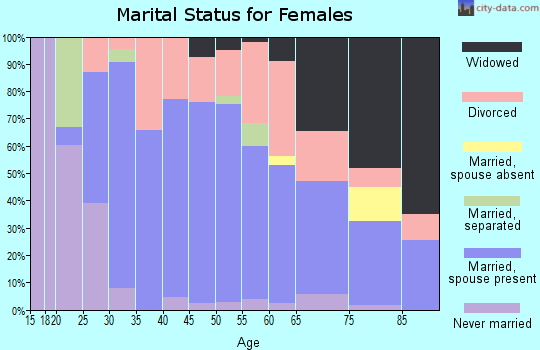
For population 15 years and over in 42408:
Never married: 22.6%
Now married: 52.6%
Separated: 3.8%
Widowed: 10.1%
Divorced: 10.9%
Zip code 42408 compared to state average:
Median house value below state average.
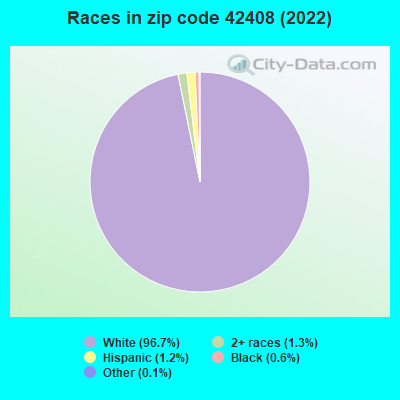
Black race population percentage significantly below state average.
Hispanic race population percentage significantly below state average.
Median age above state average.
Foreign-born population percentage significantly below state average.
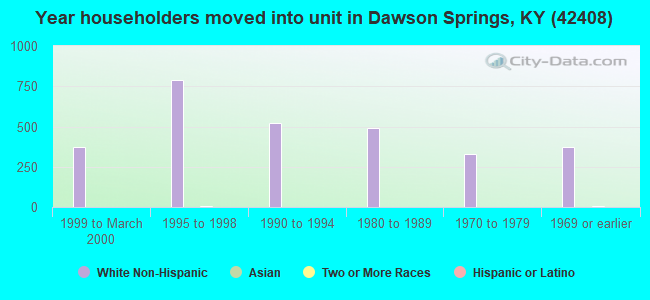
Length of stay since moving in significantly above state average.
Number of college students below state average.
Percentage of population with a bachelor's degree or higher significantly below state average.
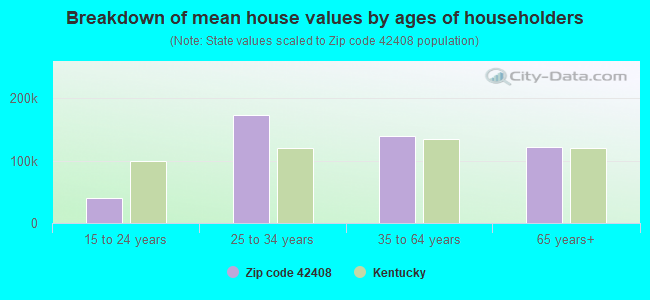
Estimated median house/condo value in 2022: $90,054
42408:
$90,054
Kentucky:
$196,300
According to our research of Kentucky and other state lists, there were 11 registered sex offenders living in 42408 zip code as of April 27, 2024. The ratio of all residents to sex offenders in zip code 42408 is 592 to 1. The ratio of registered sex offenders to all residents in this zip code is lower than the state average.
Median resident age:
This zip code:
46.7 years
Kentucky median age:
39.4 years
Average household size:
This zip code:
2.4 people
Kentucky:
2.4 people
Averages for the 2020 tax year for zip code 42408, filed in 2021:
Average Adjusted Gross Income (AGI) in 2020: $46,252 (Individual Income Tax Returns)
Here:
$46,252
State:
$61,342
Salary/wage: $40,758 (reported on 82.3% of returns)
Here:
$40,758
State:
$50,827
(% of AGI for various income ranges: 1072.4% for AGIs below $25k, 3529.4% for AGIs $25k-50k, 6263.0% for AGIs $50k-75k, 8481.1% for AGIs $75k-100k, 13141.8% for AGIs $100k-200k)
Taxable interest for individuals: $1,262 (reported on 17.3% of returns)
This zip code:
$1,262
Kentucky:
$1,441
(% of AGI for various income ranges: 14.2% for AGIs below $25k, 8.4% for AGIs $25k-50k, 34.1% for AGIs $50k-75k, 58.4% for AGIs $75k-100k, 103.5% for AGIs $100k-200k)
Ordinary dividends: $2,196 (reported on 9.9% of returns)
Here:
$2,196
State:
$7,388
(% of AGI for various income ranges: 11.2% for AGIs below $25k, 17.3% for AGIs $25k-50k, 34.8% for AGIs $50k-75k, 60.5% for AGIs $75k-100k, 85.3% for AGIs $100k-200k)
Net capital gain/loss in AGI: +$7,371 (reported on 8.6% of returns)
Here:
+$7,371
State:
+$19,475
(% of AGI for various income ranges: 3.3% for AGIs below $25k, 20.2% for AGIs $25k-50k, 100.7% for AGIs $50k-75k, 182.1% for AGIs $75k-100k, 471.8% for AGIs $100k-200k)
Profit/loss from business: +$8,132 (reported on 10.3% of returns)
Here:
+$8,132
State:
+$11,386
(% of AGI for various income ranges: 62.0% for AGIs below $25k, 64.1% for AGIs $25k-50k, 68.9% for AGIs $50k-75k, 192.1% for AGIs $75k-100k, 402.4% for AGIs $100k-200k)
Taxable individual retirement arrangement distribution: $14,605 (reported on 8.2% of returns)
42408:
$14,605
Kentucky:
$18,941
(% of AGI for various income ranges: 45.7% for AGIs below $25k, 83.5% for AGIs $25k-50k, 198.1% for AGIs $50k-75k, 263.2% for AGIs $75k-100k, 654.7% for AGIs $100k-200k)
Total itemized deductions: $30,340 (reported on 2.1% of returns)
Here:
$30,340
State:
$32,473
(% of AGI for various income ranges: 118.2% for AGIs $25k-50k, 537.6% for AGIs $100k-200k)
Charity contributions: $9,625 (reported on 1.6% of returns)
Here:
$9,625
State:
$13,472
(% of AGI for various income ranges: 226.5% for AGIs $100k-200k)
Taxes paid: $5,467 (reported on 2.5% of returns)
42408:
$5,467
State:
$7,830
(% of AGI for various income ranges: 26.1% for AGIs $25k-50k, 114.7% for AGIs $100k-200k)
Earned income credit: $2,532 (reported on 21.8% of returns)
Here:
$2,532
State:
$2,336
(% of AGI for various income ranges: 123.2% for AGIs below $25k, 79.6% for AGIs $25k-50k)
Percentage of individuals using paid preparers for their 2020 taxes: 97.1%
Here:
97%
State:
94%
(% for various income ranges: 95.9% for AGIs below $25k, 96.8% for AGIs $25k-50k, 100.0% for AGIs $50k-75k, 96.0% for AGIs $75k-100k, 109.1% for AGIs $100k-200k, 0.0% for AGIs over 200k)
Averages for the 2012 tax year for zip code 42408, filed in 2013:
Average Adjusted Gross Income (AGI) in 2012: $40,134 (Individual Income Tax Returns)
Here:
$40,134
State:
$50,814
Salary/wage: $37,125 (reported on 84.3% of returns)
Here:
$37,125
State:
$42,723
(% of AGI for various income ranges: 72.3% for AGIs below $25k, 79.2% for AGIs $25k-50k, 84.4% for AGIs $50k-75k, 78.1% for AGIs $75k-100k, 72.8% for AGIs $100k-200k)
Taxable interest for individuals: $1,042 (reported on 22.7% of returns)
This zip code:
$1,042
Kentucky:
$1,381
(% of AGI for various income ranges: 1.8% for AGIs below $25k, 0.5% for AGIs $25k-50k, 0.5% for AGIs $50k-75k, 0.4% for AGIs $75k-100k, 0.2% for AGIs $100k-200k)
Ordinary dividends: $1,617 (reported on 9.9% of returns)
Here:
$1,617
State:
$6,239
(% of AGI for various income ranges: 0.8% for AGIs below $25k, 0.4% for AGIs $25k-50k, 0.5% for AGIs $50k-75k, 0.2% for AGIs $75k-100k, 0.2% for AGIs $100k-200k)
Net capital gain/loss in AGI: +$3,367 (reported on 7.4% of returns)
Here:
+$3,367
State:
+$11,336
(% of AGI for various income ranges: 0.6% for AGIs below $25k, 0.4% for AGIs $25k-50k, 0.4% for AGIs $50k-75k, 0.5% for AGIs $75k-100k, 1.2% for AGIs $100k-200k)
Profit/loss from business: +$6,529 (reported on 11.6% of returns)
Here:
+$6,529
State:
+$10,862
(% of AGI for various income ranges: 5.5% for AGIs below $25k, 1.8% for AGIs $25k-50k, 1.3% for AGIs $50k-75k, 2.4% for AGIs $75k-100k)
Taxable individual retirement arrangement distribution: $9,512 (reported on 7.0% of returns)
42408:
$9,512
Kentucky:
$14,296
(% of AGI for various income ranges: 2.0% for AGIs below $25k, 2.2% for AGIs $25k-50k, 1.2% for AGIs $50k-75k, 3.4% for AGIs $75k-100k)
Total itemized deductions: $16,733 (21% of AGI, reported on 14.9% of returns)
Here:
$16,733
State:
$21,160
Here:
20.6% of AGI
State:
20.0% of AGI
(% of AGI for various income ranges: 4.1% for AGIs below $25k, 4.6% for AGIs $25k-50k, 4.0% for AGIs $50k-75k, 8.2% for AGIs $75k-100k, 10.1% for AGIs $100k-200k)
Charity contributions: $4,381 (reported on 11.2% of returns)
Here:
$4,381
State:
$4,303
(% of AGI for various income ranges: 0.6% for AGIs below $25k, 0.7% for AGIs $25k-50k, 0.8% for AGIs $50k-75k, 1.6% for AGIs $75k-100k, 2.3% for AGIs $100k-200k)
Taxes paid: $5,642 (reported on 14.9% of returns)
42408:
$5,642
State:
$8,496
(% of AGI for various income ranges: 0.5% for AGIs below $25k, 1.0% for AGIs $25k-50k, 1.3% for AGIs $50k-75k, 2.7% for AGIs $75k-100k, 4.6% for AGIs $100k-200k)
Earned income credit: $2,267 (reported on 24.0% of returns)
Here:
$2,267
State:
$2,273
(% of AGI for various income ranges: 7.7% for AGIs below $25k, 1.4% for AGIs $25k-50k)
Percentage of individuals using paid preparers for their 2012 taxes: 67.4%
Here:
67%
State:
60%
(% for various income ranges: 63.9% for AGIs below $25k, 67.2% for AGIs $25k-50k, 70.0% for AGIs $50k-75k, 75.0% for AGIs $75k-100k, 75.0% for AGIs $100k-200k)
Averages for the 2004 tax year for zip code 42408, filed in 2005:
Average Adjusted Gross Income (AGI) in 2004: $31,431 (Individual Income Tax Returns)
Here:
$31,431
State:
$41,540
Salary/wage: $30,353 (reported on 84.0% of returns)
Here:
$30,353
State:
$36,432
(% of AGI for various income ranges: 89.1% for AGIs below $10k, 71.7% for AGIs $10k-25k, 85.8% for AGIs $25k-50k, 83.3% for AGIs $50k-75k, 85.7% for AGIs $75k-100k, 64.4% for AGIs over 100k)
Taxable interest for individuals: $1,681 (reported on 31.7% of returns)
This zip code:
$1,681
Kentucky:
$1,571
(% of AGI for various income ranges: 6.8% for AGIs below $10k, 3.4% for AGIs $10k-25k, 1.1% for AGIs $25k-50k, 1.8% for AGIs $50k-75k, 0.3% for AGIs $75k-100k, 0.6% for AGIs over 100k)
Taxable dividends: $952 (reported on 12.3% of returns)
Here:
$952
State:
$3,453
(% of AGI for various income ranges: 0.8% for AGIs below $10k, 0.8% for AGIs $10k-25k, 0.5% for AGIs $25k-50k, 0.1% for AGIs $50k-75k, 0.1% for AGIs $75k-100k, 0.3% for AGIs over 100k)
Net capital gain/loss: +$3,506 (reported on 9.6% of returns)
Here:
+$3,506
State:
+$9,663
(% of AGI for various income ranges: -0.6% for AGIs below $10k, 0.7% for AGIs $10k-25k, 0.6% for AGIs $25k-50k, 1.6% for AGIs $50k-75k, 1.5% for AGIs $75k-100k, 1.7% for AGIs over 100k)
Profit/loss from business: +$4,945 (reported on 14.5% of returns)
Here:
+$4,945
State:
+$9,233
(% of AGI for various income ranges: 7.2% for AGIs below $10k, 5.9% for AGIs $10k-25k, 1.6% for AGIs $25k-50k, 2.1% for AGIs $50k-75k, 0.8% for AGIs $75k-100k, -0.7% for AGIs over 100k)
IRA payment deduction: $2,674 (reported on 1.8% of returns)
42408:
$2,674
Kentucky:
$2,955
Total itemized deductions: $14,123 (23% of AGI, reported on 16.2% of returns)
Here:
$14,123
State:
$17,474
Here:
23.1% of AGI
State:
21.0% of AGI
(% of AGI for various income ranges: 5.3% for AGIs below $10k, 6.5% for AGIs $10k-25k, 4.6% for AGIs $25k-50k, 7.6% for AGIs $50k-75k, 10.8% for AGIs $75k-100k, 12.6% for AGIs over 100k)
Charity contributions deductions: $3,524 (5% of AGI, reported on 13.3% of returns)
Here:
$3,524
State:
$3,494
Here:
5.5% of AGI
State:
4.0% of AGI
(% of AGI for various income ranges: 0.7% for AGIs below $10k, 1.0% for AGIs $10k-25k, 0.9% for AGIs $25k-50k, 1.9% for AGIs $50k-75k, 2.4% for AGIs $75k-100k, 2.3% for AGIs over 100k)
Total tax: $3,401 (reported on 70.2% of returns)
42408:
$3,401
State:
$6,162
(% of AGI for various income ranges: 2.6% for AGIs below $10k, 3.7% for AGIs $10k-25k, 5.7% for AGIs $25k-50k, 8.5% for AGIs $50k-75k, 10.6% for AGIs $75k-100k, 15.4% for AGIs over 100k)
Earned income credit: $1,701 (reported on 22.0% of returns)
Here:
$1,701
State:
$1,723
Percentage of individuals using paid preparers for their 2004 taxes: 70.0%
Here:
70%
State:
66%
(% for various income ranges: 63.7% for AGIs below $10k, 71.5% for AGIs $10k-25k, 69.2% for AGIs $25k-50k, 74.4% for AGIs $50k-75k, 76.3% for AGIs $75k-100k, 85.7% for AGIs over 100k)
Household received Food Stamps/SNAP in the past 12 months: 344 Household did not receive Food Stamps/SNAP in the past 12 months: 2,262
Women who had a birth in the past 12 months: 78 (41 now married, 36 unmarried) Women who did not have a birth in the past 12 months: 981 (472 now married, 509 unmarried)
Housing units in zip code 42408 with a mortgage: 928 (19 second mortgage, 5 home equity loan, 14 both second mortgage and home equity loan) Houses without a mortgage: 33
Median monthly owner costs for units with a mortgage: $938 Median monthly owner costs for units without a mortgage: $340
Residents with income below the poverty level in 2022:
This zip code:
15.4%
Whole state:
16.5%
Residents with income below 50% of the poverty level in 2022:
This zip code:
9.7%
Whole state:
9.0%
Median number of rooms in houses and condos:
Here:
6.1
State:
6.4
Median number of rooms in apartments:
Here:
4.7
State:
4.4
Notable locations in this zip code not listed on our city pages
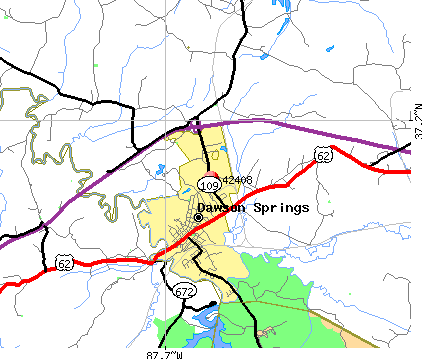
Notable locations in zip code 42408: Ilsley Siding (A), Charleston Volunteer Fire Department (B), Dawson Springs Volunteer Fire Department (C). Display/hide their locations on the map
Churches in zip code 42408 include: Walnut Grove Church (A), Lafayette Church (B), Lebanon Baptist Church (C), Lick Church (D), Macedonia Church (E), Midway Church (F), Mount Hebron Church (G), Mount Pisgah Baptist Church (H), New Hope Church (I). Display/hide their locations on the map
Cemeteries: Trent Cemetery (1), Brooks Cemetery (2), Christian Privilege Cemetery (3), Vanhooser Cemetery (4), Stallins Cemetery (5), Creekmur Cemetery (6), Dalton Cemetery (7). Display/hide their locations on the map
Streams, rivers, and creeks: Brooks Creek (A), Pieburn Creek (B), Copper Creek (C), Clifty Creek (D), Trace Creek (E), Sugar Creek (F), Bull Creek (G), Buffalo Branch (H), North Fork Hurricane Creek (I). Display/hide their locations on the map
In group quarters: 146 (-1 institutionalized population)
Size of family households: 696 2-persons, 499 3-persons, 297 4-persons, 107 5-persons, 36 6-persons, 14 7-or-more-persons
Size of nonfamily households: 880 1-person, 82 2-persons
744 married couples with children.
285 single-parent households (129 men, 156 women).
99.3% of residents of 42408 zip code speak English at home.
0.5% of residents speak Spanish at home (89% very well, 4% well, 7% not well).
0.2% of residents speak other Indo-European language at home (100% very well).
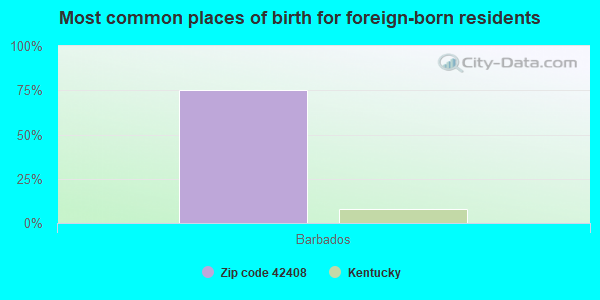
Foreign born population: 3 (0.1%) (0.0% of them are naturalized citizens)
:
0.1%
Whole state:
4.0%
75%Barbados
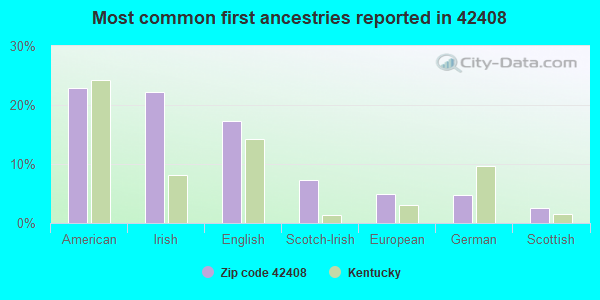
23%American
22%Irish
17%English
7%Scotch-Irish
5%European
5%German
2%Scottish
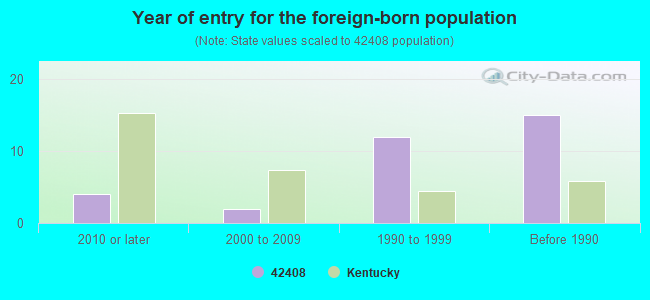
Year of entry for the foreign-born population
42010 or later
22000 to 2009
121990 to 1999
15Before 1990
Major facilities with environmental interests located in this zip code:
BUCKHORN MATL HANDLING GROUP (350 INDUSTRIAL PARK RD in DAWSON SPRINGS, KY)
COMPLIANCE ACTIVITY (Tracking inspections of insecticide, fungicide, and rodenticide, and toxic substances) National Pollutant Discharge Elimination System NON-MAJOR (Tracking pollutant discharge elimination systems) - permit Business SIC classification: PLASTICS PRODUCTS Alternative names: BUCKHORN CORP.
MINE EQUIPMENT & MILL SUPPLY CO (370 MINE EQUIPMENT RD. in DAWSON SPRINGS, KY)
National Pollutant Discharge Elimination System NON-MAJOR (Tracking pollutant discharge elimination systems) - permit TRI REPORTER (Tracking of toxic chemicals releasing facilities) Business SIC classification: EXPLOSIVES
PARKWAY MARKET (5715 CHARLESTON ROAD in DAWSON SPRINGS, KY)
KY DOP PENNYRILE FOREST STATE PARK (20781 PENNYRILE LODGE ROAD in DAWSON SPRINGS, KY)
COMPLIANCE ACTIVITY (Tracking inspections of insecticide, fungicide, and rodenticide, and toxic substances) National Pollutant Discharge Elimination System NON-MAJOR (Tracking pollutant discharge elimination systems) - permit Business SIC classification: AMUSEMENT AND RECREATION SERVICES Organizations: KY DOP PENNYRILE FOREST ST PK (CONTACT/OWNER)
Alternative names: KY DOP PENNYRILE FOREST ST PK, PENNYRILE STATE PARK
A R LUMBER CO INC (760 FERGUSONTOWN RD in DAWSON SPRINGS, KY)
National Pollutant Discharge Elimination System NON-MAJOR (Tracking pollutant discharge elimination systems) - permit Business SIC classification: SAWMILLS AND PLANING MILLS, GENERAL
ABT COAL COMPANY (HIGHWAY 813 in DAWSON SPRINGS, KY)
AIR MINOR (AIRS/AFS)
CB UTLEY STORE (HWY 70 & 109 in DAWSON SPRINGS, KY)
(Resource Conservation and Recovery Act (tracking hazardous waste)) Organizations: C B UTLEY (CONTACT/OWNER)
COLUMBIA NATURAL RESOURCE (400 FEET WEST OF BRUSHY ROAD in CHARLESTON, KY)
CRITERIA AND HAZARDOUS AIR POLLUTANT INVENTORY (Inventory of air pollution sources) Business SIC classification: NATURAL GAS TRANSMISSION
PANTRY CONVENIENCE STORE #344 (320 EAST ARCADIA STREET in DAWSON SPRINGS, KY)
(Resource Conservation and Recovery Act (tracking hazardous waste)) Organizations: THE PANTRY INC (CONTACT/OWNER)
PENNYRILE STATE PARK RESORT (21505 BAINBRIDGE RD in DAWSON SPRINGS, KY)
National Pollutant Discharge Elimination System NON-MAJOR (Tracking pollutant discharge elimination systems) - permit Business SIC classification: MANAGEMENT SERVICES
CENTRAN CORPORATION (WEST BEULAH MINE in BEULAH, KY)
AIR MINOR (AIRS/AFS)
LICK CREEK COAL COMPANY (KY HIGHWAY 109 in BEULAH, KY)
AIR MINOR (AIRS/AFS)
BIG HORN REBUILDERS INC (1001 HOSPITAL ROAD in DAWSON SPRINGS, KY)
COMPLIANCE ACTIVITY (Tracking inspections of insecticide, fungicide, and rodenticide, and toxic substances)
Housing units lacking complete plumbing facilities: 5.9% Housing units lacking complete kitchen facilities: 5.7%
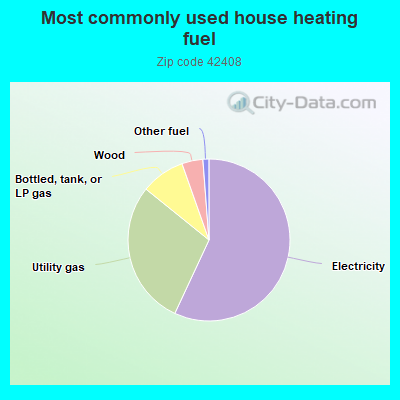
57.0%Electricity
28.9%Utility gas
8.8%Bottled, tank, or LP gas
4.2%Wood
1.2%Other fuel
Population in 1990: 6,728. Population change in the 1990s: +720 (+10.7%).
Place of birth for U.S.-born residents:
This state: 4,746
Northeast: 102
Midwest: 916
South: 358
West: 143
65% of the 42408 zip code residents lived in the same house 5 years ago. Out of people who lived in different houses, 61% lived in this county. Out of people who lived in different counties, 50% lived in Kentucky.
92% of the 42408 zip code residents lived in the same house 1 year ago. Out of people who lived in different houses, 68% moved from this county. Out of people who lived in different houses, 15% moved from different county within same state. Out of people who lived in different houses, 13% moved from different state. Out of people who lived in different houses, 2% moved from abroad.
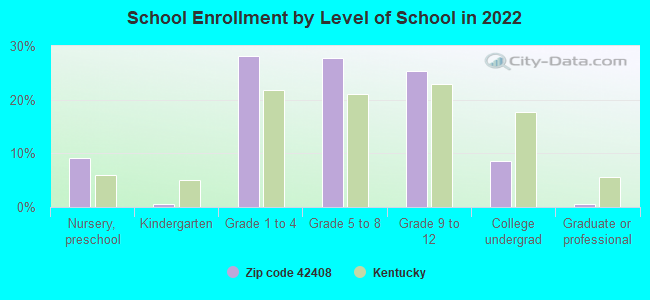
Private vs. public school enrollment:
Students in private schools in grades 1 to 8 (elementary and middle school): 138
Here:
23.3%
Kentucky:
17.2%
Students in private schools in grades 9 to 12 (high school): 56
Here:
21.2%
Kentucky:
15.2%
Students in private undergraduate colleges: 39
Here:
43.2%
Kentucky:
19.6%
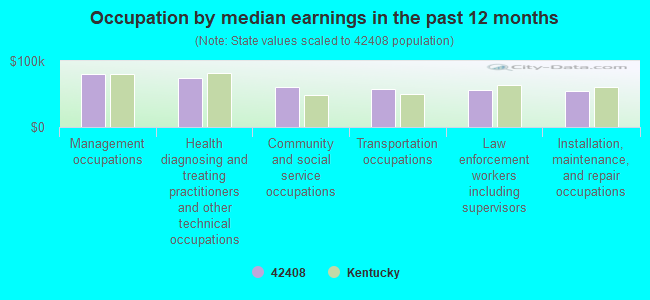
Occupation by median earnings in the past 12 months ($)
80,900Management occupations
74,255Health diagnosing and treating practitioners and other technical occupations
60,975Community and social service occupations
57,119Transportation occupations
56,485Law enforcement workers including supervisors
54,759Installation, maintenance, and repair occupations
Companies with federal contracts located in this zip code:
MATHIS TREE SERVICE (5280 CHARLESTON RD in DAWSON SPRINGS, KY; small business)
$10,000 with Army for Recreation Site Maintenance Services (non-construction). Signed on 2004-08-20. Completion date: 2004-08-18.
COMPUTER KNIGHTS, INC (118 W RAILROAD AVE in DAWSON SPRINGS, KY; small business) : $4,502 in 2 contractsin 2005
$6,686 with Army for Headsets, Handsets, Microphones and Speakers. Signed on 2005-03-30. Completion date: 2005-04-08.
-$2,184, same as above.Signed on 2005-05-11. Completion date: 2005-04-08.
Top industries in this zip code by the number of employees in 2005:
Health Care and Social Assistance: Residential Mental Retardation Facilities (100-249 employees: 1 establishment)
Health Care and Social Assistance: Nursing Care Facilities (50-99: 2)
Accommodation and Food Services: Limited-Service Restaurants (20-49: 1)
Accommodation and Food Services: Full-Service Restaurants (10-19: 1, 5-9: 1)
Finance and Insurance: Insurance Agencies and Brokerages (10-19: 1, 5-9: 1)
People in group quarters in 2010:
111 people in nursing facilities/skilled-nursing facilities
59 people in residential treatment centers for adults
People in group quarters in 2000:
175 people in nursing homes
76 people in homes for the mentally retarded
Fatal accident statistics in 2014:
Fatal accident count: 1
Vehicles involved in fatal accidents: 2
Fatal accidents caused by drunken drivers: 1
Fatalities: 1
Persons involved in fatal accidents: 2
Pedestrians involved in fatal accidents: 0
Fatal accident statistics in 2013:
Fatal accident count: 1
Vehicles involved in fatal accidents: 1
Fatal accidents caused by drunken drivers: 1
Fatalities: 1
Persons involved in fatal accidents: 1
Pedestrians involved in fatal accidents: 0
Home Mortgage Disclosure Act Aggregated Statistics For Year 2009 (Based on 2 partial tracts)
A) FHA, FSA/RHS & VA Home Purchase Loans
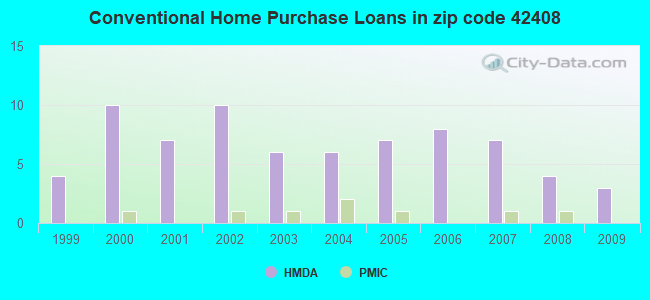
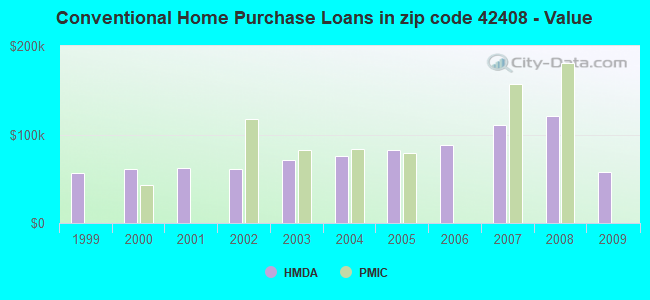
B) Conventional Home Purchase Loans
C) Refinancings
D) Home Improvement Loans
F) Non-occupant Loans on < 5 Family Dwellings (A B C & D)
G) Loans On Manufactured Home Dwelling (A B C & D)
Number
Average Value
Number
Average Value
Number
Average Value
Number
Average Value
Number
Average Value
Number
Average Value
LOANS ORIGINATED
2
$76,410
3
$57,850
11
$120,263
2
$35,780
1
$115,030
1
$44,810
APPLICATIONS APPROVED, NOT ACCEPTED
0
$0
0
$0
2
$114,030
0
$0
0
$0
0
$0
APPLICATIONS DENIED
0
$0
1
$51,830
6
$128,132
1
$29,090
0
$0
2
$26,085
APPLICATIONS WITHDRAWN
0
$0
0
$0
2
$79,085
0
$0
0
$0
0
$0
FILES CLOSED FOR INCOMPLETENESS
0
$0
0
$0
1
$70,890
0
$0
0
$0
0
$0
Aggregated Statistics For Year 2008 (Based on 2 partial tracts)
A) FHA, FSA/RHS & VA Home Purchase Loans
B) Conventional Home Purchase Loans
C) Refinancings
D) Home Improvement Loans
F) Non-occupant Loans on < 5 Family Dwellings (A B C & D)
G) Loans On Manufactured Home Dwelling (A B C & D)
Number
Average Value
Number
Average Value
Number
Average Value
Number
Average Value
Number
Average Value
Number
Average Value
LOANS ORIGINATED
1
$54,510
4
$120,385
7
$78,346
2
$58,685
1
$83,270
2
$41,465
APPLICATIONS APPROVED, NOT ACCEPTED
0
$0
1
$63,200
2
$46,145
1
$25,080
0
$0
1
$45,140
APPLICATIONS DENIED
0
$0
1
$136,100
6
$103,442
2
$29,425
0
$0
1
$42,130
APPLICATIONS WITHDRAWN
0
$0
0
$0
1
$134,760
0
$0
0
$0
0
$0
FILES CLOSED FOR INCOMPLETENESS
0
$0
0
$0
0
$0
0
$0
0
$0
0
$0
Aggregated Statistics For Year 2007 (Based on 2 partial tracts)
A) FHA, FSA/RHS & VA Home Purchase Loans
B) Conventional Home Purchase Loans
C) Refinancings
D) Home Improvement Loans
F) Non-occupant Loans on < 5 Family Dwellings (A B C & D)
G) Loans On Manufactured Home Dwelling (A B C & D)
Number
Average Value
Number
Average Value
Number
Average Value
Number
Average Value
Number
Average Value
Number
Average Value
LOANS ORIGINATED
1
$116,040
7
$110,734
8
$96,850
2
$39,795
3
$74,793
1
$60,860
APPLICATIONS APPROVED, NOT ACCEPTED
0
$0
1
$113,700
2
$26,085
0
$0
0
$0
0
$0
APPLICATIONS DENIED
0
$0
2
$93,630
4
$83,518
2
$63,705
0
$0
2
$53,000
APPLICATIONS WITHDRAWN
0
$0
1
$62,200
1
$180,240
0
$0
0
$0
0
$0
FILES CLOSED FOR INCOMPLETENESS
0
$0
0
$0
0
$0
0
$0
0
$0
0
$0
Aggregated Statistics For Year 2006 (Based on 2 partial tracts)
A) FHA, FSA/RHS & VA Home Purchase Loans
B) Conventional Home Purchase Loans
C) Refinancings
D) Home Improvement Loans
F) Non-occupant Loans on < 5 Family Dwellings (A B C & D)
G) Loans On Manufactured Home Dwelling (A B C & D)
Number
Average Value
Number
Average Value
Number
Average Value
Number
Average Value
Number
Average Value
Number
Average Value
LOANS ORIGINATED
1
$165,190
8
$88,658
7
$73,473
4
$19,730
1
$30,100
1
$30,100
APPLICATIONS APPROVED, NOT ACCEPTED
0
$0
1
$66,210
2
$59,020
0
$0
0
$0
1
$76,910
APPLICATIONS DENIED
0
$0
4
$57,518
6
$63,368
2
$19,230
0
$0
2
$62,865
APPLICATIONS WITHDRAWN
0
$0
0
$0
4
$90,455
1
$14,380
0
$0
0
$0
FILES CLOSED FOR INCOMPLETENESS
0
$0
1
$63,540
1
$78,920
0
$0
0
$0
0
$0
Aggregated Statistics For Year 2005 (Based on 2 partial tracts)
A) FHA, FSA/RHS & VA Home Purchase Loans
B) Conventional Home Purchase Loans
C) Refinancings
D) Home Improvement Loans
F) Non-occupant Loans on < 5 Family Dwellings (A B C & D)
G) Loans On Manufactured Home Dwelling (A B C & D)
Number
Average Value
Number
Average Value
Number
Average Value
Number
Average Value
Number
Average Value
Number
Average Value
LOANS ORIGINATED
1
$65,540
7
$82,359
11
$89,345
2
$44,310
1
$36,120
2
$71,395
APPLICATIONS APPROVED, NOT ACCEPTED
0
$0
1
$67,880
3
$65,767
0
$0
0
$0
0
$0
APPLICATIONS DENIED
1
$69,890
4
$46,315
7
$79,157
1
$20,400
1
$41,470
3
$40,687
APPLICATIONS WITHDRAWN
0
$0
2
$99,650
2
$91,460
0
$0
1
$100,320
0
$0
FILES CLOSED FOR INCOMPLETENESS
0
$0
1
$25,410
2
$95,805
0
$0
0
$0
0
$0
Aggregated Statistics For Year 2004 (Based on 2 partial tracts)
A) FHA, FSA/RHS & VA Home Purchase Loans
B) Conventional Home Purchase Loans
C) Refinancings
D) Home Improvement Loans
F) Non-occupant Loans on < 5 Family Dwellings (A B C & D)
G) Loans On Manufactured Home Dwelling (A B C & D)
Number
Average Value
Number
Average Value
Number
Average Value
Number
Average Value
Number
Average Value
Number
Average Value
LOANS ORIGINATED
1
$119,380
6
$76,077
11
$77,368
3
$20,733
1
$52,500
1
$13,380
APPLICATIONS APPROVED, NOT ACCEPTED
0
$0
0
$0
1
$70,220
0
$0
0
$0
0
$0
APPLICATIONS DENIED
0
$0
1
$34,110
6
$90,232
1
$16,390
0
$0
2
$37,120
APPLICATIONS WITHDRAWN
0
$0
2
$50,325
5
$97,042
0
$0
0
$0
0
$0
FILES CLOSED FOR INCOMPLETENESS
0
$0
1
$96,640
1
$106,670
0
$0
0
$0
0
$0
Aggregated Statistics For Year 2003 (Based on 2 partial tracts)
A) FHA, FSA/RHS & VA Home Purchase Loans
B) Conventional Home Purchase Loans
C) Refinancings
D) Home Improvement Loans
F) Non-occupant Loans on < 5 Family Dwellings (A B C & D)
Number
Average Value
Number
Average Value
Number
Average Value
Number
Average Value
Number
Average Value
LOANS ORIGINATED
1
$221,710
6
$70,837
13
$68,295
2
$57,850
2
$71,060
APPLICATIONS APPROVED, NOT ACCEPTED
0
$0
2
$43,305
2
$62,535
1
$13,710
0
$0
APPLICATIONS DENIED
0
$0
6
$47,875
5
$64,672
1
$19,400
0
$0
APPLICATIONS WITHDRAWN
0
$0
1
$90,960
3
$100,210
0
$0
0
$0
FILES CLOSED FOR INCOMPLETENESS
0
$0
0
$0
1
$59,520
0
$0
0
$0
Aggregated Statistics For Year 2002 (Based on 2 partial tracts)
A) FHA, FSA/RHS & VA Home Purchase Loans
B) Conventional Home Purchase Loans
C) Refinancings
D) Home Improvement Loans
F) Non-occupant Loans on < 5 Family Dwellings (A B C & D)
Number
Average Value
Number
Average Value
Number
Average Value
Number
Average Value
Number
Average Value
LOANS ORIGINATED
1
$49,490
10
$60,794
11
$61,165
2
$16,885
1
$37,450
APPLICATIONS APPROVED, NOT ACCEPTED
0
$0
1
$53,170
1
$39,460
0
$0
0
$0
APPLICATIONS DENIED
0
$0
1
$55,510
6
$75,295
2
$2,675
1
$2,340
APPLICATIONS WITHDRAWN
0
$0
1
$84,600
4
$69,220
0
$0
0
$0
FILES CLOSED FOR INCOMPLETENESS
0
$0
0
$0
1
$54,840
0
$0
0
$0
Aggregated Statistics For Year 2001 (Based on 2 partial tracts)
B) Conventional Home Purchase Loans
C) Refinancings
D) Home Improvement Loans
Number
Average Value
Number
Average Value
Number
Average Value
LOANS ORIGINATED
7
$62,486
8
$81,092
5
$27,756
APPLICATIONS APPROVED, NOT ACCEPTED
1
$69,560
1
$70,560
0
$0
APPLICATIONS DENIED
4
$53,922
4
$45,980
1
$5,350
APPLICATIONS WITHDRAWN
1
$27,420
1
$105,340
0
$0
FILES CLOSED FOR INCOMPLETENESS
0
$0
0
$0
0
$0
Aggregated Statistics For Year 2000 (Based on 2 partial tracts)
B) Conventional Home Purchase Loans
C) Refinancings
D) Home Improvement Loans
F) Non-occupant Loans on < 5 Family Dwellings (A B C & D)
Number
Average Value
Number
Average Value
Number
Average Value
Number
Average Value
LOANS ORIGINATED
10
$61,095
4
$42,888
2
$7,190
1
$15,380
APPLICATIONS APPROVED, NOT ACCEPTED
0
$0
2
$21,905
0
$0
0
$0
APPLICATIONS DENIED
9
$42,766
6
$57,293
1
$6,020
0
$0
APPLICATIONS WITHDRAWN
1
$31,770
4
$42,888
0
$0
0
$0
FILES CLOSED FOR INCOMPLETENESS
0
$0
1
$38,460
0
$0
0
$0
Aggregated Statistics For Year 1999 (Based on 1 partial tract)
Detailed PMIC statistics for the following Tracts:2010.00
2002 - 2018 National Fire Incident Reporting System (NFIRS) incidents
Based on the data from the years 2002 - 2018 the average number of fire incidents per year is 28. The highest number of fires - 52 took place in 2015, and the least - 10 in 2005. The data has a declining trend.
When looking into fire subcategories, the most incidents belonged to: Structure Fires (40.5%), and Outside Fires (35.5%).
Fire incident types reported to NFIRS in Zip Code 42408


 Nearest zip codes: 42453, 42445, 42441, 42215, 42442, 42410.


 Based on the data from the years 2002 - 2018 the average number of fire incidents per year is 28. The highest number of fires - 52 took place in 2015, and the least - 10 in 2005. The data has a declining trend.
 When looking into fire subcategories, the most incidents belonged to: Structure Fires (40.5%), and Outside Fires (35.5%).