Estimated zip code population in 2022: 18,521 Zip code population in 2010: 20,065 Zip code population in 2000: 18,553
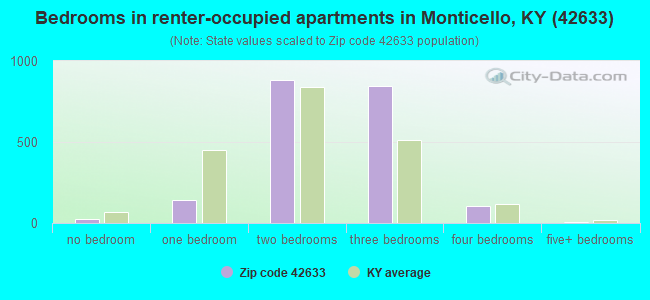
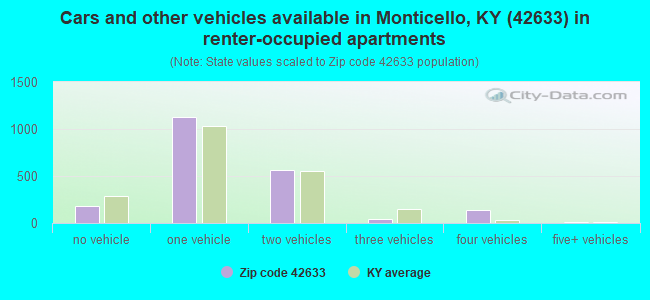
Houses and condos: 9,339 Renter-occupied apartments: 2,057
% of renters here:
27%
State:
31%
March 2022 cost of living index in zip code 42633: 81.5 (low, U.S. average is 100)
Land area: 434.9 sq. mi. Water area: 19.4 sq. mi.
Population density: 43 people per square mile
(very low).
OSM Map
General Map
Google Map
MSN Map
OSM Map
General Map
Google Map
MSN Map
OSM Map
General Map
Google Map
MSN Map
OSM Map
General Map
Google Map
MSN Map
Please wait while loading the map...
Real estate property taxes paid for housing units in 2022:
This zip code:
0.5% ($698)
Kentucky:
0.7% ($1,456)
Median real estate property taxes paid for housing units with mortgages in 2022: $975 (0.6%) Median real estate property taxes paid for housing units with no mortgage in 2022: $532 (0.5%)
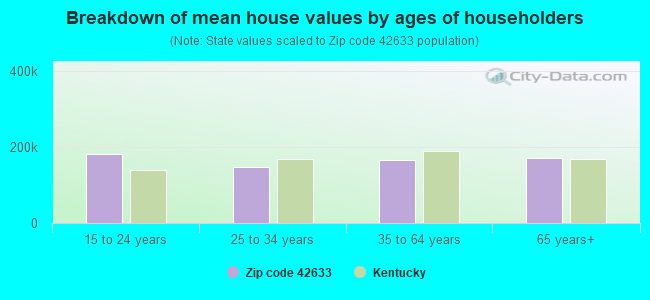
Estimated median house/condo value in 2022: $127,207
42633:
$127,207
Kentucky:
$196,300
According to our research of Kentucky and other state lists, there were 38 registered sex offenders living in 42633 zip code as of April 26, 2024. The ratio of all residents to sex offenders in zip code 42633 is 530 to 1. The ratio of registered sex offenders to all residents in this zip code is near the state average.
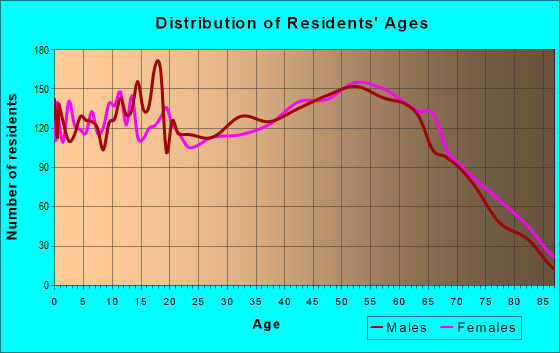
Median resident age:
This zip code:
43.5 years
Kentucky median age:
39.4 years
Average household size:
This zip code:
2.4 people
Kentucky:
2.4 people
Averages for the 2020 tax year for zip code 42633, filed in 2021:
Average Adjusted Gross Income (AGI) in 2020: $40,426 (Individual Income Tax Returns)
Here:
$40,426
State:
$61,342
Salary/wage: $34,726 (reported on 80.8% of returns)
Here:
$34,726
State:
$50,827
(% of AGI for various income ranges: 1153.6% for AGIs below $25k, 3313.8% for AGIs $25k-50k, 6236.6% for AGIs $50k-75k, 9090.0% for AGIs $75k-100k, 14873.2% for AGIs $100k-200k, 43085.0% for AGIs over 200k)
Taxable interest for individuals: $1,577 (reported on 20.3% of returns)
This zip code:
$1,577
Kentucky:
$1,441
(% of AGI for various income ranges: 9.2% for AGIs below $25k, 16.9% for AGIs $25k-50k, 70.9% for AGIs $50k-75k, 76.4% for AGIs $75k-100k, 172.8% for AGIs $100k-200k, 3325.0% for AGIs over 200k)
Ordinary dividends: $5,400 (reported on 8.3% of returns)
Here:
$5,400
State:
$7,388
(% of AGI for various income ranges: 6.4% for AGIs below $25k, 13.3% for AGIs $25k-50k, 70.7% for AGIs $50k-75k, 66.4% for AGIs $75k-100k, 265.2% for AGIs $100k-200k, 7670.0% for AGIs over 200k)
Net capital gain/loss in AGI: +$11,672 (reported on 7.9% of returns)
Here:
+$11,672
State:
+$19,475
(% of AGI for various income ranges: 9.0% for AGIs below $25k, 37.6% for AGIs $25k-50k, 98.2% for AGIs $50k-75k, 218.8% for AGIs $75k-100k, 742.4% for AGIs $100k-200k, 13115.0% for AGIs over 200k)
Profit/loss from business: +$9,943 (reported on 13.8% of returns)
Here:
+$9,943
State:
+$11,386
(% of AGI for various income ranges: 118.9% for AGIs below $25k, 130.2% for AGIs $25k-50k, 243.7% for AGIs $50k-75k, 137.3% for AGIs $75k-100k, 518.8% for AGIs $100k-200k, 6965.0% for AGIs over 200k)
Taxable individual retirement arrangement distribution: $13,360 (reported on 5.7% of returns)
42633:
$13,360
Kentucky:
$18,941
(% of AGI for various income ranges: 32.6% for AGIs below $25k, 55.9% for AGIs $25k-50k, 131.9% for AGIs $50k-75k, 289.1% for AGIs $75k-100k, 774.0% for AGIs $100k-200k)
Total itemized deductions: $38,027 (reported on 1.5% of returns)
Here:
$38,027
State:
$32,473
(% of AGI for various income ranges: 234.2% for AGIs $50k-75k, 502.0% for AGIs $100k-200k, 6795.0% for AGIs over 200k)
Charity contributions: $19,640 (reported on 1.4% of returns)
Here:
$19,640
State:
$13,472
(% of AGI for various income ranges: 66.0% for AGIs $50k-75k, 224.4% for AGIs $100k-200k, 4805.0% for AGIs over 200k)
Taxes paid: $6,636 (reported on 1.5% of returns)
42633:
$6,636
State:
$7,830
(% of AGI for various income ranges: 33.3% for AGIs $50k-75k, 120.4% for AGIs $100k-200k, 1030.0% for AGIs over 200k)
Earned income credit: $2,619 (reported on 28.0% of returns)
Here:
$2,619
State:
$2,336
(% of AGI for various income ranges: 139.9% for AGIs below $25k, 103.4% for AGIs $25k-50k, 2.1% for AGIs $50k-75k)
Percentage of individuals using paid preparers for their 2020 taxes: 96.9%
Here:
97%
State:
94%
(% for various income ranges: 95.4% for AGIs below $25k, 98.2% for AGIs $25k-50k, 97.9% for AGIs $50k-75k, 98.0% for AGIs $75k-100k, 97.7% for AGIs $100k-200k, 100.0% for AGIs over 200k)
Averages for the 2012 tax year for zip code 42633, filed in 2013:
Average Adjusted Gross Income (AGI) in 2012: $34,339 (Individual Income Tax Returns)
Here:
$34,339
State:
$50,814
Salary/wage: $29,910 (reported on 83.0% of returns)
Here:
$29,910
State:
$42,723
(% of AGI for various income ranges: 74.2% for AGIs below $25k, 81.1% for AGIs $25k-50k, 78.9% for AGIs $50k-75k, 67.9% for AGIs $75k-100k, 63.7% for AGIs $100k-200k, 36.3% for AGIs over 200k)
Taxable interest for individuals: $1,539 (reported on 25.1% of returns)
This zip code:
$1,539
Kentucky:
$1,381
(% of AGI for various income ranges: 1.3% for AGIs below $25k, 0.7% for AGIs $25k-50k, 0.8% for AGIs $50k-75k, 1.1% for AGIs $75k-100k, 1.5% for AGIs $100k-200k, 2.8% for AGIs over 200k)
Ordinary dividends: $3,925 (reported on 8.4% of returns)
Here:
$3,925
State:
$6,239
(% of AGI for various income ranges: 0.3% for AGIs below $25k, 0.3% for AGIs $25k-50k, 0.4% for AGIs $50k-75k, 1.3% for AGIs $75k-100k, 4.9% for AGIs $100k-200k)
Net capital gain/loss in AGI: +$5,023 (reported on 10.0% of returns)
Here:
+$5,023
State:
+$11,336
(% of AGI for various income ranges: 0.5% for AGIs below $25k, 0.7% for AGIs $25k-50k, 1.0% for AGIs $50k-75k, 3.5% for AGIs $75k-100k, 4.2% for AGIs $100k-200k, 0.7% for AGIs over 200k)
Profit/loss from business: +$8,619 (reported on 15.6% of returns)
Here:
+$8,619
State:
+$10,862
(% of AGI for various income ranges: 8.9% for AGIs below $25k, 2.9% for AGIs $25k-50k, 2.5% for AGIs $50k-75k, 1.5% for AGIs $75k-100k, 5.7% for AGIs $100k-200k)
Taxable individual retirement arrangement distribution: $10,703 (reported on 5.5% of returns)
42633:
$10,703
Kentucky:
$14,296
(% of AGI for various income ranges: 1.6% for AGIs below $25k, 1.4% for AGIs $25k-50k, 1.5% for AGIs $50k-75k, 2.3% for AGIs $75k-100k, 3.4% for AGIs $100k-200k)
Total itemized deductions: $18,010 (21% of AGI, reported on 13.1% of returns)
Here:
$18,010
State:
$21,160
Here:
21.4% of AGI
State:
20.0% of AGI
(% of AGI for various income ranges: 3.4% for AGIs below $25k, 4.1% for AGIs $25k-50k, 7.7% for AGIs $50k-75k, 10.3% for AGIs $75k-100k, 12.6% for AGIs $100k-200k, 9.4% for AGIs over 200k)
Charity contributions: $4,989 (reported on 9.8% of returns)
Here:
$4,989
State:
$4,303
(% of AGI for various income ranges: 0.4% for AGIs below $25k, 0.7% for AGIs $25k-50k, 1.6% for AGIs $50k-75k, 2.2% for AGIs $75k-100k, 3.1% for AGIs $100k-200k, 2.5% for AGIs over 200k)
Taxes paid: $5,792 (reported on 12.9% of returns)
42633:
$5,792
State:
$8,496
(% of AGI for various income ranges: 0.5% for AGIs below $25k, 0.9% for AGIs $25k-50k, 2.0% for AGIs $50k-75k, 3.3% for AGIs $75k-100k, 4.8% for AGIs $100k-200k, 5.6% for AGIs over 200k)
Earned income credit: $2,391 (reported on 31.7% of returns)
Here:
$2,391
State:
$2,273
(% of AGI for various income ranges: 8.9% for AGIs below $25k, 1.7% for AGIs $25k-50k)
Percentage of individuals using paid preparers for their 2012 taxes: 74.9%
Here:
75%
State:
60%
(% for various income ranges: 72.0% for AGIs below $25k, 75.1% for AGIs $25k-50k, 81.5% for AGIs $50k-75k, 77.8% for AGIs $75k-100k, 87.0% for AGIs $100k-200k, 100.0% for AGIs over 200k)
Averages for the 2004 tax year for zip code 42633, filed in 2005:
Average Adjusted Gross Income (AGI) in 2004: $26,979 (Individual Income Tax Returns)
Here:
$26,979
State:
$41,540
Salary/wage: $24,870 (reported on 84.7% of returns)
Here:
$24,870
State:
$36,432
(% of AGI for various income ranges: 134.9% for AGIs below $10k, 81.0% for AGIs $10k-25k, 81.6% for AGIs $25k-50k, 78.9% for AGIs $50k-75k, 74.7% for AGIs $75k-100k, 49.0% for AGIs over 100k)
Taxable interest for individuals: $1,899 (reported on 31.5% of returns)
This zip code:
$1,899
Kentucky:
$1,571
(% of AGI for various income ranges: 8.9% for AGIs below $10k, 2.4% for AGIs $10k-25k, 1.4% for AGIs $25k-50k, 1.6% for AGIs $50k-75k, 1.3% for AGIs $75k-100k, 4.5% for AGIs over 100k)
Taxable dividends: $1,598 (reported on 9.4% of returns)
Here:
$1,598
State:
$3,453
(% of AGI for various income ranges: 0.9% for AGIs below $10k, 0.3% for AGIs $10k-25k, 0.3% for AGIs $25k-50k, 0.7% for AGIs $50k-75k, 0.5% for AGIs $75k-100k, 1.6% for AGIs over 100k)
Net capital gain/loss: +$7,963 (reported on 9.7% of returns)
Here:
+$7,963
State:
+$9,663
(% of AGI for various income ranges: 3.9% for AGIs below $10k, 2.3% for AGIs $10k-25k, 1.3% for AGIs $25k-50k, 1.5% for AGIs $50k-75k, 2.9% for AGIs $75k-100k, 10.6% for AGIs over 100k)
Profit/loss from business: +$8,729 (reported on 17.7% of returns)
Here:
+$8,729
State:
+$9,233
(% of AGI for various income ranges: 22.2% for AGIs below $10k, 6.1% for AGIs $10k-25k, 3.9% for AGIs $25k-50k, 3.6% for AGIs $50k-75k, 4.1% for AGIs $75k-100k, 11.6% for AGIs over 100k)
IRA payment deduction: $3,358 (reported on 1.5% of returns)
42633:
$3,358
Kentucky:
$2,955
(% of AGI for various income ranges: 0.2% for AGIs $10k-25k, 0.2% for AGIs $25k-50k, 0.2% for AGIs $50k-75k, 0.5% for AGIs $75k-100k)
Total itemized deductions: $14,177 (23% of AGI, reported on 14.6% of returns)
Here:
$14,177
State:
$17,474
Here:
22.9% of AGI
State:
21.0% of AGI
(% of AGI for various income ranges: 5.6% for AGIs below $10k, 3.6% for AGIs $10k-25k, 6.2% for AGIs $25k-50k, 10.2% for AGIs $50k-75k, 12.4% for AGIs $75k-100k, 11.4% for AGIs over 100k)
Charity contributions deductions: $3,698 (5% of AGI, reported on 11.0% of returns)
Here:
$3,698
State:
$3,494
Here:
5.4% of AGI
State:
4.0% of AGI
(% of AGI for various income ranges: 0.4% for AGIs below $10k, 0.6% for AGIs $10k-25k, 1.0% for AGIs $25k-50k, 1.9% for AGIs $50k-75k, 2.7% for AGIs $75k-100k, 3.2% for AGIs over 100k)
Total tax: $3,188 (reported on 66.6% of returns)
42633:
$3,188
State:
$6,162
(% of AGI for various income ranges: 5.5% for AGIs below $10k, 3.7% for AGIs $10k-25k, 5.8% for AGIs $25k-50k, 8.4% for AGIs $50k-75k, 10.7% for AGIs $75k-100k, 19.2% for AGIs over 100k)
Earned income credit: $1,858 (reported on 30.4% of returns)
Here:
$1,858
State:
$1,723
Percentage of individuals using paid preparers for their 2004 taxes: 83.9%
Here:
84%
State:
66%
(% for various income ranges: 79.8% for AGIs below $10k, 86.2% for AGIs $10k-25k, 85.2% for AGIs $25k-50k, 81.8% for AGIs $50k-75k, 86.0% for AGIs $75k-100k, 87.6% for AGIs over 100k)
Household received Food Stamps/SNAP in the past 12 months: 1,303 Household did not receive Food Stamps/SNAP in the past 12 months: 6,337
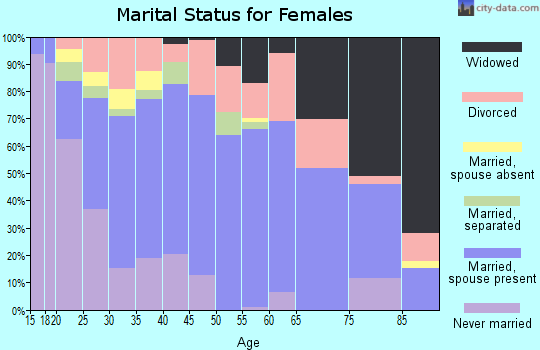
Women who had a birth in the past 12 months: 325 (194 now married, 132 unmarried) Women who did not have a birth in the past 12 months: 3,514 (1,592 now married, 1,922 unmarried)
Housing units in zip code 42633 with a mortgage: 2,105 (165 second mortgage, 6 home equity loan, 140 both second mortgage and home equity loan) Houses without a mortgage: 40
Median monthly owner costs for units with a mortgage: $948 Median monthly owner costs for units without a mortgage: $300
Residents with income below the poverty level in 2022:
This zip code:
25.5%
Whole state:
16.5%
Residents with income below 50% of the poverty level in 2022:
This zip code:
15.0%
Whole state:
9.0%
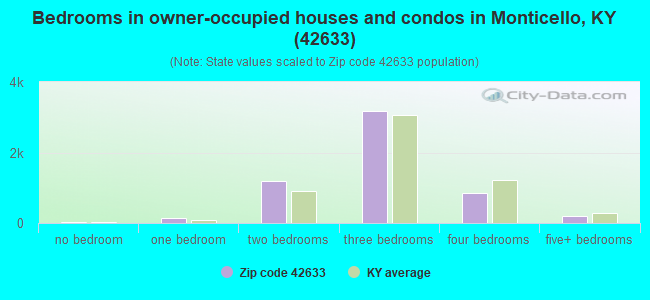
Median number of rooms in houses and condos:
Here:
5.8
State:
6.4
Median number of rooms in apartments:
Here:
4.4
State:
4.4
Notable locations in this zip code not listed on our city pages
Notable locations in zip code 42633: Camp Earl Wallace (A), Winding Gap (B), Beaver Lodge (C), Beaver Lodge Dock (D), Blue Hole (E), Bone Cave (F), Carter Dock (G), Cotton Patch (H), Cullom Rock (I), Deer Point (J), Devils Kitchen (K), Fox Rock (L), Hanging Rock (M), Happy Top (N), Hog Rock (O), Horse Rock (P), Indian Rockhouse (Q), Kelsay Mills (R), Monticello Pumping Station (S), Mose Point (T). Display/hide their locations on the map
Churches in zip code 42633 include: Fall Creek Church (A), Frazer Church (B), Concord Baptist Church (C), Clay Hill Church (D), Highway Church (E), Zion Church (F), Canada Creek Baptist Church (G), Jesus Name Church (H), Keens Chapel (I). Display/hide their locations on the map
Cemeteries: Barrier Cemetery (1), Morrow Cemetery (2), Keith Cemetery (3), Jonesville Cemetery (4), Bowling Cemetery (5), Bell Cemetery (6), Griffin Cemetery (7). Display/hide their locations on the map
Streams, rivers, and creeks: Chicken Creek (A), Bell Branch (B), Double Head Creek (C), Difficulty Creek (D), Brammer Branch (E), Burkes Creek (F), Burnett Branch (G), Dean Branch (H), Crabtree Branch (I). Display/hide their locations on the map
2,086 married couples with children.
1,213 single-parent households (228 men, 985 women).
97.0% of residents of 42633 zip code speak English at home.
2.8% of residents speak Spanish at home (55% very well, 15% well, 14% not well, 16% not at all).
0.4% of residents speak other Indo-European language at home (95% very well, 5% well).
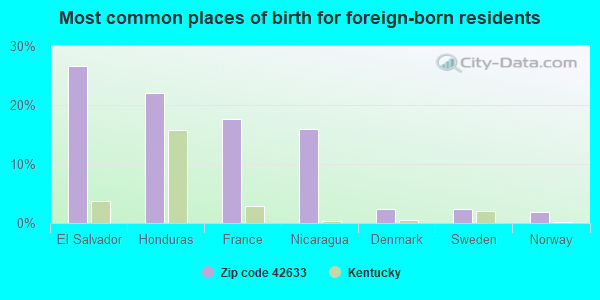
Foreign born population: 527 (2.8%) (47.8% of them are naturalized citizens)
This zip code:
2.8%
Whole state:
4.0%
27%El Salvador
22%Honduras
18%France
16%Nicaragua
2%Denmark
2%Sweden
2%Norway
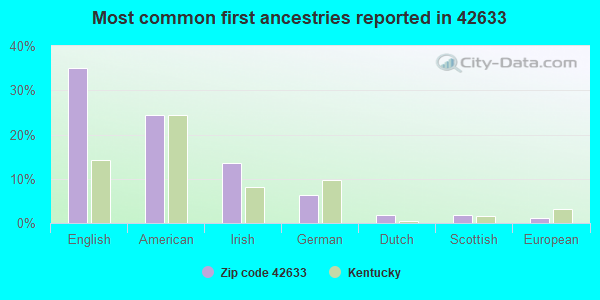
35%English
24%American
14%Irish
6%German
2%Dutch
2%Scottish
1%European
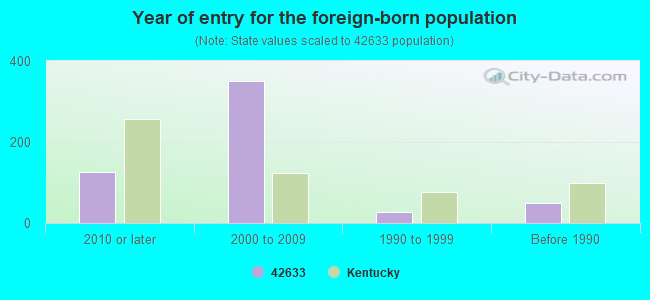
Year of entry for the foreign-born population
1262010 or later
3502000 to 2009
271990 to 1999
50Before 1990
Major facilities with environmental interests located in this zip code:
MONTICELLO WOOD INDUSTRIES (762 OLD HIGHWAY 90 in MONTICELLO, KY)
AIR MINOR (AIRS/AFS) COMPLIANCE ACTIVITY (Tracking inspections of insecticide, fungicide, and rodenticide, and toxic substances) National Pollutant Discharge Elimination System NON-MAJOR (Tracking pollutant discharge elimination systems) - permit National Pollutant Discharge Elimination System NON-MAJOR (Tracking pollutant discharge elimination systems) - permit (Resource Conservation and Recovery Act (tracking hazardous waste)) Business SIC classification: HARDWOOD DIMENSION AND FLOORING MILLS; MILLWORK Organizations: MONTICELLO WOOD INDUSTRIES LLC (CONTACT/OWNER)
, MASONITE/INTERNATIONAL PAPER (CONTACT/OWNER)
Alternative names: BURRUSS CO / GAMBLE PLT 1, BURRUSS CO / GAMBLE PLT 2, GAMBLE BROTHERS, MONTICELLO WOOD INDUSTRIES LLC
MAGO CONSTR CO (HIGHWAY 92 in MONTICELLO, KY)
AIR MINOR (AIRS/AFS) CRITERIA AND HAZARDOUS AIR POLLUTANT INVENTORY (Inventory of air pollution sources) National Pollutant Discharge Elimination System NON-MAJOR (Tracking pollutant discharge elimination systems) - permit (Resource Conservation and Recovery Act (tracking hazardous waste)) Business SIC classification: ASPHALT PAVING MIXTURES AND BLOCKS Business NAICS classification: ASPHALT PAVING MIXTURE AND BLOCK MANUFACTURING. Organizations: MAGO CONSTRUCTION CO INC (CONTACT/OWNER)
, MAGO CONSTRUCTION COMPANY (CONTACT/OWNER)
LAKE CUMBERLAND BOYS CAMP (RR 4 in MONTICELLO, KY)
COMPLIANCE ACTIVITY (Tracking inspections of insecticide, fungicide, and rodenticide, and toxic substances) (National Center for Education Statistics) - STATE ID-116581170 Organizations: WAYNE COUNTY (SCHOOL DISTRICT)
A J LLOYD MIDDLE SCHOOL (314 ALBANY RD in MONTICELLO, KY)
(National Center for Education Statistics) - STATE ID-116581435 Organizations: WAYNE COUNTY (SCHOOL DISTRICT)
MONTICELLO MIDDLE SCHOOL (135 CAVE ST in MONTICELLO, KY)
(National Center for Education Statistics) - STATE ID-116436015 Organizations: MONTICELLO INDEPENDENT (SCHOOL DISTRICT)
BELDEN WIRE & CABLE (1211 COLUMBIA AVE. in MONTICELLO, KY)
CRITERIA AND HAZARDOUS AIR POLLUTANT INVENTORY (Inventory of air pollution sources) National Pollutant Discharge Elimination System NON-MAJOR (Tracking pollutant discharge elimination systems) - permit Small Quantity Generators, between 100 kg and 1000 kg of hazardous waste/month (Resource Conservation and Recovery Act (tracking hazardous waste)) - notification TRI REPORTER (Tracking of toxic chemicals releasing facilities) Business SIC classification: DRAWING AND INSULATING OF NONFERROUS WIRE; CURRENT-CARRYING WIRING DEVICES; NONCURRENT-CARRYING WIRING DEVICES Business NAICS classification: CURRENT-CARRYING WIRING DEVICE MANUFACTURING.; CURRENT-CARRYING WIRING DEVICE MANUFACTURING.; NONCURRENT-CARRYING WIRING DEVICE MANUFACTURING. Organizations: BELDEN, INC. (CONTACT/OWNER)
, BELDEN CDT (CONTACT/OWNER)
Alternative names: BELDEN CDT
BELL ELEMENTARY SCHOOL (278 KENNY DAVIS BLVD. in MONTICELLO, KY)
(National Center for Education Statistics) - STATE ID-116581437 Organizations: WAYNE COUNTY (SCHOOL DISTRICT)
MONTICELLO ELEMENTARY SCHOOL (131 CAVE ST in MONTICELLO, KY)
(National Center for Education Statistics) - STATE ID-116436020 Organizations: MONTICELLO INDEPENDENT (SCHOOL DISTRICT)
MONTICELLO HIGH SCHOOL (135 CAVE ST in MONTICELLO, KY)
(National Center for Education Statistics) - STATE ID-116436010 Organizations: MONTICELLO INDEPENDENT (SCHOOL DISTRICT)
AMERICAN WOODMARK CORP (ROUTE 4 BOX 355 F in MONTICELLO, KY)
CRITERIA AND HAZARDOUS AIR POLLUTANT INVENTORY (Inventory of air pollution sources) National Pollutant Discharge Elimination System NON-MAJOR (Tracking pollutant discharge elimination systems) - permit TRI REPORTER (Tracking of toxic chemicals releasing facilities) Business SIC classification: WOOD KITCHEN CABINETS
MONTICELLO FLOORING & LUMBER (366 HARDWOOD DRIVE, PO BOX 637 in MONTICELLO, KY)
AIR MAJOR (AIRS/AFS) CRITERIA AND HAZARDOUS AIR POLLUTANT INVENTORY (Inventory of air pollution sources) National Pollutant Discharge Elimination System NON-MAJOR (Tracking pollutant discharge elimination systems) - permit Business SIC classification: HARDWOOD DIMENSION AND FLOORING MILLS Alternative names: MONTICELLO FLOORING & LBR
MARVIN S HICKS MONUMENTS (109 NORTH MAIN STREET in MONTICELLO, KY)
(Resource Conservation and Recovery Act (tracking hazardous waste))
BASSETT STONE COMPANY (305 VICTORY DRIVE in MONTICELLO, KY)
CRITERIA AND HAZARDOUS AIR POLLUTANT INVENTORY (Inventory of air pollution sources) National Pollutant Discharge Elimination System NON-MAJOR (Tracking pollutant discharge elimination systems) - permit Business SIC classification: CRUSHED AND BROKEN LIMESTONE
Housing units lacking complete plumbing facilities: 2.9% Housing units lacking complete kitchen facilities: 3.2%
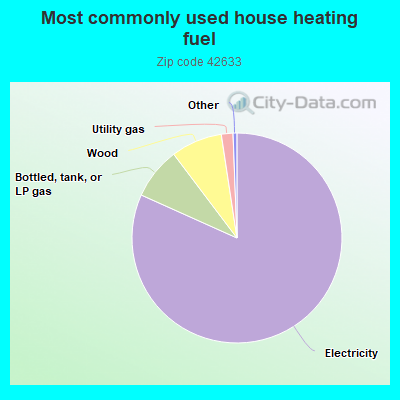
81.8%Electricity
8.0%Bottled, tank, or LP gas
7.9%Wood
1.8%Utility gas
Population in 1990: 13,523. Population change in the 1990s: +5,030 (+37.2%).
Place of birth for U.S.-born residents:
This state: 14,356
Northeast: 383
Midwest: 1,848
South: 799
West: 449
64% of the 42633 zip code residents lived in the same house 5 years ago. Out of people who lived in different houses, 71% lived in this county. Out of people who lived in different counties, 50% lived in Kentucky.
93% of the 42633 zip code residents lived in the same house 1 year ago. Out of people who lived in different houses, 47% moved from this county. Out of people who lived in different houses, 27% moved from different county within same state. Out of people who lived in different houses, 26% moved from different state. Out of people who lived in different houses, 2% moved from abroad.
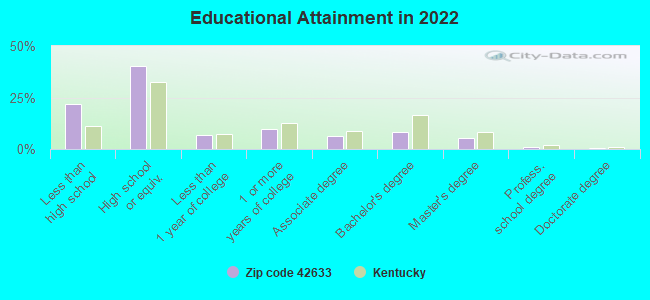
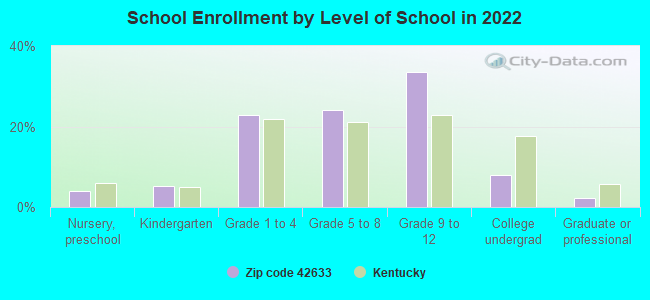
Private vs. public school enrollment:
Students in private schools in grades 1 to 8 (elementary and middle school): 219
Here:
14.9%
Kentucky:
17.2%
Students in private schools in grades 9 to 12 (high school): 12
Here:
1.2%
Kentucky:
15.2%
Students in private undergraduate colleges: 60
Here:
23.6%
Kentucky:
19.6%
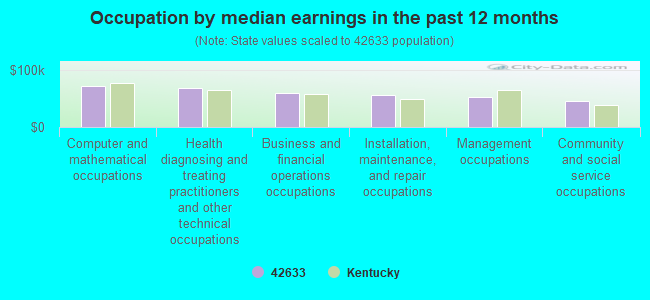
Occupation by median earnings in the past 12 months ($)
71,898Computer and mathematical occupations
67,985Health diagnosing and treating practitioners and other technical occupations
60,423Business and financial operations occupations
57,086Installation, maintenance, and repair occupations
52,278Management occupations
45,414Community and social service occupations
Companies with federal contracts located in this zip code:
PATRIOT INDUSTRIES, INC (1 QUALITY DR in MONTICELLO, KY; small business) : $4,282,709 in 16 contractsfrom 2002 to 2006
Contracts for Outerwear, Men's, Individual Equipment, Clothing, Special Purpose, Specialized Shipping and Storage Containers by Defense Logistics Agency, Air Force, Agricultural Research Service (disused code), Army, and others Signed by year:2000: $0; 2001: $0; 2002: $110,711; 2003: $2,348,888; 2004: $1,698,570; 2005: $112,273; 2006: $12,267.
Biggest contracts:
$2,382,119 with Defense Logistics Agency for Outerwear, Men's. Signed on 2003-10-27. Completion date: 2005-05-23.
$1,660,000 with Defense Logistics Agency for Individual Equipment. Signed on 2004-02-25. Completion date: 2004-10-31.
$51,152 with Air Force for Clothing, Special Purpose. Signed on 2002-06-07. Completion date: 2002-08-01.
$38,570, same as above.Signed on 2004-01-20. Completion date: 2004-04-30.
LA CROSSE ENCLOSURES, INC (119 CREEKVIEW DRIVE in MONTICELLO, KY; small business) : $1,827,073 in 7 contractsfrom 2002 to 2006
Contracts for Luggage, Tents and Tarpaulins by Defense Logistics Agency Signed by year:2000: $0; 2001: $0; 2002: $71,775; 2003: $0; 2004: $1,377,836; 2005: $96,768; 2006: $280,694.
Biggest contracts:
$1,377,836 with Defense Logistics Agency for Luggage. Signed on 2004-04-05. Completion date: 2005-03-15.
$181,440, same as above.Signed on 2006-04-10. Completion date: 2006-10-30.
$99,254, same as above.Signed on 2006-04-20. Completion date: 2006-09-01.
$96,768, same as above.Signed on 2005-03-31. Completion date: 2005-06-03.
COUNTY JUDGE EXECUTIVE (109 N MAIN STREET in MONTICELLO, KY) : $25,531 in 2 contractsin 2001
$25,531 with U.S. Army Corps of Engineers - civil program financing only for Guard Services. Signed on 2001-01-01. Completion date: 2001-12-31.
$0, same as above.Signed on 2001-01-01. Completion date: 2001-12-31.
Top industries in this zip code by the number of employees in 2005:
Information: Data Processing, Hosting, and Related Services (100-249: 1)
Health Care and Social Assistance: General Medical and Surgical Hospitals (100-249: 1)
People in group quarters in 2010:
186 people in local jails and other municipal confinement facilities
104 people in nursing facilities/skilled-nursing facilities
40 people in correctional facilities intended for juveniles
People in group quarters in 2000:
107 people in nursing homes
41 people in training schools for juvenile delinquents
28 people in local jails and other confinement facilities (including police lockups)
5 people in wards in general hospitals for patients who have no usual home elsewhere
3 people in agriculture workers' dormitories on farms
Fatal accident statistics in 2014:
Fatal accident count: 2
Vehicles involved in fatal accidents: 2
Fatal accidents caused by drunken drivers: 0
Fatalities: 3
Persons involved in fatal accidents: 4
Pedestrians involved in fatal accidents: 0
Fatal accident statistics in 2013:
Fatal accident count: 1
Vehicles involved in fatal accidents: 3
Fatal accidents caused by drunken drivers: 0
Fatalities: 2
Persons involved in fatal accidents: 5
Pedestrians involved in fatal accidents: 0
2002 - 2018 National Fire Incident Reporting System (NFIRS) incidents
Based on the data from the years 2002 - 2018 the average number of fire incidents per year is 121. The highest number of fire incidents - 212 took place in 2007, and the least - 32 in 2002. The data has an increasing trend.
When looking into fire subcategories, the most reports belonged to: Structure Fires (41.8%), and Outside Fires (34.6%).
Fire incident types reported to NFIRS in Zip Code 42633
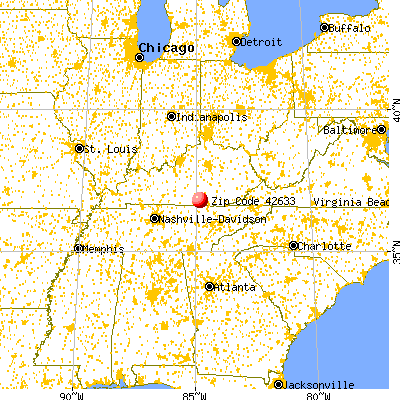


 Nearest zip codes: 42603, 42544, 42647, 42518, 38577, 42602.


 Based on the data from the years 2002 - 2018 the average number of fire incidents per year is 121. The highest number of fire incidents - 212 took place in 2007, and the least - 32 in 2002. The data has an increasing trend.
 When looking into fire subcategories, the most reports belonged to: Structure Fires (41.8%), and Outside Fires (34.6%).