Estimated zip code population in 2022: 12,580 Zip code population in 2010: 12,272 Zip code population in 2000: 14,644
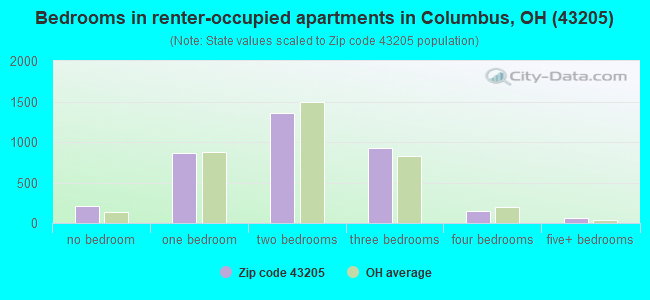
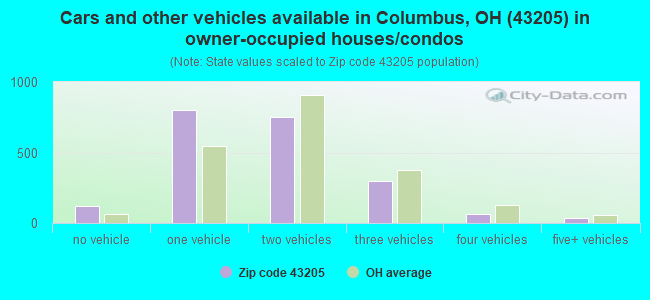
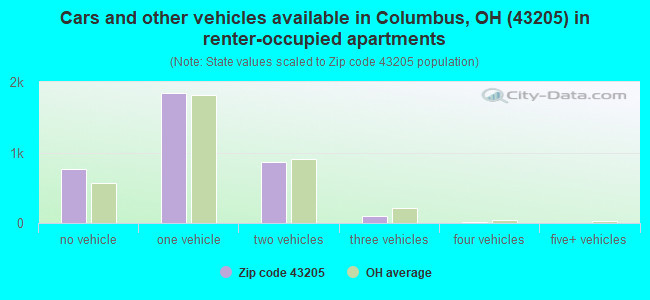
Houses and condos: 7,408 Renter-occupied apartments: 3,578
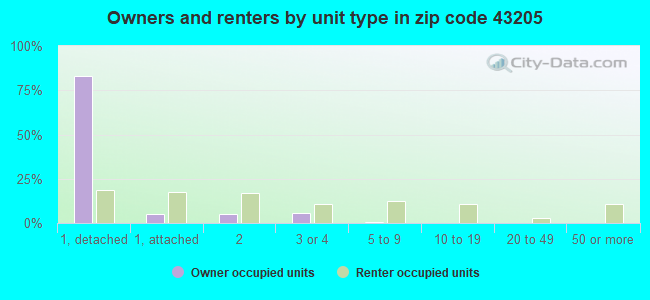
% of renters here:
63%
State:
33%
March 2022 cost of living index in zip code 43205: 97.4 (near average, U.S. average is 100)
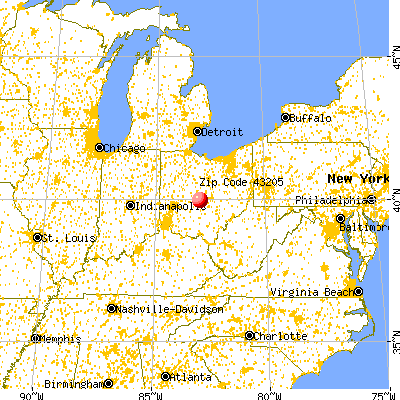
Land area: 2.4 sq. mi. Water area: 0.0 sq. mi.
Population density: 5,303 people per square mile
(average).
OSM Map
General Map
Google Map
MSN Map
OSM Map
General Map
Google Map
MSN Map
OSM Map
General Map
Google Map
MSN Map
OSM Map
General Map
Google Map
MSN Map
Please wait while loading the map...
Real estate property taxes paid for housing units in 2022:
This zip code:
0.8% ($2,681)
Ohio:
1.3% ($2,639)
Median real estate property taxes paid for housing units with mortgages in 2022: $3,112 (0.9%) Median real estate property taxes paid for housing units with no mortgage in 2022: $1,845 (0.8%)
Averages for the 2020 tax year for zip code 43205, filed in 2021:
Average Adjusted Gross Income (AGI) in 2020: $48,177 (Individual Income Tax Returns)
Here:
$48,177
State:
$67,288
Salary/wage: $43,783 (reported on 88.5% of returns)
Here:
$43,783
State:
$55,628
(% of AGI for various income ranges: 1111.8% for AGIs below $25k, 3719.1% for AGIs $25k-50k, 7052.8% for AGIs $50k-75k, 11021.6% for AGIs $75k-100k, 22098.1% for AGIs $100k-200k, 82692.5% for AGIs over 200k)
Taxable interest for individuals: $393 (reported on 13.7% of returns)
This zip code:
$393
Ohio:
$1,518
(% of AGI for various income ranges: 1.7% for AGIs below $25k, 3.4% for AGIs $25k-50k, 6.1% for AGIs $50k-75k, 15.2% for AGIs $75k-100k, 30.8% for AGIs $100k-200k, 237.5% for AGIs over 200k)
Ordinary dividends: $3,501 (reported on 11.0% of returns)
Here:
$3,501
State:
$7,167
(% of AGI for various income ranges: 4.6% for AGIs below $25k, 4.2% for AGIs $25k-50k, 19.2% for AGIs $50k-75k, 91.6% for AGIs $75k-100k, 142.3% for AGIs $100k-200k, 3847.5% for AGIs over 200k)
Net capital gain/loss in AGI: +$9,291 (reported on 10.7% of returns)
Here:
+$9,291
State:
+$18,919
(% of AGI for various income ranges: 3.2% for AGIs below $25k, 13.2% for AGIs $25k-50k, 26.1% for AGIs $50k-75k, 159.2% for AGIs $75k-100k, 514.6% for AGIs $100k-200k, 10137.5% for AGIs over 200k)
Profit/loss from business: +$9,637 (reported on 17.9% of returns)
Here:
+$9,637
State:
+$13,744
(% of AGI for various income ranges: 106.5% for AGIs below $25k, 113.2% for AGIs $25k-50k, 226.9% for AGIs $50k-75k, 360.0% for AGIs $75k-100k, 1313.8% for AGIs $100k-200k, 2722.5% for AGIs over 200k)
Taxable individual retirement arrangement distribution: $13,712 (reported on 2.6% of returns)
43205:
$13,712
Ohio:
$18,876
(% of AGI for various income ranges: 12.0% for AGIs below $25k, 20.0% for AGIs $25k-50k, 105.9% for AGIs $50k-75k, 377.7% for AGIs $100k-200k)
Self-employed (Keogh) retirement plans: $16,500 (reported on 0.3% of returns)
43205:
$16,500
Ohio:
$24,898
(% of AGI for various income ranges: 132.0% for AGIs $75k-100k)
Total itemized deductions: $22,377 (reported on 6.2% of returns)
Here:
$22,377
State:
$33,869
(% of AGI for various income ranges: 28.5% for AGIs below $25k, 267.4% for AGIs $50k-75k, 564.8% for AGIs $75k-100k, 1163.5% for AGIs $100k-200k, 5165.0% for AGIs over 200k)
Charity contributions: $6,158 (reported on 4.1% of returns)
Here:
$6,158
State:
$14,577
(% of AGI for various income ranges: 76.1% for AGIs $50k-75k, 58.4% for AGIs $75k-100k, 188.1% for AGIs $100k-200k, 1255.0% for AGIs over 200k)
Taxes paid: $7,755 (reported on 6.1% of returns)
43205:
$7,755
State:
$7,681
(% of AGI for various income ranges: 5.1% for AGIs below $25k, 78.2% for AGIs $50k-75k, 229.6% for AGIs $75k-100k, 458.8% for AGIs $100k-200k, 1492.5% for AGIs over 200k)
Earned income credit: $2,530 (reported on 25.7% of returns)
Here:
$2,530
State:
$2,304
(% of AGI for various income ranges: 145.2% for AGIs below $25k, 66.6% for AGIs $25k-50k)
Percentage of individuals using paid preparers for their 2020 taxes: 94.4%
Here:
94%
State:
94%
(% for various income ranges: 93.6% for AGIs below $25k, 94.9% for AGIs $25k-50k, 95.1% for AGIs $50k-75k, 94.6% for AGIs $75k-100k, 94.0% for AGIs $100k-200k, 100.0% for AGIs over 200k)
Averages for the 2012 tax year for zip code 43205, filed in 2013:
Average Adjusted Gross Income (AGI) in 2012: $30,021 (Individual Income Tax Returns)
Here:
$30,021
State:
$54,926
Salary/wage: $27,892 (reported on 87.0% of returns)
Here:
$27,892
State:
$45,869
(% of AGI for various income ranges: 80.5% for AGIs below $25k, 85.5% for AGIs $25k-50k, 83.6% for AGIs $50k-75k, 85.3% for AGIs $75k-100k, 77.0% for AGIs $100k-200k, 58.2% for AGIs over 200k)
Taxable interest for individuals: $304 (reported on 10.7% of returns)
This zip code:
$304
Ohio:
$1,297
(% of AGI for various income ranges: 0.2% for AGIs $50k-75k, 0.2% for AGIs $75k-100k, 0.1% for AGIs $100k-200k)
Ordinary dividends: $2,664 (reported on 6.2% of returns)
Here:
$2,664
State:
$5,821
(% of AGI for various income ranges: 0.1% for AGIs below $25k, 0.3% for AGIs $25k-50k, 0.3% for AGIs $50k-75k, 0.3% for AGIs $75k-100k, 2.6% for AGIs $100k-200k)
Net capital gain/loss in AGI: +$1,792 (reported on 4.5% of returns)
Here:
+$1,792
State:
+$11,232
(% of AGI for various income ranges: 0.2% for AGIs $25k-50k, 1.9% for AGIs $100k-200k)
Profit/loss from business: +$7,469 (reported on 17.1% of returns)
Here:
+$7,469
State:
+$12,773
(% of AGI for various income ranges: 12.3% for AGIs below $25k, 2.0% for AGIs $25k-50k, 3.0% for AGIs $50k-75k, 0.4% for AGIs $75k-100k, 1.2% for AGIs $100k-200k)
Taxable individual retirement arrangement distribution: $11,275 (reported on 3.0% of returns)
43205:
$11,275
Ohio:
$14,511
(% of AGI for various income ranges: 0.3% for AGIs below $25k, 0.9% for AGIs $25k-50k, 2.4% for AGIs $50k-75k, 3.0% for AGIs $100k-200k)
Total itemized deductions: $16,309 (21% of AGI, reported on 14.9% of returns)
Here:
$16,309
State:
$21,278
Here:
21.4% of AGI
State:
18.8% of AGI
(% of AGI for various income ranges: 3.1% for AGIs below $25k, 5.9% for AGIs $25k-50k, 10.6% for AGIs $50k-75k, 14.0% for AGIs $75k-100k, 13.8% for AGIs $100k-200k, 10.1% for AGIs over 200k)
Charity contributions: $2,970 (reported on 10.7% of returns)
Here:
$2,970
State:
$3,943
(% of AGI for various income ranges: 0.3% for AGIs below $25k, 0.7% for AGIs $25k-50k, 1.5% for AGIs $50k-75k, 2.1% for AGIs $75k-100k, 2.2% for AGIs $100k-200k, 0.9% for AGIs over 200k)
Taxes paid: $6,579 (reported on 14.5% of returns)
43205:
$6,579
State:
$9,568
(% of AGI for various income ranges: 0.7% for AGIs below $25k, 1.7% for AGIs $25k-50k, 3.9% for AGIs $50k-75k, 5.3% for AGIs $75k-100k, 6.8% for AGIs $100k-200k, 6.3% for AGIs over 200k)
Earned income credit: $2,519 (reported on 37.7% of returns)
Here:
$2,519
State:
$2,285
(% of AGI for various income ranges: 11.8% for AGIs below $25k, 1.0% for AGIs $25k-50k)
Percentage of individuals using paid preparers for their 2012 taxes: 36.0%
Here:
36%
State:
51%
(% for various income ranges: 34.3% for AGIs below $25k, 34.1% for AGIs $25k-50k, 40.5% for AGIs $50k-75k, 47.1% for AGIs $75k-100k, 64.7% for AGIs $100k-200k, 0.0% for AGIs over 200k)
Averages for the 2004 tax year for zip code 43205, filed in 2005:
Average Adjusted Gross Income (AGI) in 2004: $24,943 (Individual Income Tax Returns)
Here:
$24,943
State:
$44,480
Salary/wage: $24,258 (reported on 88.7% of returns)
Here:
$24,258
State:
$39,198
(% of AGI for various income ranges: 96.1% for AGIs below $10k, 84.9% for AGIs $10k-25k, 86.7% for AGIs $25k-50k, 89.6% for AGIs $50k-75k, 90.7% for AGIs $75k-100k, 76.0% for AGIs over 100k)
Taxable interest for individuals: $556 (reported on 17.1% of returns)
This zip code:
$556
Ohio:
$1,532
(% of AGI for various income ranges: 0.4% for AGIs below $10k, 0.5% for AGIs $10k-25k, 0.3% for AGIs $25k-50k, 0.4% for AGIs $50k-75k, 0.2% for AGIs $75k-100k, 0.4% for AGIs over 100k)
Taxable dividends: $1,382 (reported on 7.4% of returns)
Here:
$1,382
State:
$3,496
(% of AGI for various income ranges: 0.3% for AGIs below $10k, 0.2% for AGIs $10k-25k, 0.2% for AGIs $25k-50k, 0.2% for AGIs $50k-75k, 0.2% for AGIs $75k-100k, 2.0% for AGIs over 100k)
Net capital gain/loss: +$1,725 (reported on 5.1% of returns)
Here:
+$1,725
State:
+$8,582
(% of AGI for various income ranges: -0.4% for AGIs below $10k, -0.1% for AGIs $10k-25k, 0.5% for AGIs $25k-50k, 0.0% for AGIs $50k-75k, -0.1% for AGIs $75k-100k, 1.7% for AGIs over 100k)
Profit/loss from business: +$5,319 (reported on 11.2% of returns)
Here:
+$5,319
State:
+$10,813
(% of AGI for various income ranges: 5.6% for AGIs below $10k, 3.4% for AGIs $10k-25k, 2.1% for AGIs $25k-50k, 2.3% for AGIs $50k-75k, 1.2% for AGIs $75k-100k, 0.5% for AGIs over 100k)
IRA payment deduction: $1,615 (reported on 1.1% of returns)
43205:
$1,615
Ohio:
$2,794
Self-employed pension: $7,600 (reported on 0.2% of returns)
Here:
$7,600
Ohio:
$13,981
Total itemized deductions: $13,955 (25% of AGI, reported on 18.6% of returns)
Here:
$13,955
State:
$17,503
Here:
25.0% of AGI
State:
20.8% of AGI
(% of AGI for various income ranges: 4.2% for AGIs below $10k, 4.9% for AGIs $10k-25k, 10.1% for AGIs $25k-50k, 13.9% for AGIs $50k-75k, 17.7% for AGIs $75k-100k, 15.9% for AGIs over 100k)
Charity contributions deductions: $2,568 (4% of AGI, reported on 15.1% of returns)
Here:
$2,568
State:
$3,087
Here:
4.5% of AGI
State:
3.4% of AGI
(% of AGI for various income ranges: 0.3% for AGIs below $10k, 0.7% for AGIs $10k-25k, 1.6% for AGIs $25k-50k, 2.2% for AGIs $50k-75k, 2.5% for AGIs $75k-100k, 2.4% for AGIs over 100k)
Total tax: $3,640 (reported on 59.0% of returns)
43205:
$3,640
State:
$6,781
(% of AGI for various income ranges: 1.8% for AGIs below $10k, 3.4% for AGIs $10k-25k, 7.7% for AGIs $25k-50k, 11.4% for AGIs $50k-75k, 12.8% for AGIs $75k-100k, 18.3% for AGIs over 100k)
Earned income credit: $1,903 (reported on 38.5% of returns)
Here:
$1,903
State:
$1,696
Percentage of individuals using paid preparers for their 2004 taxes: 56.0%
Here:
56%
State:
55%
(% for various income ranges: 57.4% for AGIs below $10k, 60.8% for AGIs $10k-25k, 50.7% for AGIs $25k-50k, 46.2% for AGIs $50k-75k, 45.9% for AGIs $75k-100k, 63.2% for AGIs over 100k)
Likely homosexual households (counted as self-reported same-sex unmarried-partner households)
Lesbian couples: 0.0% of all households
Gay men: 1.8% of all households
Household received Food Stamps/SNAP in the past 12 months: 1,434 Household did not receive Food Stamps/SNAP in the past 12 months: 4,273
Women who had a birth in the past 12 months: 202 (43 now married, 153 unmarried) Women who did not have a birth in the past 12 months: 3,158 (975 now married, 2,183 unmarried)
Housing units in zip code 43205 with a mortgage: 1,480 (185 second mortgage, 35 home equity loan, 144 both second mortgage and home equity loan) Houses without a mortgage: 34
Median monthly owner costs for units with a mortgage: $1,690 Median monthly owner costs for units without a mortgage: $561
Residents with income below the poverty level in 2022:
This zip code:
27.0%
Whole state:
13.4%
Residents with income below 50% of the poverty level in 2022:
This zip code:
16.7%
Whole state:
7.0%
Median number of rooms in houses and condos:
Here:
6.9
State:
6.7
Median number of rooms in apartments:
Here:
4.6
State:
4.4
Notable locations in this zip code not listed on our city pages
Notable locations in zip code 43205: Martin Luther King Library (A), Driving Park Library (B), Saint Vincents Orphanage (C), Ohio State Archives (D), Columbus Division of Fire Station 15 Driving Park Fire Station (E), Columbus Music Hall (F), Pauline Home (G). Display/hide their locations on the map
Churches in zip code 43205 include: Upper Room Church of God (A), United House of Prayer for All People (B), Tabernacle of Christian Fellowship (C), Saint Mark Baptist Church (D), Royal Assembly Church (E), Pentecostal Mission Deliverance Church (F), Pentecostal Deliverance Church (G), Pathway Community Mission (H), Paradise Baptist Church (I). Display/hide their locations on the map
Parks in zip code 43205 include: Blackburn Playground (1), Academy Park (2), Rainbow Park (3), Columbus Near East Side Historic District (4), English Park (5), Hanford Village Park (6), Livingston Park (7), East Broad Street Historic District (8), Willis Park (9). Display/hide their locations on the map
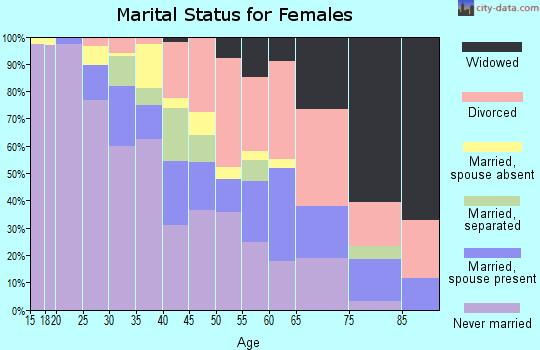
546 married couples with children.
1,683 single-parent households (217 men, 1,466 women).
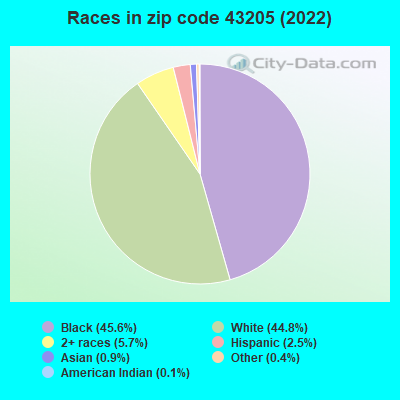
94.6% of residents of 43205 zip code speak English at home.
1.1% of residents speak Spanish at home (59% very well, 12% well, 16% not well, 12% not at all).
2.6% of residents speak other Indo-European language at home (78% very well, 21% well, 2% not well).
0.7% of residents speak Asian or Pacific Island language at home (62% very well, 38% not well).
0.5% of residents speak other language at home (82% very well, 18% well).
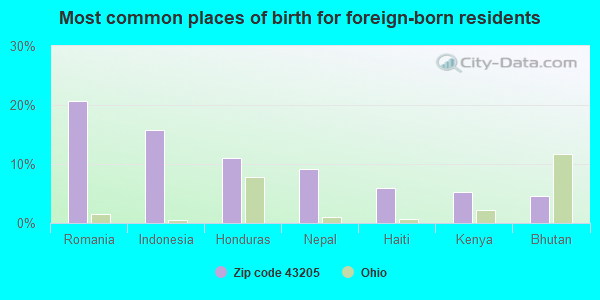
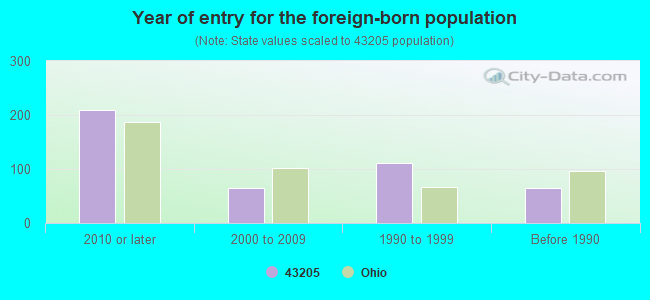
Foreign born population: 417 (3.3%) (55.6% of them are naturalized citizens)
Facilities with environmental interests located in this zip code:
BP OIL CO NO 07746 * (825 E BROAD ST in COLUMBUS, OH)
STATE MASTER (Ohio general info) - AIR MAJOR STATE MASTER (Ohio general info) - -76-5541-168-4, EPCRA Conditionally Exempt Small Quantity Generators, less than 100 kg/month of hazardous waste (Resource Conservation and Recovery Act (tracking hazardous waste)) - notification Business SIC classification: GASOLINE SERVICE STATIONS Organizations: BP OIL COMPANY (CONTACT/OWNER)
, BP AMOCO CO (CONTACT/OWNER)
Alternative names: BP OIL CO SITE 07746
BODY MECHANICS BODY SHOP INC (549 HOLTZMAN AVE in COLUMBUS, OH)
STATE MASTER (Ohio general info) - AIR MAJOR, RCRA-OHD987034683, HAZARDOUS WASTE PROGRAM Conditionally Exempt Small Quantity Generators, less than 100 kg/month of hazardous waste (Resource Conservation and Recovery Act (tracking hazardous waste)) - notification Organizations: JAY A COYER (CONTACT/OWNER)
, SAMUEL J LEVY (CONTACT/OWNER)
ACCURATE AUTO CENTER (1726 E MAIN in COLUMBUS, OH)
STATE MASTER (Ohio general info) - RCRA-OHR000005819, HAZARDOUS WASTE PROGRAM Conditionally Exempt Small Quantity Generators, less than 100 kg/month of hazardous waste (Resource Conservation and Recovery Act (tracking hazardous waste)) - notification Organizations: HARRY MACKLIN (CONTACT/OWNER)
BP OIL CO (1075 E MAIN ST in COLUMBUS, OH)
(Resource Conservation and Recovery Act (tracking hazardous waste)) Organizations: BP OIL COMPANY (CONTACT/OWNER)
Housing units lacking complete plumbing facilities: 7.6% Housing units lacking complete kitchen facilities: 8.5%
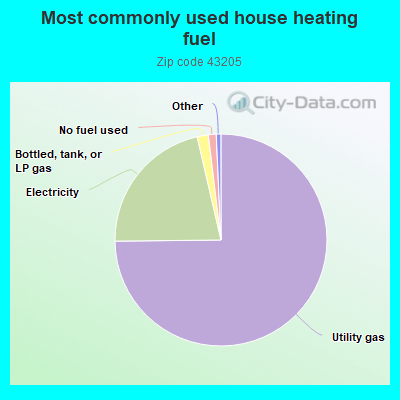
74.9%Utility gas
21.6%Electricity
1.7%Bottled, tank, or LP gas
1.2%No fuel used
Population in 1990: 17,567.
Place of birth for U.S.-born residents:
This state: 8,987
Northeast: 596
Midwest: 467
South: 1,717
West: 338
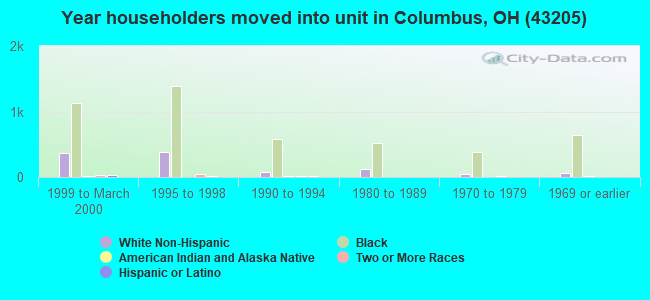
51% of the 43205 zip code residents lived in the same house 5 years ago. Out of people who lived in different houses, 83% lived in this county. Out of people who lived in different counties, 50% lived in Ohio.
73% of the 43205 zip code residents lived in the same house 1 year ago. Out of people who lived in different houses, 66% moved from this county. Out of people who lived in different houses, 12% moved from different county within same state. Out of people who lived in different houses, 14% moved from different state. Out of people who lived in different houses, 1% moved from abroad.
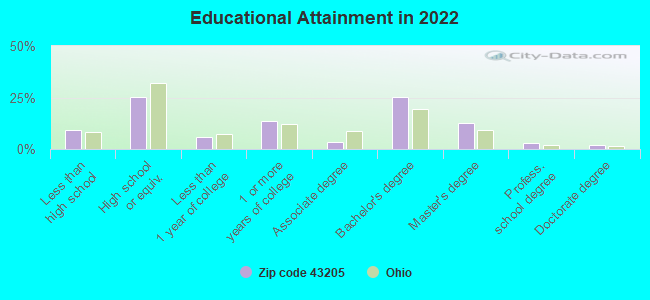
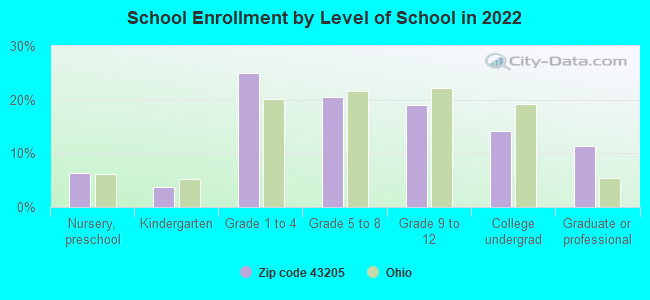
Private vs. public school enrollment:
Students in private schools in grades 1 to 8 (elementary and middle school): 141
Here:
12.8%
Ohio:
16.0%
Students in private schools in grades 9 to 12 (high school): 61
Here:
13.3%
Ohio:
13.1%
Students in private undergraduate colleges: 43
Here:
12.6%
Ohio:
22.3%
Occupation by median earnings in the past 12 months ($)
102,552Legal occupations
87,963Health diagnosing and treating practitioners and other technical occupations
76,482Computer and mathematical occupations
61,079Management occupations
58,204Business and financial operations occupations
56,367Architecture and engineering occupations
Companies with federal contracts located in this zip code (COLUMBUS, OH):
CAPITAL TRANSPORTATION, INC (1610 OAK STREET; small business) : $1,442,328 in 18 contractsfrom 1999 to 2006
Contracts for Motor Passenger Services, Passenger Motor Charter Service by Defense Logistics Agency Signed by year:2000: $146,034; 2001: $179,000; 2002: $0; 2003: $0; 2004: $573,088; 2005: $370,851; 2006: -$85.
Biggest contracts:
$270,753 with Defense Logistics Agency for Motor Passenger Services. Signed on 2005-12-09. Completion date: 2005-12-09.
$250,616, same as above.Signed on 2004-12-01. Completion date: 2005-12-31.
$236,090, same as above.Signed on 2004-01-01. Completion date: 2004-12-31.
$173,440 with Defense Logistics Agency for Passenger Motor Charter Service. Signed on 1999-11-23. Completion date: 2000-12-31.
THE OHIO STATE UNIVERSITY (1492 E BROAD ST) : $375,712 in 2 contractsfrom 2005 to 2006
$375,718 with Defense Logistics Agency for Other Medical Services. Signed on 2005-11-30. Completion date: 2006-12-05.
-$6, same as above.Signed on 2006-06-20. Completion date: 2006-12-05.
CHURCHILL AND COMPANY (700 ALUM CREEK DRIVE; small business)
$330,111 with Defense Logistics Agency for Fire Fighting Equipment. Signed on 1999-11-18. Completion date: 2000-01-18.
CHILDREN`S RADIOLOGICAL INSTIT (700 CHILDRENS DR)
$3,699 with Army for Personnel Testing. Taking place in HI. Signed on 2006-03-14. Completion date: 2006-03-17.
SMITH & JOHNSON CONSTRUCTION C (1745; small business)
-$42,536 with Air Force for Landscaping/Groundskeeping Services. Taking place in FL. Signed on 2000-11-15. Completion date: 1999-12-01.
Top industries in this zip code by the number of employees in 2005:
Health Care and Social Assistance: General Medical and Surgical Hospitals (over 1000 employees: 1 establishment, 500-999 employees: 1 establishment)
Administrative and Support and Waste Management and Remediation Services: Temporary Help Services (250-499: 2)
Health Care and Social Assistance: Offices of Physicians (except Mental Health Specialists) (250-499: 1, 20-49: 3, 10-19: 8, 5-9: 2, 1-4: 9)
Health Care and Social Assistance: All Other Outpatient Care Centers (100-249: 2, 20-49: 1, 5-9: 1)
Professional, Scientific, and Technical Services: Research and Development in the Physical, Engineering, and Life Sciences (250-499: 1)
Health Care and Social Assistance: Blood and Organ Banks (250-499: 1)
Health Care and Social Assistance: Outpatient Mental Health and Substance Abuse Centers (100-249: 1, 50-99: 1, 10-19: 1)
Health Care and Social Assistance: Other Individual and Family Services (100-249: 1, 20-49: 2, 5-9: 1, 1-4: 1)
Health Care and Social Assistance: Offices of Physical, Occupational and Speech Therapists, and Audiologists (100-249: 1, 20-49: 2)
People in group quarters in 2010:
223 people in other noninstitutional facilities
151 people in emergency and transitional shelters (with sleeping facilities) for people experiencing homelessness
141 people in nursing facilities/skilled-nursing facilities
109 people in correctional residential facilities
15 people in group homes intended for adults
13 people in residential treatment centers for adults
12 people in residential treatment centers for juveniles (non-correctional)
People in group quarters in 2000:
227 people in other noninstitutional group quarters
133 people in nursing homes
27 people in homes or halfway houses for drug/alcohol abuse
13 people in hospitals or wards for drug/alcohol abuse
12 people in homes for the mentally ill
10 people in unknown juvenile institutions
Fatal accident statistics in 2014:
Fatal accident count: 1
Vehicles involved in fatal accidents: 2
Fatal accidents caused by drunken drivers: 0
Fatalities: 1
Persons involved in fatal accidents: 2
Pedestrians involved in fatal accidents: 0
Fatal accident statistics in 2013:
Fatal accident count: 3
Vehicles involved in fatal accidents: 6
Fatal accidents caused by drunken drivers: 1
Fatalities: 3
Persons involved in fatal accidents: 8
Pedestrians involved in fatal accidents: 2
Home Mortgage Disclosure Act Aggregated Statistics For Year 2009 (Based on 8 full and 2 partial tracts)
A) FHA, FSA/RHS & VA Home Purchase Loans
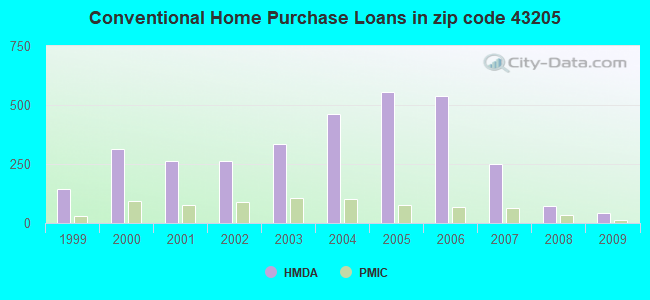
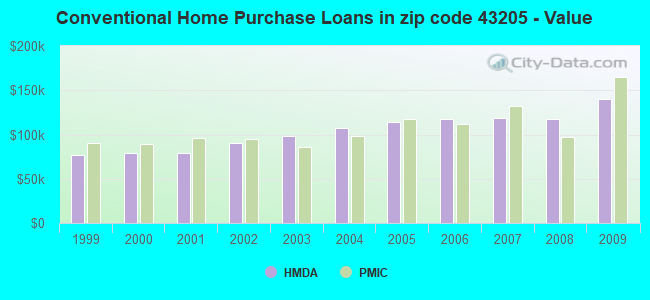
B) Conventional Home Purchase Loans
C) Refinancings
D) Home Improvement Loans
E) Loans on Dwellings For 5+ Families
F) Non-occupant Loans on < 5 Family Dwellings (A B C & D)
Number
Average Value
Number
Average Value
Number
Average Value
Number
Average Value
Number
Average Value
Number
Average Value
LOANS ORIGINATED
71
$121,141
43
$139,665
106
$179,766
8
$18,932
6
$164,195
31
$116,575
APPLICATIONS APPROVED, NOT ACCEPTED
6
$131,302
11
$68,334
17
$108,742
4
$7,048
2
$135,100
5
$87,448
APPLICATIONS DENIED
21
$87,435
31
$131,559
125
$130,860
32
$33,592
4
$114,905
51
$74,393
APPLICATIONS WITHDRAWN
11
$89,694
13
$163,338
49
$111,797
4
$27,000
2
$76,970
15
$79,345
FILES CLOSED FOR INCOMPLETENESS
4
$92,478
3
$83,517
15
$128,069
0
$0
0
$0
0
$0
Aggregated Statistics For Year 2008 (Based on 8 full and 2 partial tracts)
A) FHA, FSA/RHS & VA Home Purchase Loans
B) Conventional Home Purchase Loans
C) Refinancings
D) Home Improvement Loans
E) Loans on Dwellings For 5+ Families
F) Non-occupant Loans on < 5 Family Dwellings (A B C & D)
Number
Average Value
Number
Average Value
Number
Average Value
Number
Average Value
Number
Average Value
Number
Average Value
LOANS ORIGINATED
45
$122,484
71
$117,397
171
$117,596
32
$57,642
11
$250,164
102
$85,757
APPLICATIONS APPROVED, NOT ACCEPTED
4
$186,462
18
$169,172
31
$147,672
12
$11,167
2
$13,100
12
$84,475
APPLICATIONS DENIED
24
$108,081
90
$96,960
218
$118,484
75
$42,925
2
$85,155
90
$89,934
APPLICATIONS WITHDRAWN
9
$87,057
25
$122,229
66
$111,009
6
$25,398
0
$0
20
$109,195
FILES CLOSED FOR INCOMPLETENESS
4
$66,265
6
$136,687
21
$142,127
2
$10,000
2
$2,702,040
10
$122,399
Aggregated Statistics For Year 2007 (Based on 8 full and 2 partial tracts)
A) FHA, FSA/RHS & VA Home Purchase Loans
B) Conventional Home Purchase Loans
C) Refinancings
D) Home Improvement Loans
E) Loans on Dwellings For 5+ Families
F) Non-occupant Loans on < 5 Family Dwellings (A B C & D)
G) Loans On Manufactured Home Dwelling (A B C & D)
Number
Average Value
Number
Average Value
Number
Average Value
Number
Average Value
Number
Average Value
Number
Average Value
Number
Average Value
LOANS ORIGINATED
28
$97,554
248
$118,801
276
$104,762
54
$46,043
69
$95,423
215
$95,769
2
$85,155
APPLICATIONS APPROVED, NOT ACCEPTED
4
$53,468
88
$107,892
70
$121,807
10
$37,436
0
$0
59
$114,703
0
$0
APPLICATIONS DENIED
51
$106,166
261
$121,475
435
$110,106
91
$51,265
7
$1,179,087
261
$115,502
0
$0
APPLICATIONS WITHDRAWN
10
$112,200
65
$141,749
105
$106,100
17
$40,449
4
$425,365
51
$121,970
0
$0
FILES CLOSED FOR INCOMPLETENESS
4
$91,995
48
$130,290
51
$123,915
0
$0
0
$0
40
$125,148
0
$0
Aggregated Statistics For Year 2006 (Based on 8 full and 2 partial tracts)
A) FHA, FSA/RHS & VA Home Purchase Loans
B) Conventional Home Purchase Loans
C) Refinancings
D) Home Improvement Loans
E) Loans on Dwellings For 5+ Families
F) Non-occupant Loans on < 5 Family Dwellings (A B C & D)
Number
Average Value
Number
Average Value
Number
Average Value
Number
Average Value
Number
Average Value
Number
Average Value
LOANS ORIGINATED
21
$115,160
539
$117,096
429
$118,359
44
$50,475
7
$106,679
400
$101,927
APPLICATIONS APPROVED, NOT ACCEPTED
2
$86,000
167
$136,902
115
$111,015
15
$94,508
0
$0
115
$110,305
APPLICATIONS DENIED
9
$112,253
507
$130,069
500
$124,614
123
$43,241
9
$95,089
336
$103,780
APPLICATIONS WITHDRAWN
5
$160,416
163
$128,965
137
$105,481
22
$102,607
0
$0
96
$97,356
FILES CLOSED FOR INCOMPLETENESS
4
$88,118
55
$103,712
53
$133,862
9
$171,376
2
$100,990
23
$90,572
Aggregated Statistics For Year 2005 (Based on 8 full and 2 partial tracts)
A) FHA, FSA/RHS & VA Home Purchase Loans
B) Conventional Home Purchase Loans
C) Refinancings
D) Home Improvement Loans
E) Loans on Dwellings For 5+ Families
F) Non-occupant Loans on < 5 Family Dwellings (A B C & D)
G) Loans On Manufactured Home Dwelling (A B C & D)
Number
Average Value
Number
Average Value
Number
Average Value
Number
Average Value
Number
Average Value
Number
Average Value
Number
Average Value
LOANS ORIGINATED
24
$150,371
556
$113,782
577
$106,123
60
$61,046
15
$239,245
457
$87,114
2
$90,885
APPLICATIONS APPROVED, NOT ACCEPTED
2
$152,940
159
$99,784
125
$101,589
22
$29,247
0
$0
98
$84,393
4
$18,100
APPLICATIONS DENIED
13
$113,414
406
$99,690
537
$99,075
89
$32,049
0
$0
370
$93,680
4
$69,815
APPLICATIONS WITHDRAWN
16
$123,624
194
$101,985
279
$106,451
30
$114,388
2
$679,730
175
$91,609
2
$67,995
FILES CLOSED FOR INCOMPLETENESS
2
$113,000
35
$98,555
82
$125,886
0
$0
0
$0
45
$111,228
0
$0
Aggregated Statistics For Year 2004 (Based on 8 full and 2 partial tracts)
A) FHA, FSA/RHS & VA Home Purchase Loans
B) Conventional Home Purchase Loans
C) Refinancings
D) Home Improvement Loans
E) Loans on Dwellings For 5+ Families
F) Non-occupant Loans on < 5 Family Dwellings (A B C & D)
G) Loans On Manufactured Home Dwelling (A B C & D)
Number
Average Value
Number
Average Value
Number
Average Value
Number
Average Value
Number
Average Value
Number
Average Value
Number
Average Value
LOANS ORIGINATED
27
$112,415
462
$107,491
613
$100,732
61
$61,400
28
$251,583
368
$79,124
2
$2,000
APPLICATIONS APPROVED, NOT ACCEPTED
8
$107,494
174
$87,739
194
$100,375
14
$46,715
2
$83,965
116
$80,563
0
$0
APPLICATIONS DENIED
18
$108,648
218
$102,616
585
$90,874
125
$48,367
6
$203,985
214
$82,854
2
$60,000
APPLICATIONS WITHDRAWN
12
$106,299
90
$95,030
237
$104,547
23
$39,026
5
$151,692
77
$86,961
0
$0
FILES CLOSED FOR INCOMPLETENESS
0
$0
32
$98,429
76
$88,569
4
$44,990
0
$0
23
$77,210
0
$0
Aggregated Statistics For Year 2003 (Based on 8 full and 2 partial tracts)
A) FHA, FSA/RHS & VA Home Purchase Loans
B) Conventional Home Purchase Loans
C) Refinancings
D) Home Improvement Loans
E) Loans on Dwellings For 5+ Families
F) Non-occupant Loans on < 5 Family Dwellings (A B C & D)
Number
Average Value
Number
Average Value
Number
Average Value
Number
Average Value
Number
Average Value
Number
Average Value
LOANS ORIGINATED
45
$131,780
336
$97,875
713
$104,257
41
$39,338
10
$1,096,441
339
$70,133
APPLICATIONS APPROVED, NOT ACCEPTED
6
$79,652
64
$65,770
239
$94,991
12
$17,702
6
$105,322
71
$73,567
APPLICATIONS DENIED
5
$125,008
138
$77,989
570
$91,471
43
$26,703
2
$150,985
187
$75,375
APPLICATIONS WITHDRAWN
11
$97,824
65
$108,521
201
$118,853
9
$27,496
0
$0
49
$80,916
FILES CLOSED FOR INCOMPLETENESS
4
$51,995
23
$116,722
84
$99,720
4
$43,650
0
$0
30
$74,988
Aggregated Statistics For Year 2002 (Based on 8 full and 2 partial tracts)
A) FHA, FSA/RHS & VA Home Purchase Loans
B) Conventional Home Purchase Loans
C) Refinancings
D) Home Improvement Loans
E) Loans on Dwellings For 5+ Families
F) Non-occupant Loans on < 5 Family Dwellings (A B C & D)
Number
Average Value
Number
Average Value
Number
Average Value
Number
Average Value
Number
Average Value
Number
Average Value
LOANS ORIGINATED
50
$101,060
264
$90,872
645
$107,382
36
$27,315
15
$367,049
275
$66,039
APPLICATIONS APPROVED, NOT ACCEPTED
2
$59,000
114
$92,616
200
$79,145
11
$34,492
0
$0
89
$61,781
APPLICATIONS DENIED
7
$126,740
154
$84,668
542
$74,748
79
$16,435
0
$0
119
$63,727
APPLICATIONS WITHDRAWN
4
$110,955
53
$93,247
221
$83,052
12
$44,162
0
$0
41
$71,122
FILES CLOSED FOR INCOMPLETENESS
2
$107,000
24
$80,975
78
$86,759
2
$65,000
0
$0
23
$63,373
Aggregated Statistics For Year 2001 (Based on 8 full and 2 partial tracts)
A) FHA, FSA/RHS & VA Home Purchase Loans
B) Conventional Home Purchase Loans
C) Refinancings
D) Home Improvement Loans
E) Loans on Dwellings For 5+ Families
F) Non-occupant Loans on < 5 Family Dwellings (A B C & D)
Number
Average Value
Number
Average Value
Number
Average Value
Number
Average Value
Number
Average Value
Number
Average Value
LOANS ORIGINATED
44
$108,091
264
$78,974
511
$87,460
49
$18,174
12
$159,200
215
$61,584
APPLICATIONS APPROVED, NOT ACCEPTED
7
$91,927
46
$69,959
152
$76,673
26
$39,067
2
$111,990
42
$59,470
APPLICATIONS DENIED
10
$83,013
169
$66,057
602
$75,141
118
$20,580
2
$84,990
142
$63,932
APPLICATIONS WITHDRAWN
12
$70,868
45
$73,047
210
$73,108
11
$29,609
0
$0
36
$66,863
FILES CLOSED FOR INCOMPLETENESS
0
$0
22
$56,729
62
$79,288
2
$14,995
0
$0
20
$55,910
Aggregated Statistics For Year 2000 (Based on 8 full and 2 partial tracts)
A) FHA, FSA/RHS & VA Home Purchase Loans
B) Conventional Home Purchase Loans
C) Refinancings
D) Home Improvement Loans
E) Loans on Dwellings For 5+ Families
F) Non-occupant Loans on < 5 Family Dwellings (A B C & D)
Number
Average Value
Number
Average Value
Number
Average Value
Number
Average Value
Number
Average Value
Number
Average Value
LOANS ORIGINATED
33
$78,728
315
$78,917
365
$71,794
100
$24,362
11
$104,829
221
$63,960
APPLICATIONS APPROVED, NOT ACCEPTED
9
$72,410
58
$57,515
162
$66,841
38
$19,191
0
$0
49
$61,102
APPLICATIONS DENIED
7
$67,431
258
$60,853
462
$60,457
154
$19,860
2
$430,830
178
$57,068
APPLICATIONS WITHDRAWN
11
$66,647
93
$87,254
203
$63,920
15
$43,477
2
$399,840
79
$58,891
FILES CLOSED FOR INCOMPLETENESS
0
$0
17
$63,235
54
$63,799
4
$15,278
0
$0
10
$49,594
Aggregated Statistics For Year 1999 (Based on 4 full and 1 partial tracts)
A) FHA, FSA/RHS & VA Home Purchase Loans
B) Conventional Home Purchase Loans
C) Refinancings
D) Home Improvement Loans
E) Loans on Dwellings For 5+ Families
F) Non-occupant Loans on < 5 Family Dwellings (A B C & D)
2002 - 2018 National Fire Incident Reporting System (NFIRS) incidents
Based on the data from the years 2002 - 2018 the average number of fires per year is 118. The highest number of fires - 257 took place in 2002, and the least - 77 in 2011. The data has a dropping trend.
When looking into fire subcategories, the most reports belonged to: Outside Fires (36.7%), and Structure Fires (27.9%).
Fire incident types reported to NFIRS in Zip Code 43205


 Nearest zip codes: 43203, 43206, 43209, 43201, 43215, 43211.


 Based on the data from the years 2002 - 2018 the average number of fires per year is 118. The highest number of fires - 257 took place in 2002, and the least - 77 in 2011. The data has a dropping trend.
 When looking into fire subcategories, the most reports belonged to: Outside Fires (36.7%), and Structure Fires (27.9%).