Estimated zip code population in 2022: 6,219 Zip code population in 2010: 6,651 Zip code population in 2000: 5,663
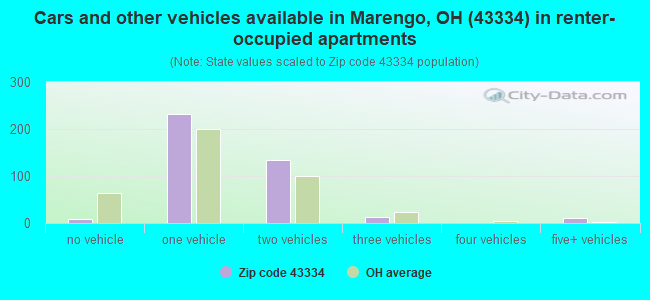
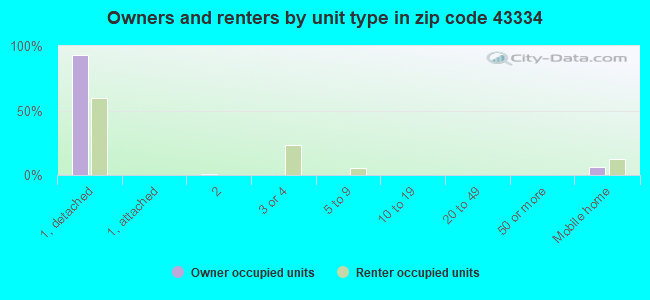
Houses and condos: 2,544 Renter-occupied apartments: 394
% of renters here:
16%
State:
33%
March 2022 cost of living index in zip code 43334: 83.9 (less than average, U.S. average is 100)
Land area: 66.0 sq. mi. Water area: 0.1 sq. mi.
Population density: 94 people per square mile
(very low).
OSM Map
General Map
Google Map
MSN Map
OSM Map
General Map
Google Map
MSN Map
OSM Map
General Map
Google Map
MSN Map
OSM Map
General Map
Google Map
MSN Map
Please wait while loading the map...
Real estate property taxes paid for housing units in 2022:
This zip code:
1.0% ($2,526)
Ohio:
1.3% ($2,639)
Median real estate property taxes paid for housing units with mortgages in 2022: $2,512 (0.9%) Median real estate property taxes paid for housing units with no mortgage in 2022: $2,574 (1.1%)
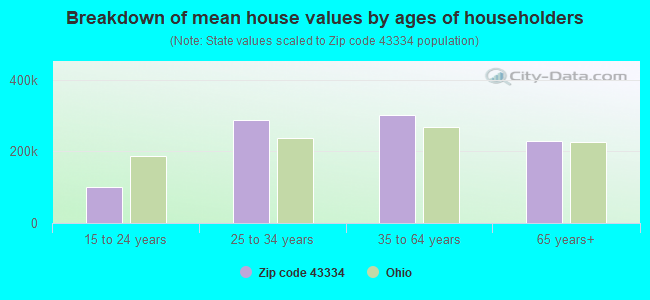
Estimated median house/condo value in 2022: $264,005
43334:
$264,005
Ohio:
$204,100
According to our research of Ohio and other state lists, there were 12 registered sex offenders living in 43334 zip code as of April 27, 2024. The ratio of all residents to sex offenders in zip code 43334 is 585 to 1. The ratio of registered sex offenders to all residents in this zip code is near the state average.
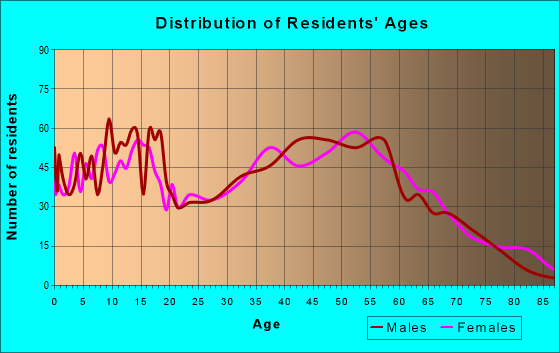
Median resident age:
This zip code:
42.5 years
Ohio median age:
39.9 years
Average household size:
This zip code:
2.5 people
Ohio:
2.4 people
Averages for the 2020 tax year for zip code 43334, filed in 2021:
Average Adjusted Gross Income (AGI) in 2020: $60,099 (Individual Income Tax Returns)
Here:
$60,099
State:
$67,288
Salary/wage: $54,451 (reported on 84.0% of returns)
Here:
$54,451
State:
$55,628
(% of AGI for various income ranges: 1173.5% for AGIs below $25k, 3599.0% for AGIs $25k-50k, 6403.4% for AGIs $50k-75k, 9538.8% for AGIs $75k-100k, 16675.0% for AGIs $100k-200k, 48476.7% for AGIs over 200k)
Taxable interest for individuals: $650 (reported on 19.4% of returns)
This zip code:
$650
Ohio:
$1,518
(% of AGI for various income ranges: 7.2% for AGIs below $25k, 10.5% for AGIs $25k-50k, 21.6% for AGIs $50k-75k, 17.1% for AGIs $75k-100k, 38.0% for AGIs $100k-200k, 130.0% for AGIs over 200k)
Ordinary dividends: $2,324 (reported on 14.4% of returns)
Here:
$2,324
State:
$7,167
(% of AGI for various income ranges: 11.6% for AGIs below $25k, 15.0% for AGIs $25k-50k, 50.7% for AGIs $50k-75k, 85.8% for AGIs $75k-100k, 137.7% for AGIs $100k-200k, 183.3% for AGIs over 200k)
Net capital gain/loss in AGI: +$7,560 (reported on 13.5% of returns)
Here:
+$7,560
State:
+$18,919
(% of AGI for various income ranges: 0.4% for AGIs below $25k, 17.1% for AGIs $25k-50k, 73.6% for AGIs $50k-75k, 80.0% for AGIs $75k-100k, 598.7% for AGIs $100k-200k, 2766.7% for AGIs over 200k)
Profit/loss from business: +$14,378 (reported on 18.5% of returns)
Here:
+$14,378
State:
+$13,744
(% of AGI for various income ranges: 189.6% for AGIs below $25k, 199.4% for AGIs $25k-50k, 245.5% for AGIs $50k-75k, 547.9% for AGIs $75k-100k, 1187.7% for AGIs $100k-200k)
Taxable individual retirement arrangement distribution: $14,692 (reported on 7.8% of returns)
43334:
$14,692
Ohio:
$18,876
(% of AGI for various income ranges: 48.2% for AGIs below $25k, 84.7% for AGIs $25k-50k, 107.5% for AGIs $50k-75k, 309.2% for AGIs $75k-100k, 535.0% for AGIs $100k-200k)
Total itemized deductions: $29,181 (reported on 5.0% of returns)
Here:
$29,181
State:
$33,869
(% of AGI for various income ranges: 129.5% for AGIs $25k-50k, 148.2% for AGIs $50k-75k, 227.1% for AGIs $75k-100k, 889.7% for AGIs $100k-200k)
Charity contributions: $7,936 (reported on 3.4% of returns)
Here:
$7,936
State:
$14,577
(% of AGI for various income ranges: 43.9% for AGIs $50k-75k, 226.7% for AGIs $100k-200k)
Taxes paid: $7,006 (reported on 5.0% of returns)
43334:
$7,006
State:
$7,681
(% of AGI for various income ranges: 18.2% for AGIs $25k-50k, 41.4% for AGIs $50k-75k, 72.5% for AGIs $75k-100k, 217.3% for AGIs $100k-200k)
Earned income credit: $2,170 (reported on 13.8% of returns)
Here:
$2,170
State:
$2,304
(% of AGI for various income ranges: 84.1% for AGIs below $25k, 61.8% for AGIs $25k-50k)
Percentage of individuals using paid preparers for their 2020 taxes: 94.7%
Here:
95%
State:
94%
(% for various income ranges: 92.4% for AGIs below $25k, 94.9% for AGIs $25k-50k, 96.6% for AGIs $50k-75k, 97.0% for AGIs $75k-100k, 93.9% for AGIs $100k-200k, 100.0% for AGIs over 200k)
Averages for the 2012 tax year for zip code 43334, filed in 2013:
Average Adjusted Gross Income (AGI) in 2012: $46,801 (Individual Income Tax Returns)
Here:
$46,801
State:
$54,926
Salary/wage: $41,992 (reported on 85.3% of returns)
Here:
$41,992
State:
$45,869
(% of AGI for various income ranges: 70.7% for AGIs below $25k, 82.9% for AGIs $25k-50k, 79.3% for AGIs $50k-75k, 84.9% for AGIs $75k-100k, 76.8% for AGIs $100k-200k, 41.0% for AGIs over 200k)
Taxable interest for individuals: $722 (reported on 23.4% of returns)
This zip code:
$722
Ohio:
$1,297
(% of AGI for various income ranges: 0.7% for AGIs below $25k, 0.2% for AGIs $25k-50k, 0.5% for AGIs $50k-75k, 0.3% for AGIs $75k-100k, 0.4% for AGIs $100k-200k)
Ordinary dividends: $1,654 (reported on 13.6% of returns)
Here:
$1,654
State:
$5,821
(% of AGI for various income ranges: 0.6% for AGIs below $25k, 0.2% for AGIs $25k-50k, 0.4% for AGIs $50k-75k, 0.5% for AGIs $75k-100k, 1.1% for AGIs $100k-200k)
Net capital gain/loss in AGI: +$4,577 (reported on 9.1% of returns)
Here:
+$4,577
State:
+$11,232
(% of AGI for various income ranges: 0.6% for AGIs below $25k, 0.3% for AGIs $50k-75k, 0.8% for AGIs $75k-100k, 3.0% for AGIs $100k-200k)
Profit/loss from business: +$9,919 (reported on 19.9% of returns)
Here:
+$9,919
State:
+$12,773
(% of AGI for various income ranges: 12.4% for AGIs below $25k, 2.9% for AGIs $25k-50k, 3.9% for AGIs $50k-75k, 2.2% for AGIs $75k-100k, 5.4% for AGIs $100k-200k)
Taxable individual retirement arrangement distribution: $11,541 (reported on 7.7% of returns)
43334:
$11,541
Ohio:
$14,511
(% of AGI for various income ranges: 2.7% for AGIs below $25k, 1.3% for AGIs $25k-50k, 1.8% for AGIs $50k-75k, 1.3% for AGIs $75k-100k, 3.5% for AGIs $100k-200k)
Total itemized deductions: $18,311 (23% of AGI, reported on 30.4% of returns)
Here:
$18,311
State:
$21,278
Here:
22.7% of AGI
State:
18.8% of AGI
(% of AGI for various income ranges: 7.3% for AGIs below $25k, 8.8% for AGIs $25k-50k, 12.5% for AGIs $50k-75k, 13.8% for AGIs $75k-100k, 14.3% for AGIs $100k-200k, 14.6% for AGIs over 200k)
Charity contributions: $2,570 (reported on 21.0% of returns)
Here:
$2,570
State:
$3,943
(% of AGI for various income ranges: 0.4% for AGIs below $25k, 0.7% for AGIs $25k-50k, 1.3% for AGIs $50k-75k, 1.3% for AGIs $75k-100k, 1.6% for AGIs $100k-200k, 1.7% for AGIs over 200k)
Taxes paid: $6,244 (reported on 30.4% of returns)
43334:
$6,244
State:
$9,568
(% of AGI for various income ranges: 1.3% for AGIs below $25k, 2.1% for AGIs $25k-50k, 4.0% for AGIs $50k-75k, 5.1% for AGIs $75k-100k, 6.4% for AGIs $100k-200k, 4.7% for AGIs over 200k)
Earned income credit: $2,292 (reported on 18.5% of returns)
Here:
$2,292
State:
$2,285
(% of AGI for various income ranges: 6.9% for AGIs below $25k, 1.0% for AGIs $25k-50k)
Percentage of individuals using paid preparers for their 2012 taxes: 51.4%
Here:
51%
State:
51%
(% for various income ranges: 46.7% for AGIs below $25k, 51.9% for AGIs $25k-50k, 56.5% for AGIs $50k-75k, 55.6% for AGIs $75k-100k, 63.6% for AGIs $100k-200k, 0.0% for AGIs over 200k)
Averages for the 2004 tax year for zip code 43334, filed in 2005:
Average Adjusted Gross Income (AGI) in 2004: $39,783 (Individual Income Tax Returns)
Here:
$39,783
State:
$44,480
Salary/wage: $36,187 (reported on 88.4% of returns)
Here:
$36,187
State:
$39,198
(% of AGI for various income ranges: 117.7% for AGIs below $10k, 78.5% for AGIs $10k-25k, 87.1% for AGIs $25k-50k, 86.7% for AGIs $50k-75k, 88.8% for AGIs $75k-100k, 53.7% for AGIs over 100k)
Taxable interest for individuals: $719 (reported on 34.2% of returns)
This zip code:
$719
Ohio:
$1,532
(% of AGI for various income ranges: 5.3% for AGIs below $10k, 1.1% for AGIs $10k-25k, 0.7% for AGIs $25k-50k, 0.4% for AGIs $50k-75k, 0.4% for AGIs $75k-100k, 0.2% for AGIs over 100k)
Taxable dividends: $709 (reported on 15.2% of returns)
Here:
$709
State:
$3,496
(% of AGI for various income ranges: 1.3% for AGIs below $10k, 0.5% for AGIs $10k-25k, 0.3% for AGIs $25k-50k, 0.3% for AGIs $50k-75k, 0.2% for AGIs $75k-100k, 0.2% for AGIs over 100k)
Net capital gain/loss: +$4,598 (reported on 11.4% of returns)
Here:
+$4,598
State:
+$8,582
(% of AGI for various income ranges: -1.2% for AGIs below $10k, 0.1% for AGIs $10k-25k, 0.6% for AGIs $25k-50k, 0.9% for AGIs $50k-75k, 1.2% for AGIs $75k-100k, 3.9% for AGIs over 100k)
Profit/loss from business: +$6,450 (reported on 17.3% of returns)
Here:
+$6,450
State:
+$10,813
(% of AGI for various income ranges: -6.1% for AGIs below $10k, 5.7% for AGIs $10k-25k, 2.7% for AGIs $25k-50k, 2.3% for AGIs $50k-75k, 2.3% for AGIs $75k-100k, 3.2% for AGIs over 100k)
IRA payment deduction: $2,435 (reported on 1.6% of returns)
43334:
$2,435
Ohio:
$2,794
Total itemized deductions: $14,984 (22% of AGI, reported on 34.9% of returns)
Here:
$14,984
State:
$17,503
Here:
22.3% of AGI
State:
20.8% of AGI
(% of AGI for various income ranges: 12.0% for AGIs below $10k, 8.7% for AGIs $10k-25k, 11.3% for AGIs $25k-50k, 14.8% for AGIs $50k-75k, 18.0% for AGIs $75k-100k, 12.5% for AGIs over 100k)
Charity contributions deductions: $1,947 (3% of AGI, reported on 25.6% of returns)
Here:
$1,947
State:
$3,087
Here:
2.6% of AGI
State:
3.4% of AGI
(% of AGI for various income ranges: 0.5% for AGIs below $10k, 0.6% for AGIs $10k-25k, 0.9% for AGIs $25k-50k, 1.4% for AGIs $50k-75k, 1.8% for AGIs $75k-100k, 1.5% for AGIs over 100k)
Total tax: $4,803 (reported on 78.1% of returns)
43334:
$4,803
State:
$6,781
(% of AGI for various income ranges: 4.5% for AGIs below $10k, 4.7% for AGIs $10k-25k, 7.0% for AGIs $25k-50k, 8.5% for AGIs $50k-75k, 10.4% for AGIs $75k-100k, 16.3% for AGIs over 100k)
Earned income credit: $1,659 (reported on 13.8% of returns)
Here:
$1,659
State:
$1,696
Percentage of individuals using paid preparers for their 2004 taxes: 52.2%
Here:
52%
State:
55%
(% for various income ranges: 43.2% for AGIs below $10k, 48.5% for AGIs $10k-25k, 58.5% for AGIs $25k-50k, 57.5% for AGIs $50k-75k, 45.8% for AGIs $75k-100k, 53.2% for AGIs over 100k)
Household received Food Stamps/SNAP in the past 12 months: 176 Household did not receive Food Stamps/SNAP in the past 12 months: 2,293
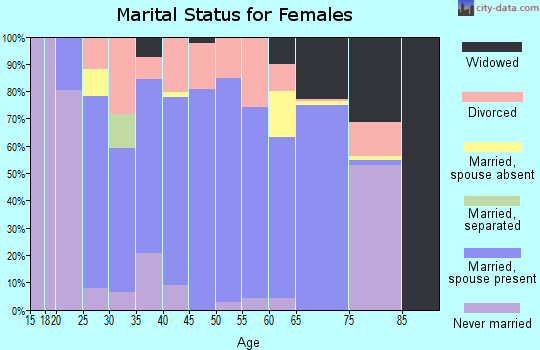
Women who had a birth in the past 12 months: 59 (36 now married, 22 unmarried) Women who did not have a birth in the past 12 months: 1,185 (721 now married, 463 unmarried)
Housing units in zip code 43334 with a mortgage: 1,459 (246 second mortgage, 211 both second mortgage and home equity loan) Houses without a mortgage: 54
Median monthly owner costs for units with a mortgage: $1,609 Median monthly owner costs for units without a mortgage: $537
Residents with income below the poverty level in 2022:
This zip code:
8.2%
Whole state:
13.4%
Residents with income below 50% of the poverty level in 2022:
This zip code:
3.5%
Whole state:
7.0%
Median number of rooms in houses and condos:
Here:
6.6
State:
6.7
Median number of rooms in apartments:
Here:
5.7
State:
4.4
Notable locations in this zip code not listed on our city pages
Notable locations in zip code 43334: Mead Corners (A), Tim Corners (B), Moore Corners (C), Bowen Corners (D), Walnut Creek Farms (E), Morrow County Emergency Medical Services (F), Big Walnut Joint Fire Department (G), Ach Nursery (H). Display/hide their locations on the map
Churches in zip code 43334 include: Little Ruth Church (A), Alum Creek Church (B), Marengo United Methodist Church (C), Fargo Wesleyan Church (D). Display/hide their locations on the map
Cemeteries: Biggs Cemetery (1), Stantontown Cemetery (2), Kenney Cemetery (3), Ebenezer Cemetery (4), Marengo Cemetery (5), Morehouse Cemetery (6), Pagetown Cemetery (7). Display/hide their locations on the map
Streams, rivers, and creeks: Mill Creek (A), Light Creek (B), Castro Run (C), Bunker Run (D), Indigo Creek (E), Reynolds Run (F). Display/hide their locations on the map
1,047 married couples with children.
241 single-parent households (78 men, 163 women).
99.0% of residents of 43334 zip code speak English at home.
0.1% of residents speak Spanish at home (40% well, 60% not well).
0.6% of residents speak other Indo-European language at home (9% very well, 91% not well).
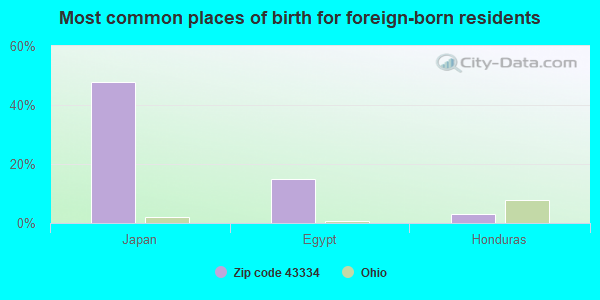
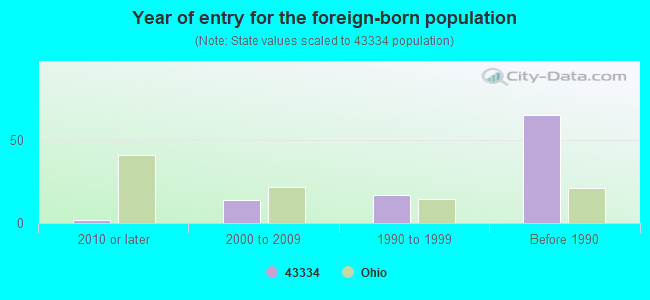
Foreign born population: 67 (1.1%) (45.9% of them are naturalized citizens)
This zip code:
1.1%
Whole state:
5.0%
48%Japan
15%Egypt
3%Honduras
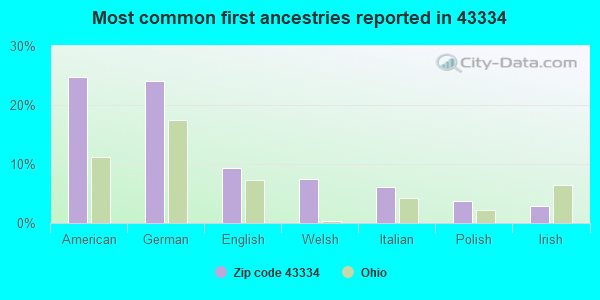
25%American
24%German
9%English
7%Welsh
6%Italian
4%Polish
3%Irish
Year of entry for the foreign-born population
22010 or later
142000 to 2009
171990 to 1999
65Before 1990
Facilities with environmental interests located in this zip code:
BLAZING Z INDUSTRIES (2600 ST RTE 61 in MARENGO, OH)
STATE MASTER (Ohio general info) - RCRA-OHD987017993, HAZARDOUS WASTE PROGRAM Conditionally Exempt Small Quantity Generators, less than 100 kg/month of hazardous waste (Resource Conservation and Recovery Act (tracking hazardous waste)) - notification Organizations: ZVANSKY ROBERT J (CONTACT/OWNER)
ALLTEL - MARENGO (1850 COUNTY RD 26 in MARENGO, OH)
(Integrated Compliance Information System) - ICIS-HQ-2000-6004, FORMAL ENFORCEMENT ACTION
Housing units lacking complete plumbing facilities: 2.7% Housing units lacking complete kitchen facilities: 1.6%
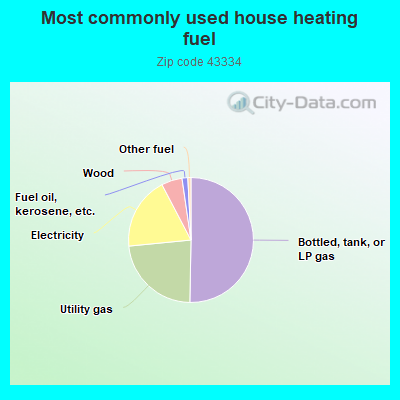
50.4%Bottled, tank, or LP gas
23.2%Utility gas
18.9%Electricity
5.4%Wood
1.5%Fuel oil, kerosene, etc.
0.8%Other fuel
Population in 1990: 3,338. Population change in the 1990s: +2,325 (+69.7%).
Place of birth for U.S.-born residents:
This state: 4,938
Northeast: 266
Midwest: 368
South: 467
West: 58
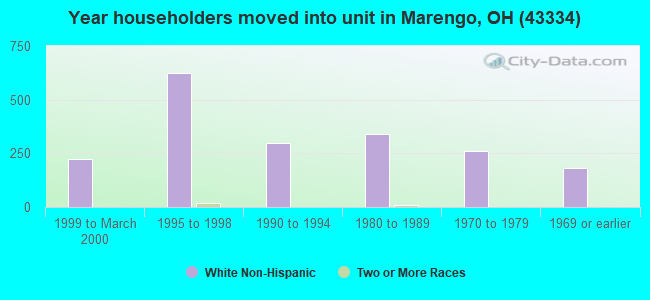
55% of the 43334 zip code residents lived in the same house 5 years ago. Out of people who lived in different houses, 37% lived in this county. Out of people who lived in different counties, 50% lived in Ohio.
96% of the 43334 zip code residents lived in the same house 1 year ago. Out of people who lived in different houses, 37% moved from this county. Out of people who lived in different houses, 54% moved from different county within same state. Out of people who lived in different houses, 25% moved from different state.
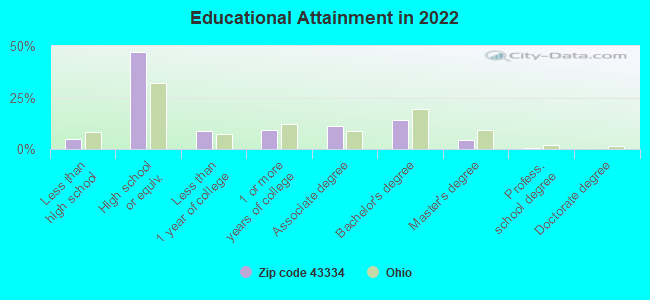
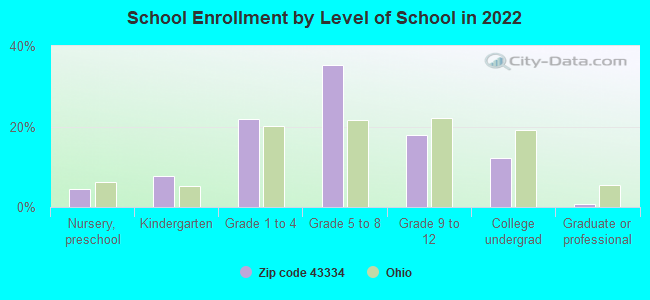
Private vs. public school enrollment:
Students in private schools in grades 1 to 8 (elementary and middle school): 50
Here:
6.3%
Ohio:
16.0%
Students in private schools in grades 9 to 12 (high school): 2
Here:
0.8%
Ohio:
13.1%
Students in private undergraduate colleges: 46
Here:
27.0%
Ohio:
22.3%
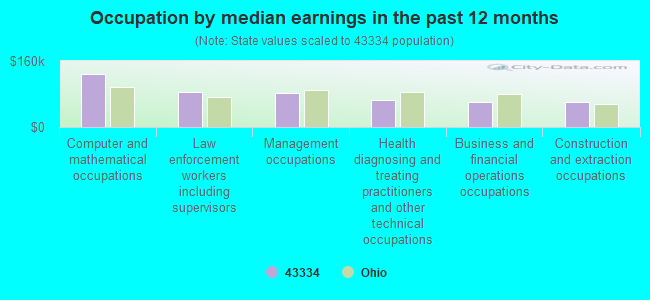
Occupation by median earnings in the past 12 months ($)
127,388Computer and mathematical occupations
83,741Law enforcement workers including supervisors
83,115Management occupations
64,943Health diagnosing and treating practitioners and other technical occupations
61,268Business and financial operations occupations
59,668Construction and extraction occupations
Top industries in this zip code by the number of employees in 2005:
Health Care and Social Assistance: Nursing Care Facilities (100-249 employees: 1 establishment)
Administrative and Support and Waste Management and Remediation Services: Landscaping Services (20-49: 1, 1-4: 3)
Administrative and Support and Waste Management and Remediation Services: Professional Employer Organizations (20-49: 1, 1-4: 1)
Construction: Land Subdivision (20-49: 1)
Construction: Site Preparation Contractors (10-19: 1, 1-4: 2)
Other Services (except Public Administration): Religious Organizations (10-19: 1, 1-4: 2)
People in group quarters in 2010:
74 people in nursing facilities/skilled-nursing facilities
3 people in group homes intended for adults
People in group quarters in 2000:
15 people in nursing homes
4 people in homes for the mentally retarded
Fatal accident statistics in 2013:
Fatal accident count: 6
Vehicles involved in fatal accidents: 6
Fatal accidents caused by drunken drivers: 1
Fatalities: 6
Persons involved in fatal accidents: 14
Pedestrians involved in fatal accidents: 2
Fatal accident statistics in 2012:
Fatal accident count: 3
Vehicles involved in fatal accidents: 4
Fatal accidents caused by drunken drivers: 3
Fatalities: 3
Persons involved in fatal accidents: 4
Pedestrians involved in fatal accidents: 0
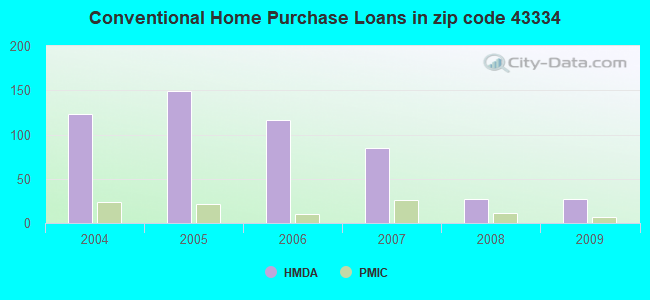
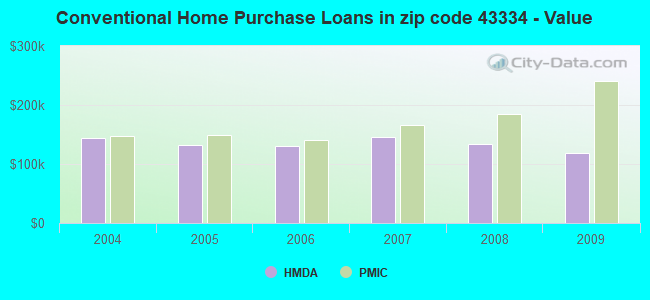
Home Mortgage Disclosure Act Aggregated Statistics For Year 2009 (Based on 2 partial tracts)
A) FHA, FSA/RHS & VA Home Purchase Loans
B) Conventional Home Purchase Loans
C) Refinancings
D) Home Improvement Loans
E) Loans on Dwellings For 5+ Families
F) Non-occupant Loans on < 5 Family Dwellings (A B C & D)
G) Loans On Manufactured Home Dwelling (A B C & D)
Number
Average Value
Number
Average Value
Number
Average Value
Number
Average Value
Number
Average Value
Number
Average Value
Number
Average Value
LOANS ORIGINATED
28
$113,870
27
$117,858
201
$156,974
9
$54,756
1
$116,390
12
$183,667
35
$88,301
APPLICATIONS APPROVED, NOT ACCEPTED
2
$105,865
5
$121,592
15
$121,839
0
$0
0
$0
0
$0
1
$127,530
APPLICATIONS DENIED
7
$102,417
10
$76,397
87
$153,523
10
$52,747
0
$0
5
$81,968
15
$70,412
APPLICATIONS WITHDRAWN
6
$95,960
1
$69,340
35
$141,190
6
$81,928
0
$0
1
$69,340
5
$86,674
FILES CLOSED FOR INCOMPLETENESS
0
$0
1
$229,070
9
$136,890
0
$0
0
$0
0
$0
1
$101,530
Aggregated Statistics For Year 2008 (Based on 2 partial tracts)
A) FHA, FSA/RHS & VA Home Purchase Loans
B) Conventional Home Purchase Loans
C) Refinancings
D) Home Improvement Loans
E) Loans on Dwellings For 5+ Families
F) Non-occupant Loans on < 5 Family Dwellings (A B C & D)
G) Loans On Manufactured Home Dwelling (A B C & D)
Number
Average Value
Number
Average Value
Number
Average Value
Number
Average Value
Number
Average Value
Number
Average Value
Number
Average Value
LOANS ORIGINATED
27
$163,442
27
$134,597
114
$139,938
24
$30,491
1
$152,300
20
$110,200
20
$89,584
APPLICATIONS APPROVED, NOT ACCEPTED
2
$167,155
6
$215,860
28
$125,235
4
$14,858
0
$0
4
$86,982
5
$62,158
APPLICATIONS DENIED
16
$198,344
21
$194,398
132
$132,187
22
$27,071
0
$0
7
$110,554
24
$86,365
APPLICATIONS WITHDRAWN
7
$122,404
1
$134,960
38
$153,667
1
$22,290
0
$0
0
$0
7
$120,813
FILES CLOSED FOR INCOMPLETENESS
0
$0
0
$0
6
$151,060
0
$0
0
$0
0
$0
0
$0
Aggregated Statistics For Year 2007 (Based on 2 partial tracts)
A) FHA, FSA/RHS & VA Home Purchase Loans
B) Conventional Home Purchase Loans
C) Refinancings
D) Home Improvement Loans
F) Non-occupant Loans on < 5 Family Dwellings (A B C & D)
G) Loans On Manufactured Home Dwelling (A B C & D)
Number
Average Value
Number
Average Value
Number
Average Value
Number
Average Value
Number
Average Value
Number
Average Value
LOANS ORIGINATED
20
$142,888
85
$146,370
136
$135,556
38
$77,094
26
$154,442
30
$96,827
APPLICATIONS APPROVED, NOT ACCEPTED
1
$206,780
19
$109,678
37
$131,684
14
$53,331
5
$137,192
12
$85,952
APPLICATIONS DENIED
2
$191,300
21
$90,153
168
$132,885
36
$54,962
17
$125,204
17
$86,018
APPLICATIONS WITHDRAWN
1
$142,390
15
$91,462
54
$146,062
7
$69,870
2
$121,965
6
$100,913
FILES CLOSED FOR INCOMPLETENESS
0
$0
4
$107,415
12
$216,272
0
$0
0
$0
1
$200,590
Aggregated Statistics For Year 2006 (Based on 2 partial tracts)
A) FHA, FSA/RHS & VA Home Purchase Loans
B) Conventional Home Purchase Loans
C) Refinancings
D) Home Improvement Loans
F) Non-occupant Loans on < 5 Family Dwellings (A B C & D)
G) Loans On Manufactured Home Dwelling (A B C & D)
Number
Average Value
Number
Average Value
Number
Average Value
Number
Average Value
Number
Average Value
Number
Average Value
LOANS ORIGINATED
24
$142,858
116
$130,587
208
$131,696
46
$43,202
19
$125,645
45
$105,852
APPLICATIONS APPROVED, NOT ACCEPTED
2
$142,395
24
$112,160
35
$123,961
7
$25,117
4
$114,225
10
$85,931
APPLICATIONS DENIED
9
$120,243
37
$116,458
194
$124,011
41
$33,431
7
$229,244
45
$76,356
APPLICATIONS WITHDRAWN
1
$235,260
7
$124,350
82
$146,017
4
$22,288
4
$291,288
4
$83,578
FILES CLOSED FOR INCOMPLETENESS
0
$0
5
$163,194
37
$139,615
0
$0
0
$0
0
$0
Aggregated Statistics For Year 2005 (Based on 2 partial tracts)
A) FHA, FSA/RHS & VA Home Purchase Loans
B) Conventional Home Purchase Loans
C) Refinancings
D) Home Improvement Loans
F) Non-occupant Loans on < 5 Family Dwellings (A B C & D)
G) Loans On Manufactured Home Dwelling (A B C & D)
Number
Average Value
Number
Average Value
Number
Average Value
Number
Average Value
Number
Average Value
Number
Average Value
LOANS ORIGINATED
21
$142,039
149
$132,978
236
$126,470
48
$49,709
35
$133,832
36
$95,135
APPLICATIONS APPROVED, NOT ACCEPTED
5
$139,916
19
$82,764
48
$126,554
6
$51,385
5
$83,454
10
$94,103
APPLICATIONS DENIED
2
$113,915
47
$100,768
217
$118,833
47
$49,739
5
$98,066
47
$78,454
APPLICATIONS WITHDRAWN
1
$138,680
26
$121,058
137
$125,456
17
$138,169
2
$204,305
14
$105,336
FILES CLOSED FOR INCOMPLETENESS
1
$274,880
5
$140,660
20
$137,750
2
$24,145
1
$43,340
0
$0
Aggregated Statistics For Year 2004 (Based on 2 partial tracts)
A) FHA, FSA/RHS & VA Home Purchase Loans
B) Conventional Home Purchase Loans
C) Refinancings
D) Home Improvement Loans
F) Non-occupant Loans on < 5 Family Dwellings (A B C & D)
G) Loans On Manufactured Home Dwelling (A B C & D)
Detailed PMIC statistics for the following Tracts:9855.00
2002 - 2018 National Fire Incident Reporting System (NFIRS) incidents
According to the data from the years 2002 - 2018 the average number of fire incidents per year is 47. The highest number of fire incidents - 76 took place in 2009, and the least - 30 in 2006. The data has a growing trend.
When looking into fire subcategories, the most reports belonged to: Structure Fires (50.3%), and Outside Fires (28.9%).
Fire incident types reported to NFIRS in Zip Code 43334
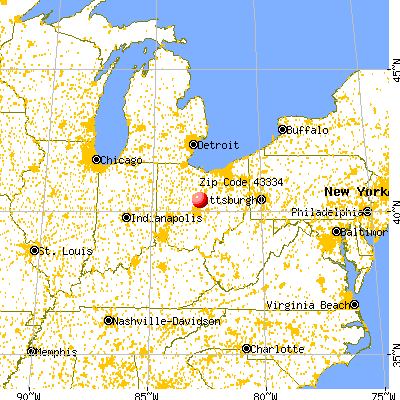


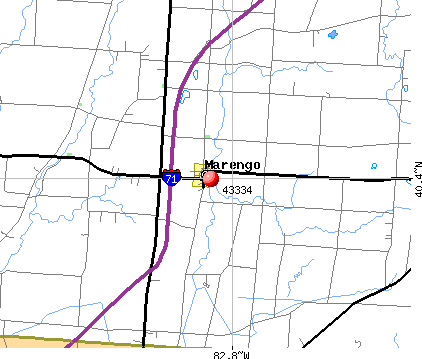 Nearest zip codes: 43321, 43315, 43317, 43074, 43011, 43338.


 According to the data from the years 2002 - 2018 the average number of fire incidents per year is 47. The highest number of fire incidents - 76 took place in 2009, and the least - 30 in 2006. The data has a growing trend.
 When looking into fire subcategories, the most reports belonged to: Structure Fires (50.3%), and Outside Fires (28.9%).