Estimated zip code population in 2022: 2,895 Zip code population in 2010: 2,891 Zip code population in 2000: 2,930
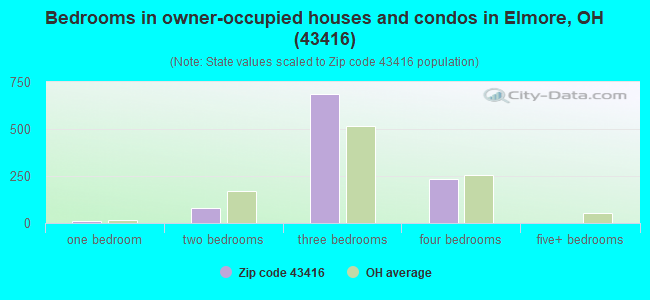
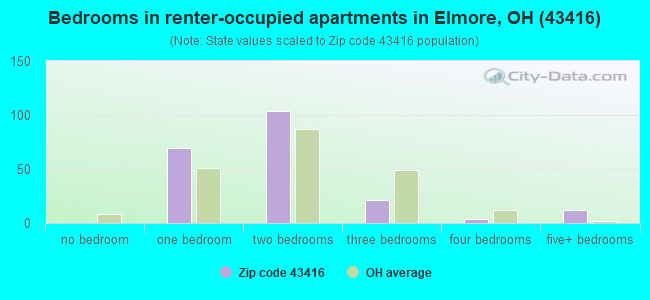
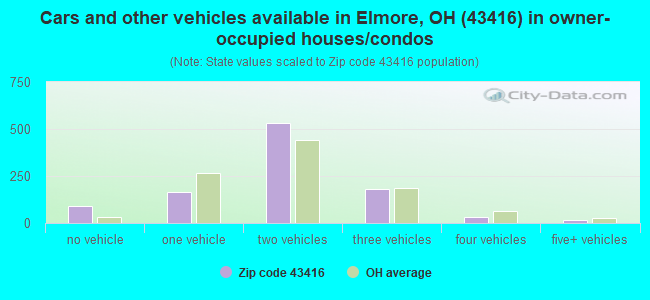
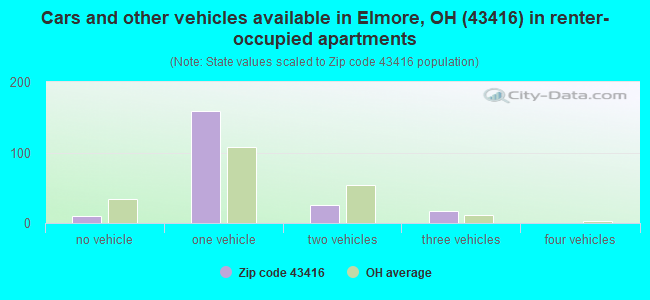
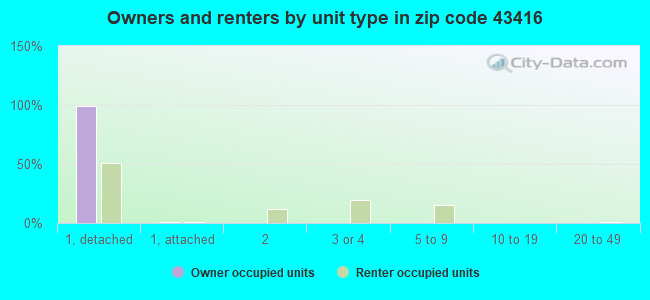
Houses and condos: 1,294 Renter-occupied apartments: 208
% of renters here:
17%
State:
33%
March 2022 cost of living index in zip code 43416: 81.9 (low, U.S. average is 100)
Land area: 27.5 sq. mi. Water area: 0.1 sq. mi.
Population density: 105 people per square mile
(very low).
OSM Map
General Map
Google Map
MSN Map
OSM Map
General Map
Google Map
MSN Map
OSM Map
General Map
Google Map
MSN Map
OSM Map
General Map
Google Map
MSN Map
Please wait while loading the map...
Real estate property taxes paid for housing units in 2022:
This zip code:
1.3% ($2,378)
Ohio:
1.3% ($2,639)
Median real estate property taxes paid for housing units with mortgages in 2022: $2,461 (1.3%) Median real estate property taxes paid for housing units with no mortgage in 2022: $2,190 (1.3%)
Business Search- 14 Million verified businesses
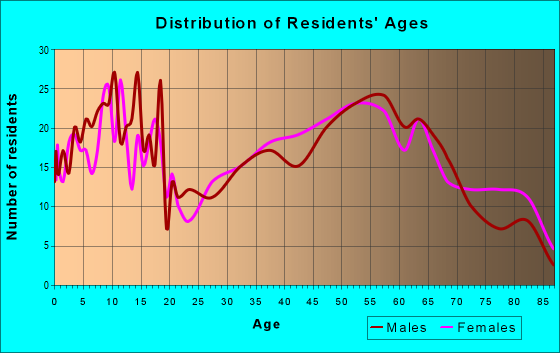
Males: 1,426
(49.3%)
Females: 1,468
(50.7%)
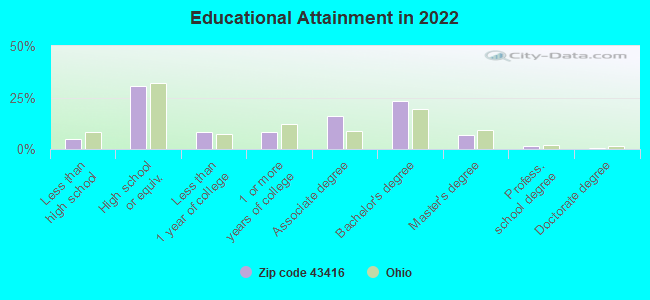
For population 25 years and over in 43416:
High school or higher: 95.7%
Bachelor's degree or higher: 32.2%
Graduate or professional degree: 8.7%
Unemployed: 0.3%
Mean travel time to work (commute): 24.6 minutes
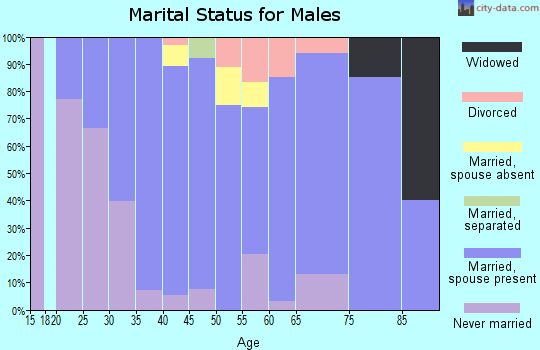
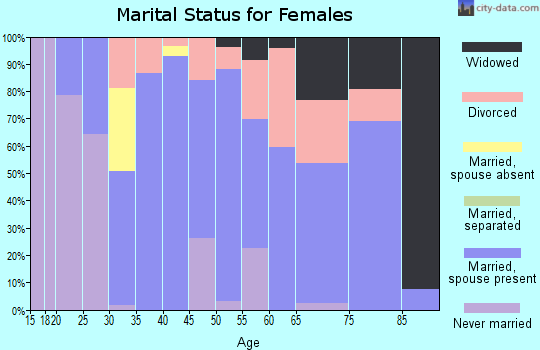
For population 15 years and over in 43416:
Never married: 16.6%
Now married: 67.0%
Separated: 1.3%
Widowed: 4.4%
Divorced: 10.7%
Zip code 43416 compared to state average:
Unemployed percentage significantly below state average.
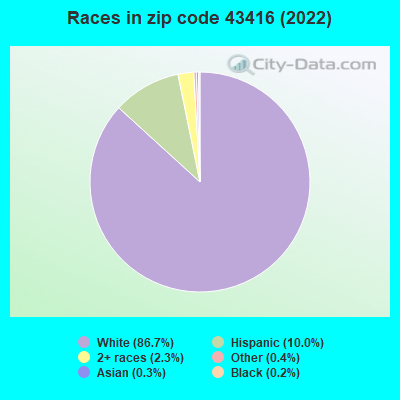
Black race population percentage significantly below state average.
Hispanic race population percentage above state average.
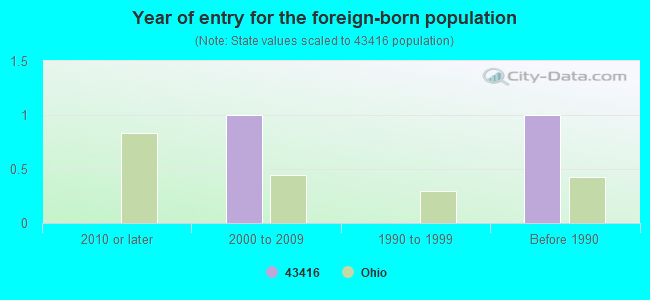
Foreign-born population percentage significantly below state average.
Renting percentage below state average.
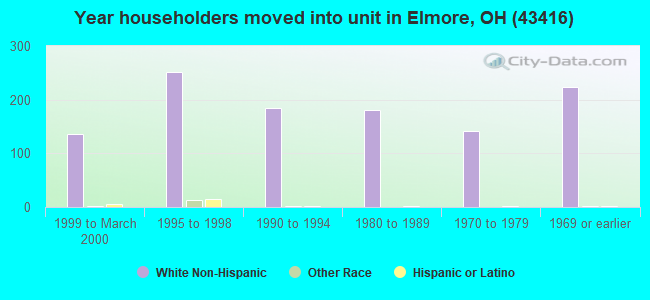
Length of stay since moving in significantly above state average.
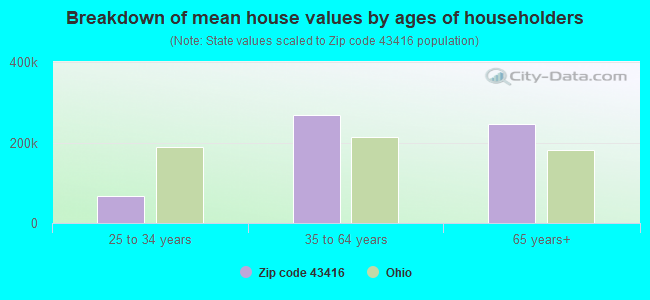
Estimated median house/condo value in 2022: $180,383
43416:
$180,383
Ohio:
$204,100
According to our research of Ohio and other state lists, there was 1 registered sex offender living in 43416 zip code as of April 26, 2024. The ratio of all residents to sex offenders in zip code 43416 is 2,951 to 1. The ratio of registered sex offenders to all residents in this zip code is much lower than the state average.
Median resident age:
This zip code:
42.1 years
Ohio median age:
39.9 years
Average household size:
This zip code:
2.3 people
Ohio:
2.4 people
Averages for the 2020 tax year for zip code 43416, filed in 2021:
Average Adjusted Gross Income (AGI) in 2020: $63,947 (Individual Income Tax Returns)
Here:
$63,947
State:
$67,288
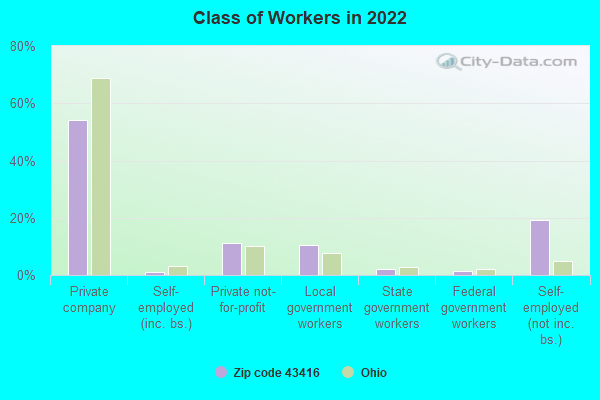
Salary/wage: $55,146 (reported on 79.7% of returns)
Here:
$55,146
State:
$55,628
(% of AGI for various income ranges: 1163.8% for AGIs below $25k, 3304.2% for AGIs $25k-50k, 6024.4% for AGIs $50k-75k, 10089.2% for AGIs $75k-100k, 13557.1% for AGIs $100k-200k)
Taxable interest for individuals: $970 (reported on 30.1% of returns)
This zip code:
$970
Ohio:
$1,518
(% of AGI for various income ranges: 20.4% for AGIs below $25k, 42.9% for AGIs $25k-50k, 19.4% for AGIs $50k-75k, 105.0% for AGIs $75k-100k, 35.9% for AGIs $100k-200k)
Ordinary dividends: $2,662 (reported on 22.4% of returns)
Here:
$2,662
State:
$7,167
(% of AGI for various income ranges: 31.5% for AGIs below $25k, 60.0% for AGIs $25k-50k, 77.8% for AGIs $50k-75k, 160.0% for AGIs $75k-100k, 172.9% for AGIs $100k-200k)
Net capital gain/loss in AGI: +$6,467 (reported on 18.9% of returns)
Here:
+$6,467
State:
+$18,919
(% of AGI for various income ranges: 31.7% for AGIs $25k-50k, 77.8% for AGIs $50k-75k, 199.2% for AGIs $75k-100k, 204.1% for AGIs $100k-200k)
Profit/loss from business: +$8,811 (reported on 12.6% of returns)
Here:
+$8,811
State:
+$13,744
(% of AGI for various income ranges: 82.3% for AGIs below $25k, 75.4% for AGIs $25k-50k, 111.1% for AGIs $50k-75k, 165.8% for AGIs $75k-100k, 465.9% for AGIs $100k-200k)
Taxable individual retirement arrangement distribution: $17,763 (reported on 13.3% of returns)
43416:
$17,763
Ohio:
$18,876
(% of AGI for various income ranges: 84.2% for AGIs below $25k, 214.6% for AGIs $25k-50k, 303.9% for AGIs $50k-75k, 492.5% for AGIs $75k-100k, 884.1% for AGIs $100k-200k)
Total itemized deductions: $30,750 (reported on 2.8% of returns)
Here:
$30,750
State:
$33,869
(% of AGI for various income ranges: 723.5% for AGIs $100k-200k)
Charity contributions: $12,933 (reported on 2.1% of returns)
Here:
$12,933
State:
$14,577
(% of AGI for various income ranges: 228.2% for AGIs $100k-200k)
Taxes paid: $7,425 (reported on 2.8% of returns)
43416:
$7,425
State:
$7,681
(% of AGI for various income ranges: 174.7% for AGIs $100k-200k)
Earned income credit: $1,807 (reported on 9.8% of returns)
Here:
$1,807
State:
$2,304
(% of AGI for various income ranges: 51.9% for AGIs below $25k, 49.2% for AGIs $25k-50k)
Percentage of individuals using paid preparers for their 2020 taxes: 96.5%
Here:
97%
State:
94%
(% for various income ranges: 94.9% for AGIs below $25k, 96.8% for AGIs $25k-50k, 96.2% for AGIs $50k-75k, 100.0% for AGIs $75k-100k, 95.8% for AGIs $100k-200k, 100.0% for AGIs over 200k)
Averages for the 2012 tax year for zip code 43416, filed in 2013:
Average Adjusted Gross Income (AGI) in 2012: $56,490 (Individual Income Tax Returns)
Here:
$56,490
State:
$54,926
Salary/wage: $47,396 (reported on 83.0% of returns)
Here:
$47,396
State:
$45,869
(% of AGI for various income ranges: 65.2% for AGIs below $25k, 70.4% for AGIs $25k-50k, 74.3% for AGIs $50k-75k, 72.7% for AGIs $75k-100k, 77.2% for AGIs $100k-200k, 39.0% for AGIs over 200k)
Taxable interest for individuals: $1,025 (reported on 36.2% of returns)
This zip code:
$1,025
Ohio:
$1,297
(% of AGI for various income ranges: 1.8% for AGIs below $25k, 0.8% for AGIs $25k-50k, 0.6% for AGIs $50k-75k, 0.5% for AGIs $75k-100k, 0.4% for AGIs $100k-200k, 0.7% for AGIs over 200k)
Ordinary dividends: $2,494 (reported on 25.5% of returns)
Here:
$2,494
State:
$5,821
(% of AGI for various income ranges: 3.0% for AGIs below $25k, 1.0% for AGIs $25k-50k, 0.9% for AGIs $50k-75k, 0.8% for AGIs $75k-100k, 1.6% for AGIs $100k-200k)
Net capital gain/loss in AGI: +$940 (reported on 17.7% of returns)
Here:
+$940
State:
+$11,232
(% of AGI for various income ranges: 0.5% for AGIs $75k-100k, 1.3% for AGIs $100k-200k)
Profit/loss from business: +$17,747 (reported on 12.1% of returns)
Here:
+$17,747
State:
+$12,773
(% of AGI for various income ranges: 4.8% for AGIs below $25k, 3.0% for AGIs $25k-50k, 1.5% for AGIs $50k-75k, 4.3% for AGIs $75k-100k, 7.3% for AGIs $100k-200k)
Taxable individual retirement arrangement distribution: $10,976 (reported on 14.9% of returns)
43416:
$10,976
Ohio:
$14,511
(% of AGI for various income ranges: 5.4% for AGIs below $25k, 4.0% for AGIs $25k-50k, 3.9% for AGIs $50k-75k, 2.2% for AGIs $75k-100k, 2.4% for AGIs $100k-200k)
Total itemized deductions: $16,810 (19% of AGI, reported on 36.2% of returns)
Here:
$16,810
State:
$21,278
Here:
19.0% of AGI
State:
18.8% of AGI
(% of AGI for various income ranges: 8.2% for AGIs below $25k, 9.3% for AGIs $25k-50k, 10.0% for AGIs $50k-75k, 10.6% for AGIs $75k-100k, 12.2% for AGIs $100k-200k, 13.0% for AGIs over 200k)
Charity contributions: $2,968 (reported on 26.2% of returns)
Here:
$2,968
State:
$3,943
(% of AGI for various income ranges: 1.4% for AGIs $25k-50k, 1.1% for AGIs $50k-75k, 1.5% for AGIs $75k-100k, 1.8% for AGIs $100k-200k, 1.6% for AGIs over 200k)
Taxes paid: $6,684 (reported on 36.2% of returns)
43416:
$6,684
State:
$9,568
(% of AGI for various income ranges: 1.7% for AGIs below $25k, 2.7% for AGIs $25k-50k, 3.4% for AGIs $50k-75k, 4.6% for AGIs $75k-100k, 5.9% for AGIs $100k-200k, 5.5% for AGIs over 200k)
Earned income credit: $2,015 (reported on 9.2% of returns)
Here:
$2,015
State:
$2,285
(% of AGI for various income ranges: 3.6% for AGIs below $25k, 0.6% for AGIs $25k-50k)
Percentage of individuals using paid preparers for their 2012 taxes: 60.3%
Here:
60%
State:
51%
(% for various income ranges: 48.8% for AGIs below $25k, 66.7% for AGIs $25k-50k, 60.7% for AGIs $50k-75k, 63.2% for AGIs $75k-100k, 66.7% for AGIs $100k-200k, 100.0% for AGIs over 200k)
Averages for the 2004 tax year for zip code 43416, filed in 2005:
Average Adjusted Gross Income (AGI) in 2004: $45,068 (Individual Income Tax Returns)
Here:
$45,068
State:
$44,480
Salary/wage: $40,951 (reported on 85.3% of returns)
Here:
$40,951
State:
$39,198
(% of AGI for various income ranges: 86.2% for AGIs below $10k, 60.4% for AGIs $10k-25k, 77.0% for AGIs $25k-50k, 79.4% for AGIs $50k-75k, 82.7% for AGIs $75k-100k, 75.5% for AGIs over 100k)
Taxable interest for individuals: $1,358 (reported on 53.2% of returns)
This zip code:
$1,358
Ohio:
$1,532
(% of AGI for various income ranges: 4.6% for AGIs below $10k, 3.5% for AGIs $10k-25k, 1.8% for AGIs $25k-50k, 1.7% for AGIs $50k-75k, 1.2% for AGIs $75k-100k, 0.6% for AGIs over 100k)
Taxable dividends: $1,967 (reported on 29.6% of returns)
Here:
$1,967
State:
$3,496
(% of AGI for various income ranges: 2.2% for AGIs below $10k, 2.4% for AGIs $10k-25k, 1.3% for AGIs $25k-50k, 1.0% for AGIs $50k-75k, 1.3% for AGIs $75k-100k, 1.2% for AGIs over 100k)
Net capital gain/loss: +$2,561 (reported on 20.7% of returns)
Here:
+$2,561
State:
+$8,582
(% of AGI for various income ranges: -1.5% for AGIs below $10k, 0.9% for AGIs $10k-25k, -0.1% for AGIs $25k-50k, 0.7% for AGIs $50k-75k, 1.1% for AGIs $75k-100k, 3.5% for AGIs over 100k)
Profit/loss from business: +$10,857 (reported on 12.8% of returns)
Here:
+$10,857
State:
+$10,813
(% of AGI for various income ranges: -1.9% for AGIs below $10k, 2.3% for AGIs $10k-25k, 2.8% for AGIs $25k-50k, 1.6% for AGIs $50k-75k, 4.1% for AGIs $75k-100k, 5.2% for AGIs over 100k)
Profit/loss from farming: +$2,383 (reported on 3.3% of returns)
Here:
+$2,383
State:
-$3,706
IRA payment deduction: $2,520 (reported on 1.8% of returns)
43416:
$2,520
Ohio:
$2,794
Self-employed pension: $7,583 (reported on 0.8% of returns)
Here:
$7,583
Ohio:
$13,981
Total itemized deductions: $15,193 (21% of AGI, reported on 38.1% of returns)
Here:
$15,193
State:
$17,503
Here:
21.4% of AGI
State:
20.8% of AGI
(% of AGI for various income ranges: 10.5% for AGIs $10k-25k, 10.2% for AGIs $25k-50k, 12.6% for AGIs $50k-75k, 14.8% for AGIs $75k-100k, 16.1% for AGIs over 100k)
Charity contributions deductions: $2,377 (3% of AGI, reported on 32.5% of returns)
Here:
$2,377
State:
$3,087
Here:
3.2% of AGI
State:
3.4% of AGI
(% of AGI for various income ranges: 1.3% for AGIs $10k-25k, 0.9% for AGIs $25k-50k, 1.3% for AGIs $50k-75k, 2.0% for AGIs $75k-100k, 3.1% for AGIs over 100k)
Total tax: $5,490 (reported on 79.9% of returns)
43416:
$5,490
State:
$6,781
(% of AGI for various income ranges: 1.7% for AGIs below $10k, 4.0% for AGIs $10k-25k, 7.2% for AGIs $25k-50k, 9.0% for AGIs $50k-75k, 10.1% for AGIs $75k-100k, 15.6% for AGIs over 100k)
Earned income credit: $1,566 (reported on 7.0% of returns)
Here:
$1,566
State:
$1,696
Percentage of individuals using paid preparers for their 2004 taxes: 59.4%
Here:
59%
State:
55%
(% for various income ranges: 41.3% for AGIs below $10k, 60.2% for AGIs $10k-25k, 66.6% for AGIs $25k-50k, 61.0% for AGIs $50k-75k, 66.9% for AGIs $75k-100k, 60.0% for AGIs over 100k)
Household received Food Stamps/SNAP in the past 12 months: 103 Household did not receive Food Stamps/SNAP in the past 12 months: 1,118
Women who had a birth in the past 12 months: 95 (98 now married, 0 unmarried) Women who did not have a birth in the past 12 months: 489 (347 now married, 141 unmarried)
Housing units in zip code 43416 with a mortgage: 614 (106 second mortgage, 2 home equity loan, 92 both second mortgage and home equity loan) Houses without a mortgage: 43
Median monthly owner costs for units with a mortgage: $1,282 Median monthly owner costs for units without a mortgage: $566
Residents with income below the poverty level in 2022:
This zip code:
8.6%
Whole state:
13.4%
Residents with income below 50% of the poverty level in 2022:
This zip code:
3.3%
Whole state:
7.0%
Median number of rooms in houses and condos:
Here:
7.2
State:
6.7
Median number of rooms in apartments:
Here:
4.7
State:
4.4
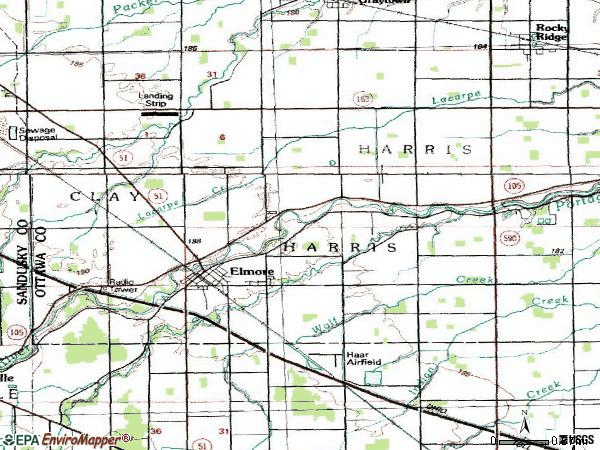
Notable locations in this zip code not listed on our city pages
Notable locations in zip code 43416: Sugar Creek Golf Course (A), Harris - Elmore Fire Department Emergency Medical Services (B), Harris-Elmore Public Library (C), Bench's Greenhouse (D). Display/hide their locations on the map
Churches in zip code 43416 include: Bethel United Brethren Church (A), Grace Lutheran Church (B), Kingdom Hall Church (C), Christ Community Church (D), Elmore Church of God (E), Saint Johns United Church of Christ (F), Saint Paul Trinity United Methodist Church (G), Trinity Lutheran Church (H). Display/hide their locations on the map
In group quarters: 31 (-1 institutionalized population)
Size of family households: 461 2-persons, 170 3-persons, 126 4-persons, 57 5-persons, 4 6-persons, 15 7-or-more-persons
Size of nonfamily households: 360 1-person, 6 2-persons, 19 4-persons
561 married couples with children.
72 single-parent households (4 men, 68 women).
96.5% of residents of 43416 zip code speak English at home.
2.2% of residents speak Spanish at home (53% very well, 47% well).
0.4% of residents speak other Indo-European language at home (100% very well).
0.5% of residents speak Asian or Pacific Island language at home (100% very well).
Foreign born population: 2 (0.1%) (100.0% of them are naturalized citizens)
This zip code:
0.1%
Whole state:
5.0%
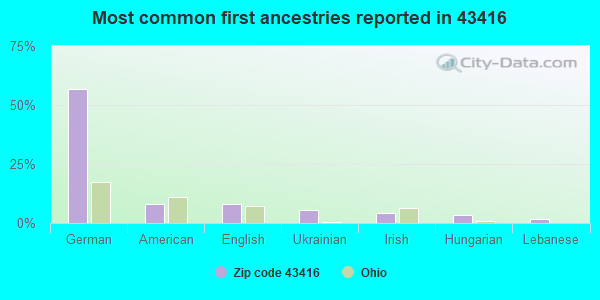
57%German
8%American
8%English
6%Ukrainian
4%Irish
3%Hungarian
2%Lebanese
Year of entry for the foreign-born population
02010 or later
12000 to 2009
01990 to 1999
1Before 1990
Facilities with environmental interests located in this zip code:
BRUSH WELLMAN INC * (14710 WEST PORTAGE RIVER SOUTH ROAD in ELMORE, OH)
AIR MAJOR (AIRS/AFS) (Integrated Compliance Information System) - ICIS-05-1998-0014, FORMAL ENFORCEMENT ACTION CRITERIA AND HAZARDOUS AIR POLLUTANT INVENTORY (Inventory of air pollution sources) STATE MASTER (Ohio general info) - PCS-OH0002518, National Pollutant Discharge Elimination System Permit, RCRA-OHD004212999, HAZARDOUS WASTE PROGRAM, AIR MAJOR, TRIS-43416BRSHWSOUTH, TRI REPORTER, SDWIS-6230812, DRINKING WATER PROGRAM National Pollutant Discharge Elimination System MAJOR (Tracking pollutant discharge elimination systems) - permit HAZARDOUS WASTE BIENNIAL REPORTER (Resource Conservation and Recovery Act (tracking hazardous waste)) Large Quantity Generators, more that 1000 kg of hazardous waste/month (Resource Conservation and Recovery Act (tracking hazardous waste)) - notification TSD (Resource Conservation and Recovery Act (tracking hazardous waste)) - notification TRI REPORTER (Tracking of toxic chemicals releasing facilities) Business SIC classification: PRIMARY SMELTING AND REFINING OF COPPER; PRIMARY SMELTING AND REFINING OF NONFERROUS METALS, EXCEPT COPPER AND ALUMINUM; ROLLING, DRAWING, AND EXTRUDING OF COPPER Business NAICS classification: PRIMARY SMELTING AND REFINING OF COPPER.; COPPER ROLLING, DRAWING, AND EXTRUDING. Organizations: BRUSH WELLMAN, INC (CONTACT/OPERATOR)
, BRUSH WELLMAN INC. (CONTACT/OWNER)
, BRUSH WELLMAN, INC (CONTACT/OWNER)
Alternative names: BRUSH WELLMAN INC ELMORE PLANT, BRUSHWELLMAN INC. ELMORE PLANT, BRUSHWELLMAN INC. ELMORE PLANT
Housing units lacking complete plumbing facilities: 0.3% Housing units lacking complete kitchen facilities: 4.4%
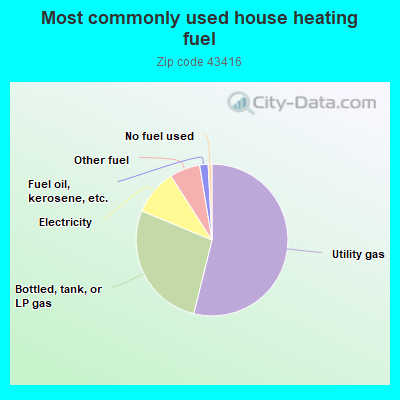
54.0%Utility gas
27.4%Bottled, tank, or LP gas
9.7%Electricity
6.5%Other fuel
1.8%Fuel oil, kerosene, etc.
0.8%No fuel used
Population in 1990: 3,230.
Place of birth for U.S.-born residents:
This state: 2,344
Northeast: 60
Midwest: 191
South: 171
West: 120
63% of the 43416 zip code residents lived in the same house 5 years ago. Out of people who lived in different houses, 37% lived in this county. Out of people who lived in different counties, 50% lived in Ohio.
97% of the 43416 zip code residents lived in the same house 1 year ago. Out of people who lived in different houses, 25% moved from this county. Out of people who lived in different houses, 73% moved from different county within same state. Out of people who lived in different houses, 11% moved from different state. Out of people who lived in different houses, 10% moved from abroad.
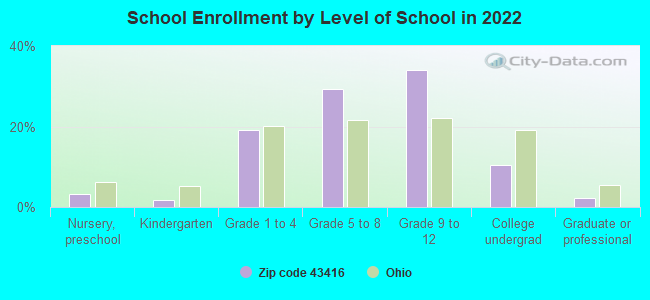
Private vs. public school enrollment:
Students in private schools in grades 1 to 8 (elementary and middle school): 20
Here:
7.5%
Ohio:
16.0%
Students in private schools in grades 9 to 12 (high school): 34
Here:
18.1%
Ohio:
13.1%
Students in private undergraduate colleges: 28
Here:
48.2%
Ohio:
22.3%
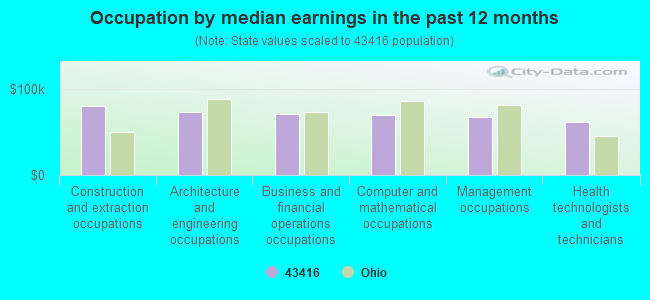
Occupation by median earnings in the past 12 months ($)
80,003Construction and extraction occupations
73,400Architecture and engineering occupations
70,982Business and financial operations occupations
70,006Computer and mathematical occupations
66,632Management occupations
61,211Health technologists and technicians
Top industries in this zip code by the number of employees in 2005:
Other Services (except Public Administration): Religious Organizations (50-99 employees: 1 establishment, 10-19 employees: 1 establishment, 5-9 employees: 2 establishments, 1-4 employees: 3 establishments)
Accommodation and Food Services: Full-Service Restaurants (10-19: 2, 1-4: 1)
Health Care and Social Assistance: Offices of Physicians (except Mental Health Specialists) (10-19: 1, 5-9: 1)
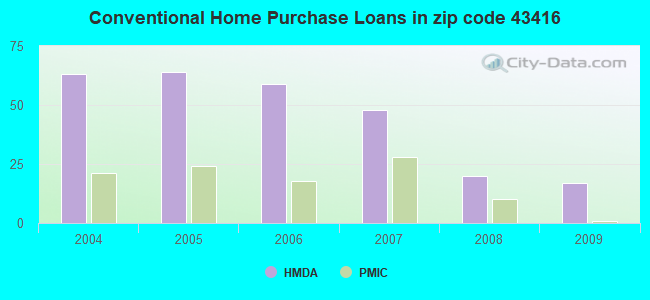
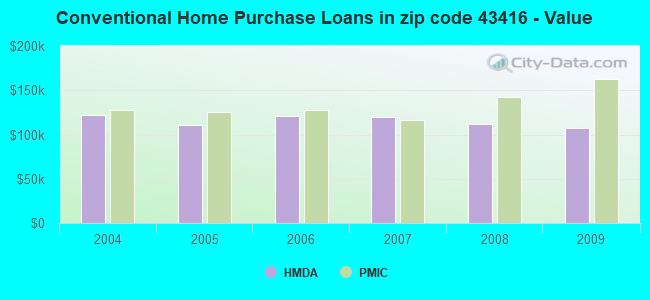
Detailed PMIC statistics for the following Tracts:0509.00
, 0510.00
2002 - 2018 National Fire Incident Reporting System (NFIRS) incidents
Based on the data from the years 2002 - 2018 the average number of fire incidents per year is 15. The highest number of reported fires - 32 took place in 2009, and the least - 8 in 2006. The data has a dropping trend.
When looking into fire subcategories, the most incidents belonged to: Structure Fires (40.3%), and Outside Fires (39.5%).
Fire incident types reported to NFIRS in Zip Code 43416


+$2,383
-$3,706
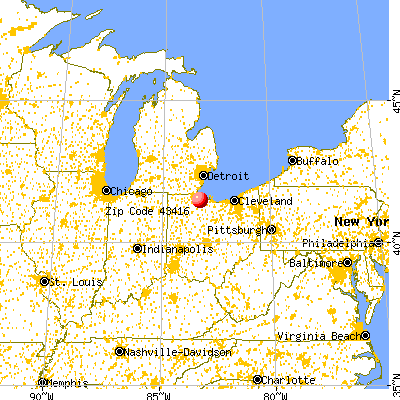
 Nearest zip codes: 43458, 43442, 43432, 43469, 43445, 43430.


 Based on the data from the years 2002 - 2018 the average number of fire incidents per year is 15. The highest number of reported fires - 32 took place in 2009, and the least - 8 in 2006. The data has a dropping trend.
 When looking into fire subcategories, the most incidents belonged to: Structure Fires (40.3%), and Outside Fires (39.5%).